
Market
Dogecoin Faces $200 Million Liquidation If It Slips To This Price
Dogecoin (DOGE) price has recently struggled with momentum, failing to break key resistance levels. As of press time, DOGE is holding at $0.169, just above the crucial support of $0.164.
This stagnation hints at the potential for further declines, but key investors are still holding strong.
Dogecoin Is Facing Challenges
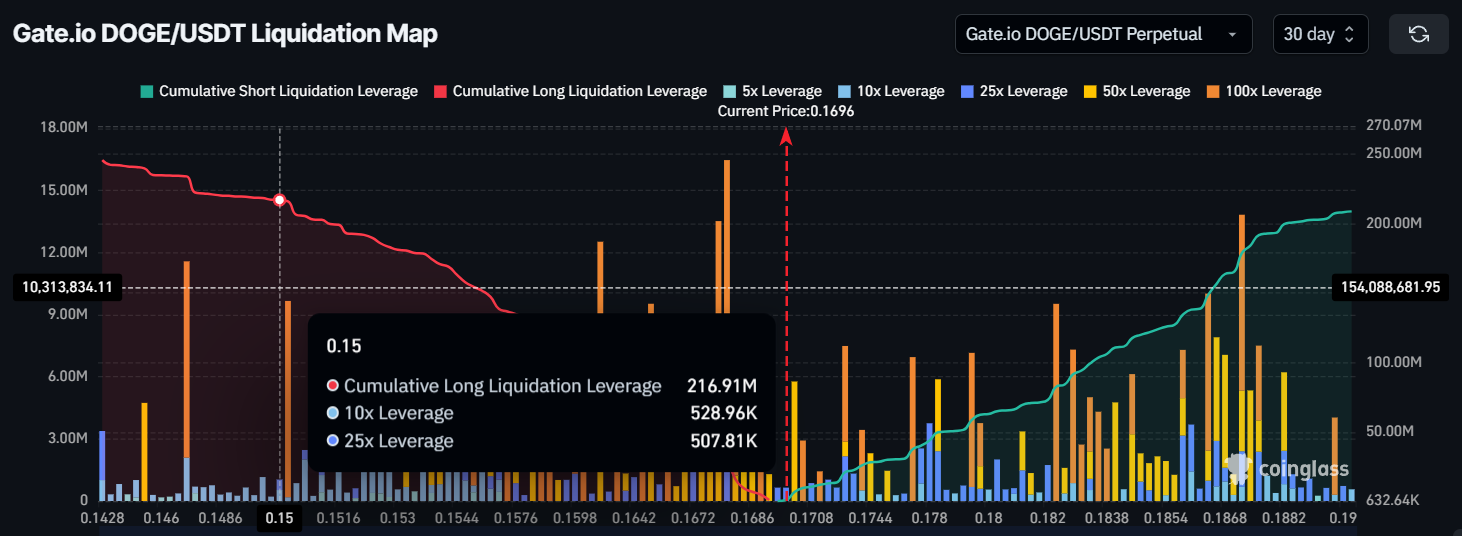
The liquidation map reveals that approximately $216 million worth of long positions could face liquidation if Dogecoin’s price declines to $0.150. This price is not far from its current critical support of $0.164.
If DOGE drops below this level, the liquidation of long contracts could fuel a further sell-off, pushing the price lower. This would likely prompt more bearish sentiment among traders, discouraging new investments in the meme coin.
Moreover, the threat of liquidation looms large as the price hovers near critical support levels. If DOGE continues to weaken, traders may be more inclined to exit positions, exacerbating the downtrend.
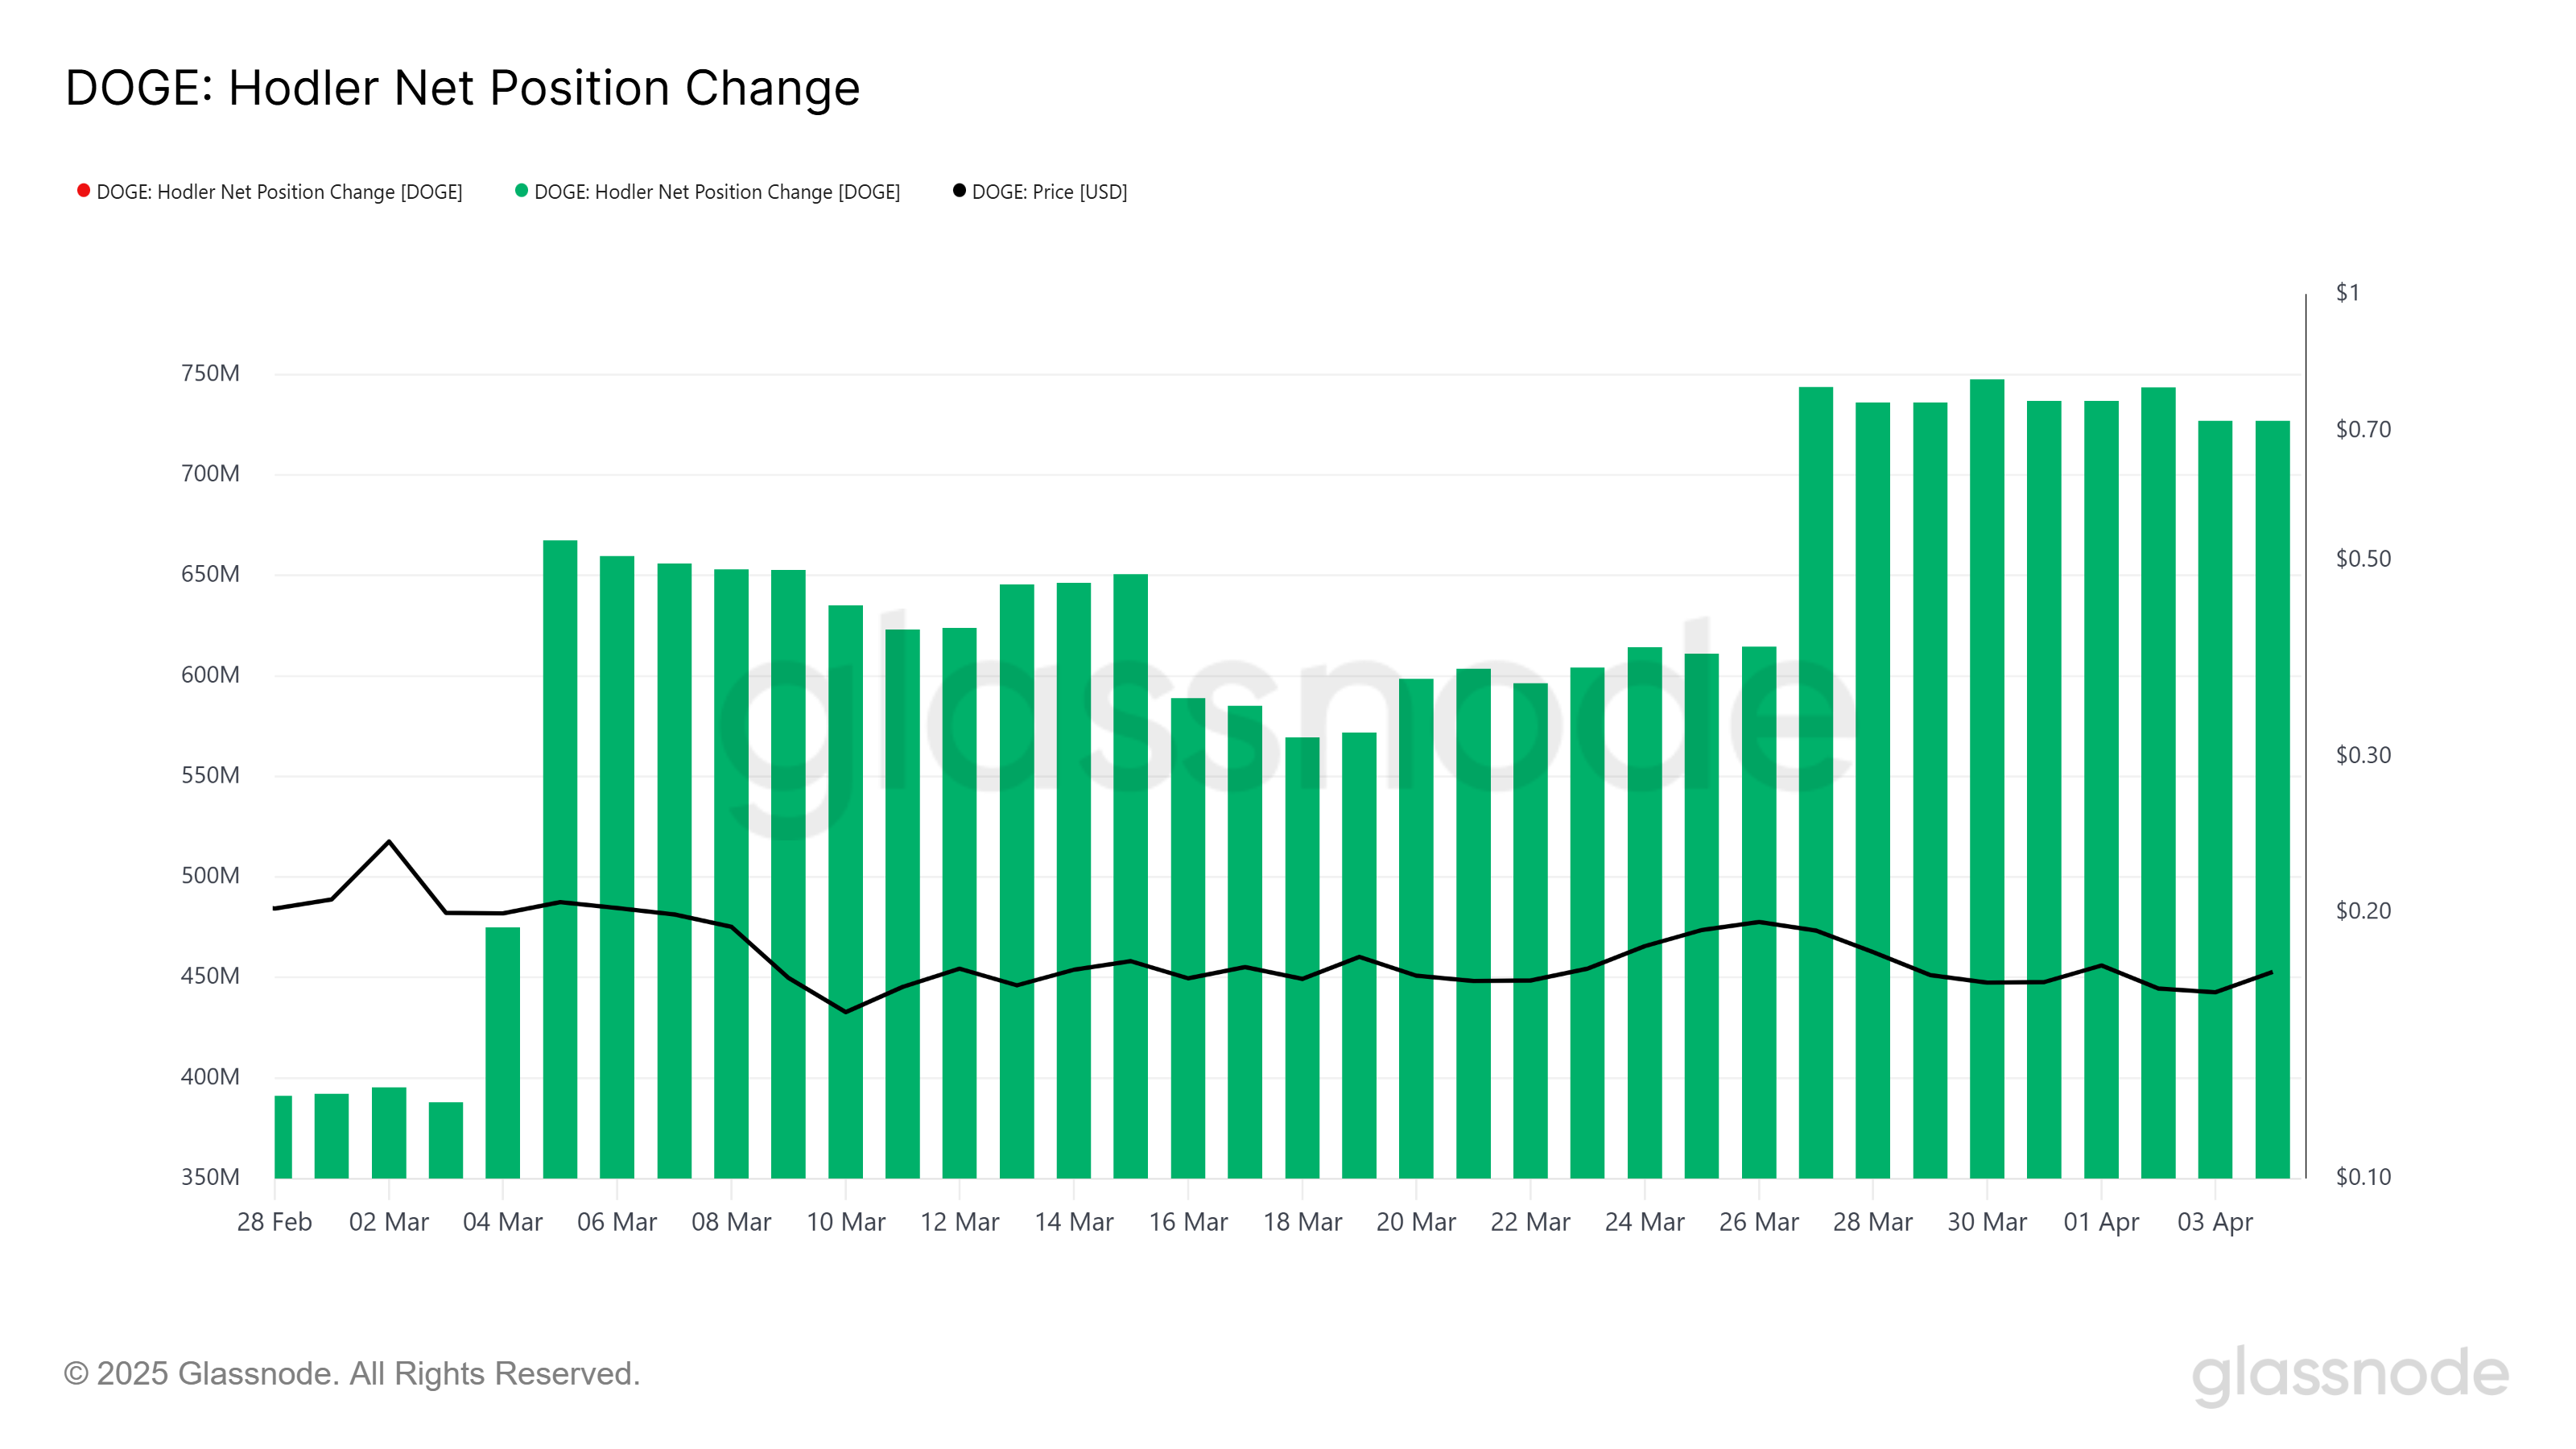
On the other hand, Dogecoin’s long-term holders (LTHs) seem to be focused on accumulating the asset at its current low price.
The HODLer net position change shows an increasing number of LTHs who are confident in eventual price recovery. As DOGE remains relatively inexpensive, these investors view the current conditions as a potential opportunity for future gains.
This accumulation by LTHs could serve as a buffer against further price declines. Their confidence in Dogecoin’s recovery and long-term potential is helping to sustain the current price levels. If these holders continue to accumulate, it could prevent a drastic drop and even pave the way for a future price rebound.
DOGE Price Correction Unlikely
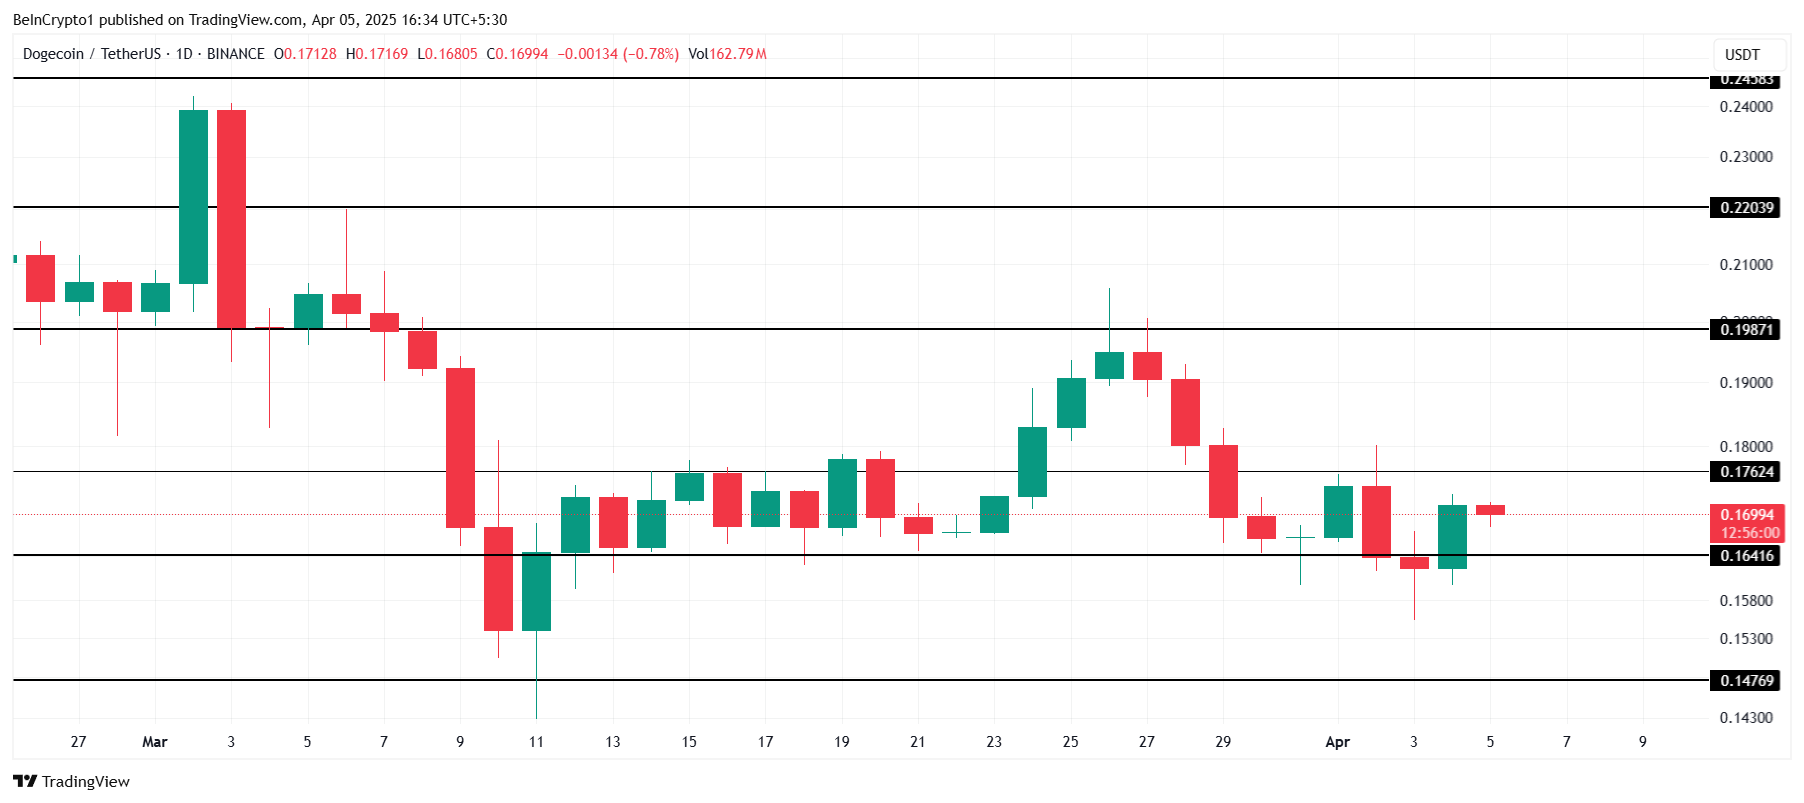
At the time of writing, Dogecoin is trading at $0.169, just above the critical support of $0.164. The altcoin has been unable to break the $0.176 resistance for several days, showing signs of stagnation.
The likely outcome is continued consolidation above $0.164 as investors await a potential catalyst for upward movement.
If Dogecoin manages to breach the $0.176 resistance, it could quickly rise to $0.198, marking a positive shift in sentiment. This would likely encourage more buying activity and help push the price higher.
However, without sufficient momentum, DOGE will remain trapped within its current range, potentially facing further consolidation.
If the price falls below $0.164, it could slip to $0.147 in the coming days, triggering more than $216 million in long liquidations. This scenario would signal a shift toward bearish momentum, invalidating Dogecoin’s bullish outlook.
The coming days will be crucial in determining whether DOGE can recover or continue its decline.
Disclaimer
In line with the Trust Project guidelines, this price analysis article is for informational purposes only and should not be considered financial or investment advice. BeInCrypto is committed to accurate, unbiased reporting, but market conditions are subject to change without notice. Always conduct your own research and consult with a professional before making any financial decisions. Please note that our Terms and Conditions, Privacy Policy, and Disclaimers have been updated.


FARTCOIN has surged more than 40% in the last seven days and is up around 250% over the past 30 days, making it one of the top-performing assets among the largest meme coins.
The explosive rally has caught the attention of traders, but recent indicators suggest momentum may be shifting. While the uptrend remains intact, signs of cooling buying pressure are starting to emerge.
FARTCOIN BBTrend Shows Buying Pressure Could Be Easing
FARTCOIN’s BBTrend indicator is currently at 1.68, a sharp drop from 7.79 just two days ago, when the token experienced a nearly 43% price surge and became one of the top performers among meme coins.
This steep decline in BBTrend reflects a significant cooling in bullish momentum following the explosive rally.
While BBTrend values above zero still suggest upward pressure, the sharp drop signals that the trend is losing strength and that the recent hype may be fading.
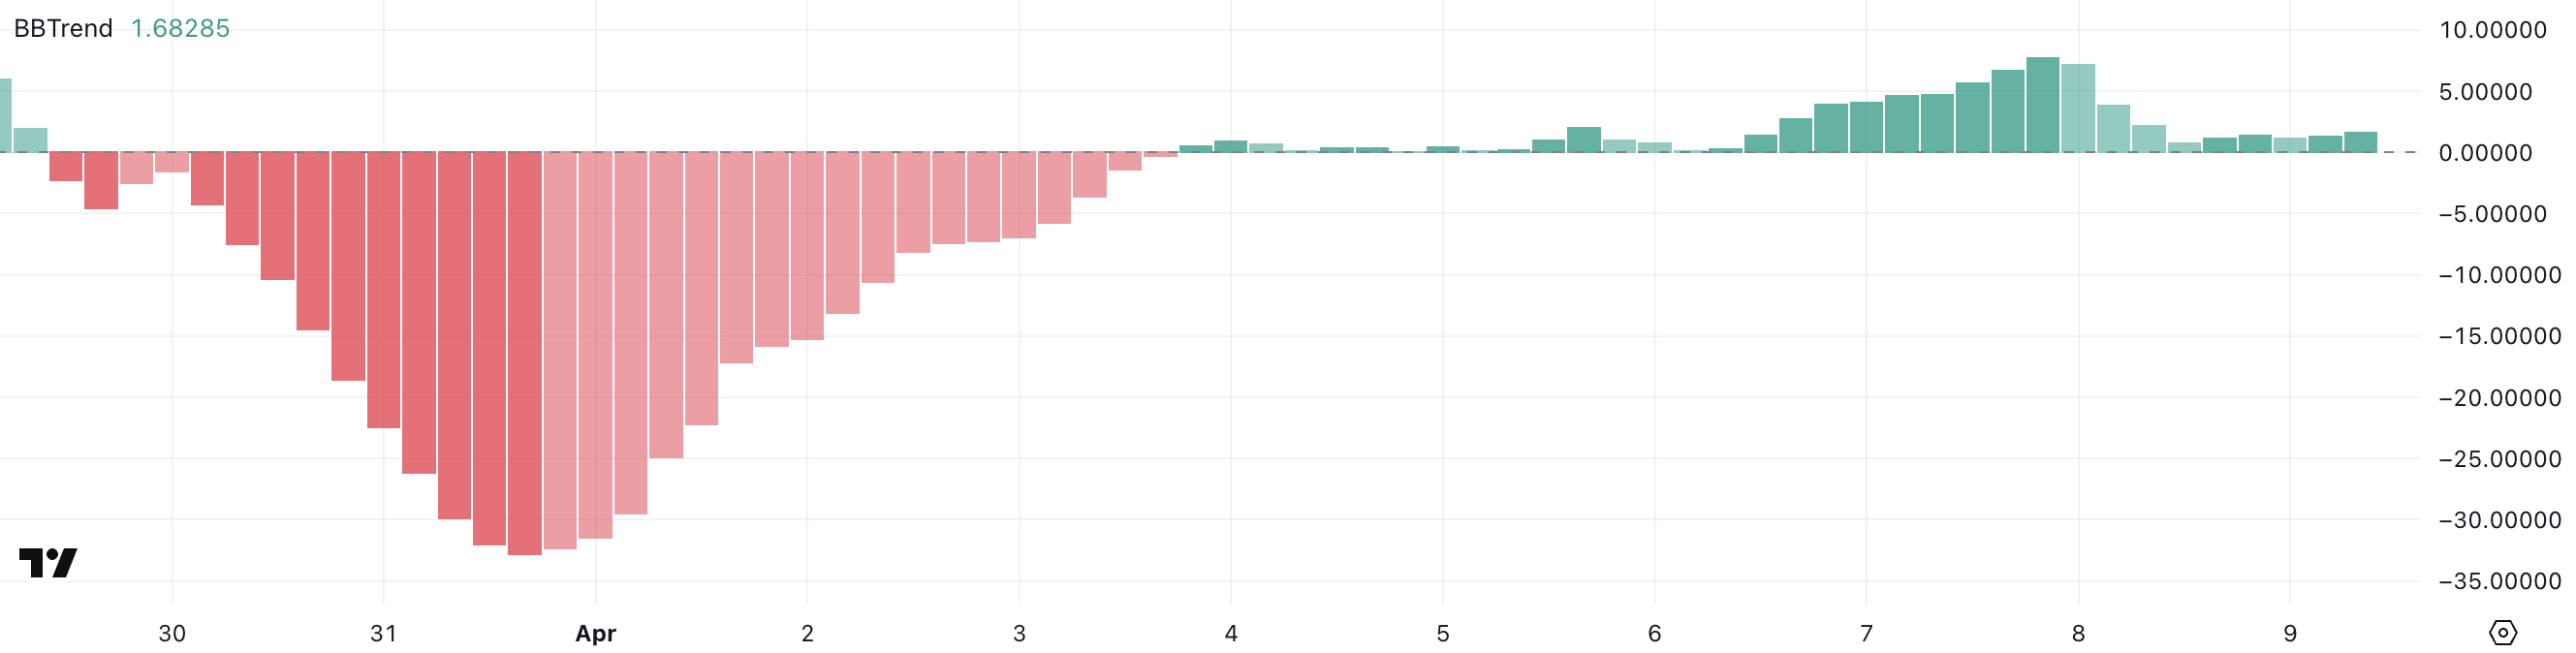
The BBTrend (Bollinger Band Trend) is a volatility-based indicator that gauges the strength and direction of a trend by analyzing price positioning relative to the Bollinger Bands.
Positive values indicate bullish momentum, while negative readings point to bearish momentum; the farther the number from zero, the stronger the trend.
With FARTCOIN’s BBTrend falling from elevated levels to near-flat territory, it suggests that price action is becoming more range-bound and potentially vulnerable to a pullback if buying interest doesn’t return soon.
FARTCOIN ADX Shows The Uptrend Is Still Here
FARTCOIN’s ADX is currently at 22.31, up significantly from 13.16 just two days ago, though slightly below yesterday’s peak of 23.83.
This steady rise in the Average Directional Index suggests that the strength of FARTCOIN’s uptrend is building, even if momentum briefly peaked.
The move from a low-trend environment into the low-20s range indicates growing conviction behind the recent bullish move despite some near-term fluctuations.
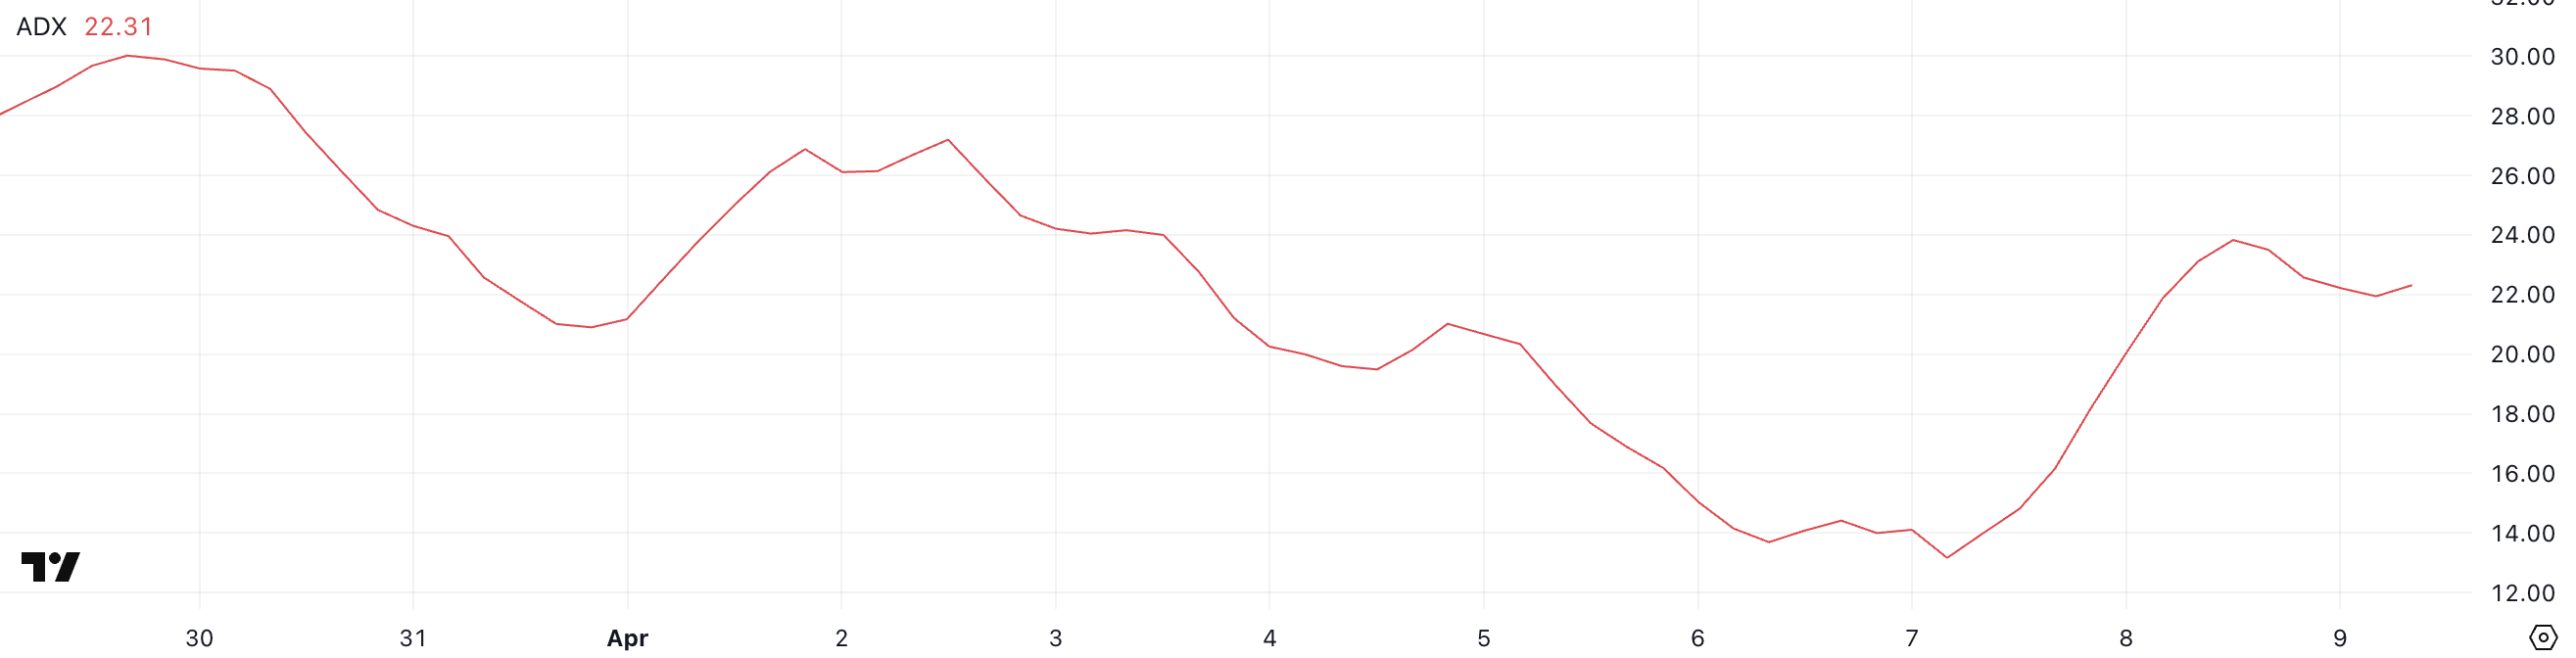
The ADX (Average Directional Index) is a widely used indicator that measures the strength of a trend, regardless of its direction.
Values below 20 typically signal a weak or non-existent trend, while values above 25 are associated with strong and sustained directional movement. With FARTCOIN’s ADX now climbing into the low-20s, it’s approaching the threshold where breakouts can gain traction.
If this trend strength continues to build, it could support further upside price action, but bulls will want to see the ADX push decisively above 25 to confirm momentum is strong enough to sustain the uptrend.
Will FARTCOIN Break Above $0.80?
FARTCOIN price is currently riding an uptrend, and if bullish momentum holds, it could soon test resistance at $0.75.
A breakout above that level would be significant, potentially paving the way for a move toward $1 for the first time since February.
Such a breakout could attract renewed attention and volume, reinforcing the bullish case in the short term.

However, the uptrend remains fragile, especially as meme coins sector has been struggling in the last months.
If FARTCOIN loses steam and slips below immediate support at $0.538, it could quickly descend to test the next critical zones at $0.38 and $0.35—two tightly packed support levels that may provide temporary relief.
Should both fail to hold, the selloff could accelerate toward $0.26 and even $0.19, though such a move would likely require a steep and sustained bearish reversal.
Disclaimer
In line with the Trust Project guidelines, this price analysis article is for informational purposes only and should not be considered financial or investment advice. BeInCrypto is committed to accurate, unbiased reporting, but market conditions are subject to change without notice. Always conduct your own research and consult with a professional before making any financial decisions. Please note that our Terms and Conditions, Privacy Policy, and Disclaimers have been updated.

Hedera’s Long/Short ratio has soared to a 30-day high, signaling a bullish shift in market sentiment.
This comes amid severe market volatility and huge long liquidations across many assets. With growing bullish sentiment, HBAR could reverse its downward trend and record gains in the near term.
HBAR Shows Bullish Signs as Long Positions Surge
Despite a broader market downturn that has weighed on altcoin prices, HBAR is bucking the trend in terms of investor positioning.
Coinglass data shows that many traders are entering long positions on the token, indicating growing confidence in a potential upside move. This is reflected by its Long/Short, which currently sits at a 30-day high of 1.06 at press time.

The long/short ratio measures the proportion of long positions (bets on price increases) to short positions (bets on price declines) in the market. A ratio below one means there are more short positions than long positions.
Conversely, as with HBAR, when an asset’s long/short ratio is above one, more traders are holding long positions than short positions, indicating a bullish market sentiment.
Further, HBAR’s open interest has climbed, supporting this bullish outlook. As of this writing, it is at $142 million, rising 3% in the past 24 hours. Notably, during this period, HBAR’s price is down 2%.

When an asset’s price falls, but open interest rises, it suggests that traders are still actively entering new positions, potentially anticipating a future price rebound despite the current decline.
A combined reading of HBAR’s long/short ratio and rising open interest amid falling prices signals that the majority of its traders have a bullish outlook. This indicates that even with price declines, HBAR traders anticipate an upward trend in the near future.
Profit-Taking Threatens HBAR’s Rally
At press time, HBAR exchanges hands at $0.15. The gradual resurgence in bullish sentiment and new demand could reverse its current downtrend and push HBAR toward $0.17.

However, if profit-taking continues and bullish pressure becomes subdued again, HBAR could contain its decline and fall to $0.11.
Disclaimer
In line with the Trust Project guidelines, this price analysis article is for informational purposes only and should not be considered financial or investment advice. BeInCrypto is committed to accurate, unbiased reporting, but market conditions are subject to change without notice. Always conduct your own research and consult with a professional before making any financial decisions. Please note that our Terms and Conditions, Privacy Policy, and Disclaimers have been updated.

Donald Trump announced today that he’s instituting a 90-day pause on all tariffs except those on China. Bitcoin has surged over $80,000, while altcoins like XRP, Solana, and Cardano surged more than 10% in just minutes of the announcement.
The Dow Jones and stock market reacted similarly, surging by 2,000 points after the news. The US President has now added a total of 125% tariff on China, while pausing others.
Trump Reverses Tariff Plan
Since Donald Trump has made huge tariffs a cornerstone of his financial policy, the markets have reacted with a huge amount of uncertainty. After imposing 104% tariffs against China last night, however, Trump has made a shocking reversal. Although the tariffs against China will still stand, he is repealing those on all other nations.
This news immediately caused a substantial rally in the markets. The Dow Jones responded at 1:30 PM Eastern Time by shooting upwards over 2000 points, and this was mirrored in other high-profile stocks. The markets have been desperate for a form of relief, and it looks like it’s here.
Disclaimer
In adherence to the Trust Project guidelines, BeInCrypto is committed to unbiased, transparent reporting. This news article aims to provide accurate, timely information. However, readers are advised to verify facts independently and consult with a professional before making any decisions based on this content. Please note that our Terms and Conditions, Privacy Policy, and Disclaimers have been updated.

NFT Drama Ends For Shaquille O’Neal With Hefty $11 Million Settlement

FARTCOIN Jumps 160% in 30 Days but Momentum Fades
Ethereum Price Signals Strong Recovery After Forming Historical Pattern From 2020

HBAR’s Long/Short Ratio Hits Monthly Peak
Crypto Market Rallies After Trump’s 90-Day Pause on Tariffs
Binance Futures To Launch LDUSDT Reward-Bearing Margin Asset

2.52 Million Altcoins Are Ruining Crypto’s Future

Animoca Brands Valuation Tanks 75% In Two Years, Here’s Why

Crypto exchange BingX hacked for $43 million

Are The Big Players Losing Interest?

Hong Kong’s Securities Association Tips Authorities On Crypto Self-Regulation

Coinbase cbBTC Set to go Live on Solana
2.52 Million Altcoins Are Ruining Crypto’s Future
Animoca Brands Valuation Tanks 75% In Two Years, Here’s Why
Crypto exchange BingX hacked for $43 million
Are The Big Players Losing Interest?
Hong Kong’s Securities Association Tips Authorities On Crypto Self-Regulation
Coinbase cbBTC Set to go Live on Solana
-

 Market23 hours ago
US DOJ Will No Longer Investigate Crypto Exchanges
-
 Regulation22 hours ago
US SEC Makes Important Move in Ripple Case, Here’s All
-

 Market22 hours ago
Cardano (ADA) Surges 8% as Bulls Push for Breakout
-
 Market21 hours ago
Crypto Stocks Suffer As Trump Confirms 104% Tariffs on China
-

 Ethereum20 hours ago
Ethereum Network Performance Tumbles As Total Transaction Fees Drops To New Lows
-

 Market24 hours ago
Yellow Card Aims to Replace SWIFT with Stablecoins in 5 Years
-
 Altcoin23 hours ago
Why Is XRP Price Falling After ETF Hype?
-
 Bitcoin14 hours ago
How Trump’s Tariffs Threaten Bitcoin Mining in the US