
Market
Celestia (TIA) Price Sees 21% Jump, Market Eyes Key Resistance

Celestia (TIA) has surged by 21% over the past four days, sparking interest in the sustainability of this upward trend. While the rise is promising, shifts in key indicators raise questions about its strength.
TIA is gaining momentum without entering overbought territory, indicating room for further growth. Additionally, the EMA lines currently show a neutral stance. As market conditions evolve, keeping a close eye on these indicators will be essential to determine if TIA can maintain its recent gains.
TIA ADX Raises an Important Question About the Current Uptrend
Although the TIA price has risen 21% in the last four days, it’s important to check the current trend. The Average Directional Index (ADX) for TIA is currently at 21.33, down from 40.81 just three days ago. This decline suggests that the strength of the current trend is weakening, indicating that the upward momentum may not be as strong as it appears.
ADX readings above 25 typically indicate a strong trend, while values below 20 signal a weak trend. The ADX measures the strength of a trend regardless of its direction, with thresholds of 0-25 indicating a weak trend, 25-50 indicating a strong trend, and above 50 signaling an extremely strong trend.
Read More: 11 Cryptos To Add To Your Portfolio Before Altcoin Season
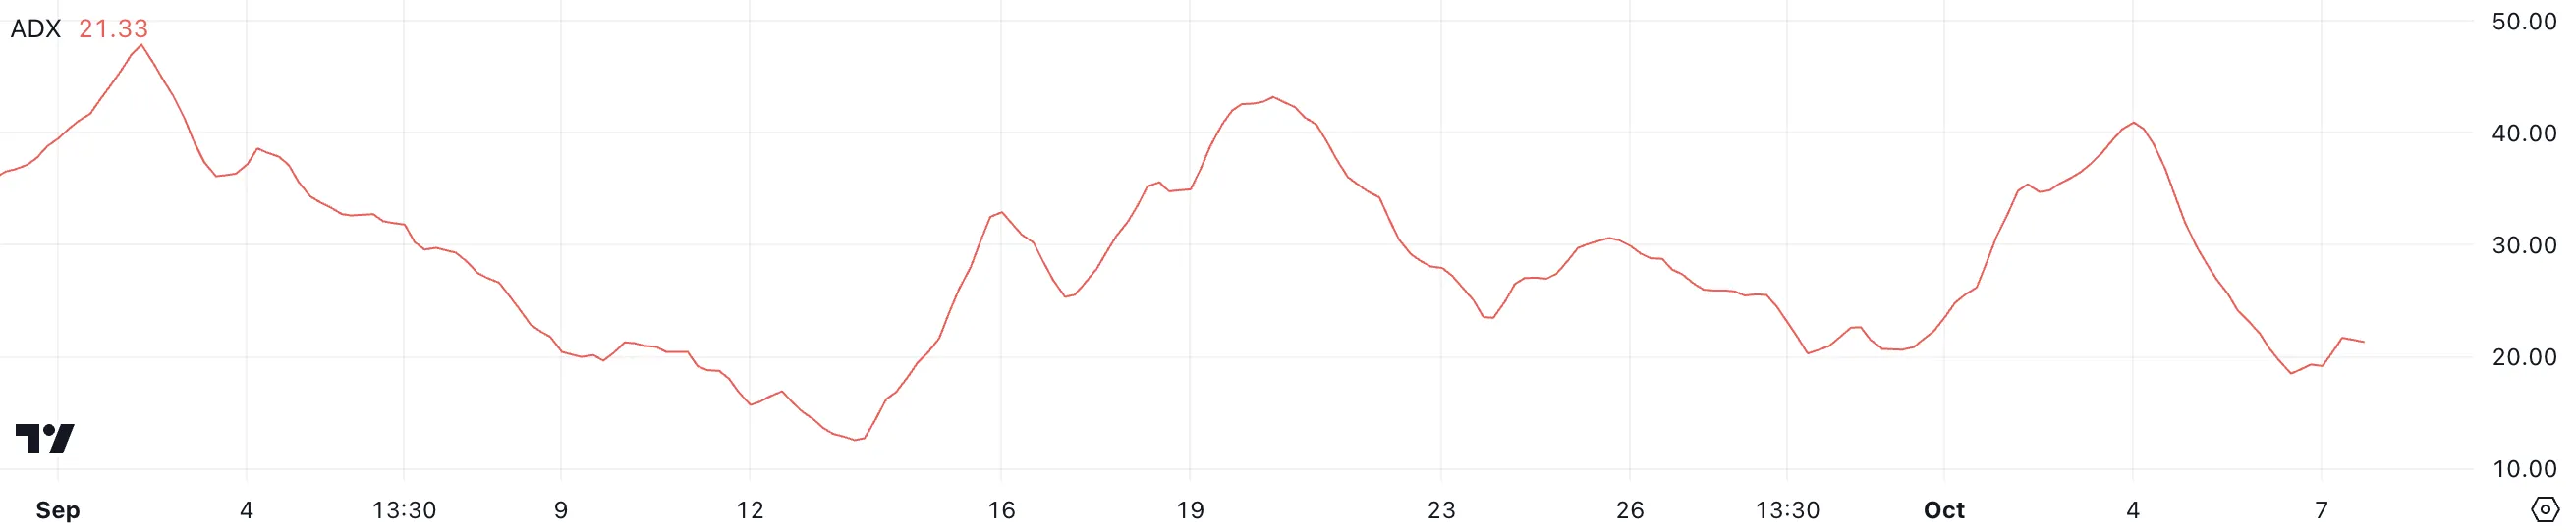
Given that TIA is presently in an uptrend, the recent drop in ADX raises concerns about potential instability. As such, it’s crucial to continuously monitor the ADX to assess whether this upward momentum can be sustained and if the price will keep growing.
With the ADX at 21.33, it’s positioned on the cusp of a weak trend, highlighting the importance of vigilance in observing how market conditions evolve in the coming days. This will help determine if TIA can maintain its recent gains or if a pullback is imminent.
Celestia RSI Is Far From Overbought State
TIA’s Relative Strength Index (RSI) is currently at 56.89, rising from roughly 31 just three days ago. This significant increase matters because it suggests a shift in momentum. That indicates that TIA price is gaining strength after a period of relative weakness.
The RSI is a momentum oscillator that measures the speed and change of price movements, ranging from 0 to 100. An RSI below 30 generally indicates an oversold asset, while an RSI above 70 suggests it’s overbought.
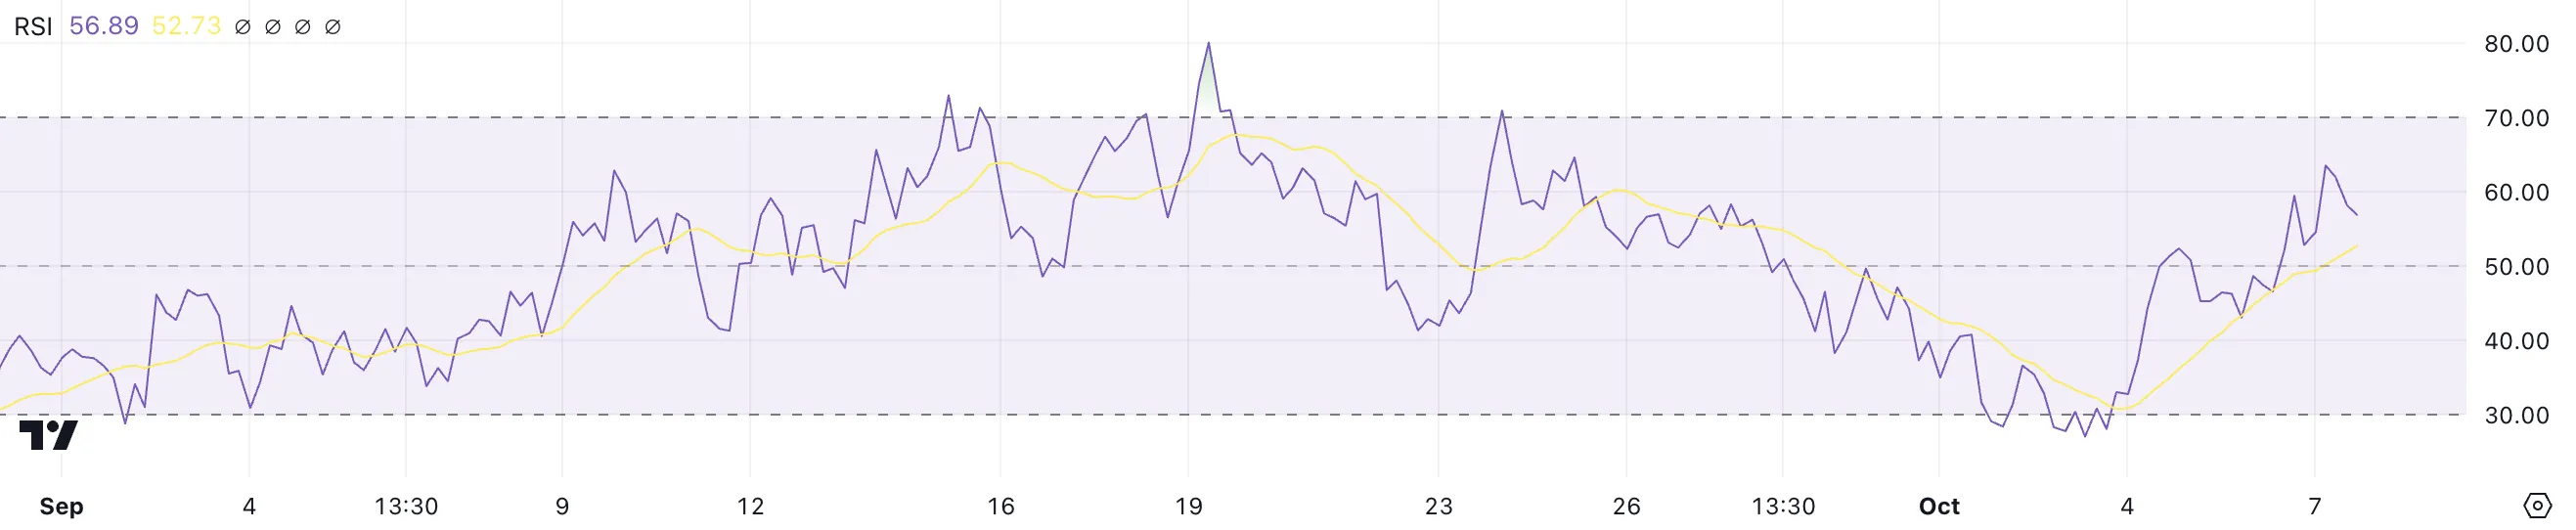
TIA’s current RSI of 56.89 comfortably stays below the overbought threshold. That implies that there is potential for further price growth. Monitoring the RSI closely will provide insights into whether TIA can sustain this positive trend without entering an overbought condition.
TIA Price Prediction: A Potential 26% Rise Next?
TIA’s Exponential Moving Average (EMA) lines are currently looking neutral, with short-term lines on the rise and nearing a crossover above the long-term lines. This indicates that recent price action is becoming more bullish, suggesting a potential shift in momentum.
If the short-term EMA lines cross above the long-term lines, they will form a “golden cross,” a pattern often linked to the start of a strong uptrend. This signals that recent prices are gaining momentum relative to the longer-term trend, which can boost investor confidence.
EMA lines, unlike simple moving averages, give more weight to recent prices, making them more responsive to new information. This responsiveness can provide early signals of trend changes, making the golden cross an important indicator for potential price growth.
Read more: 10 Best Altcoin Exchanges In 2024
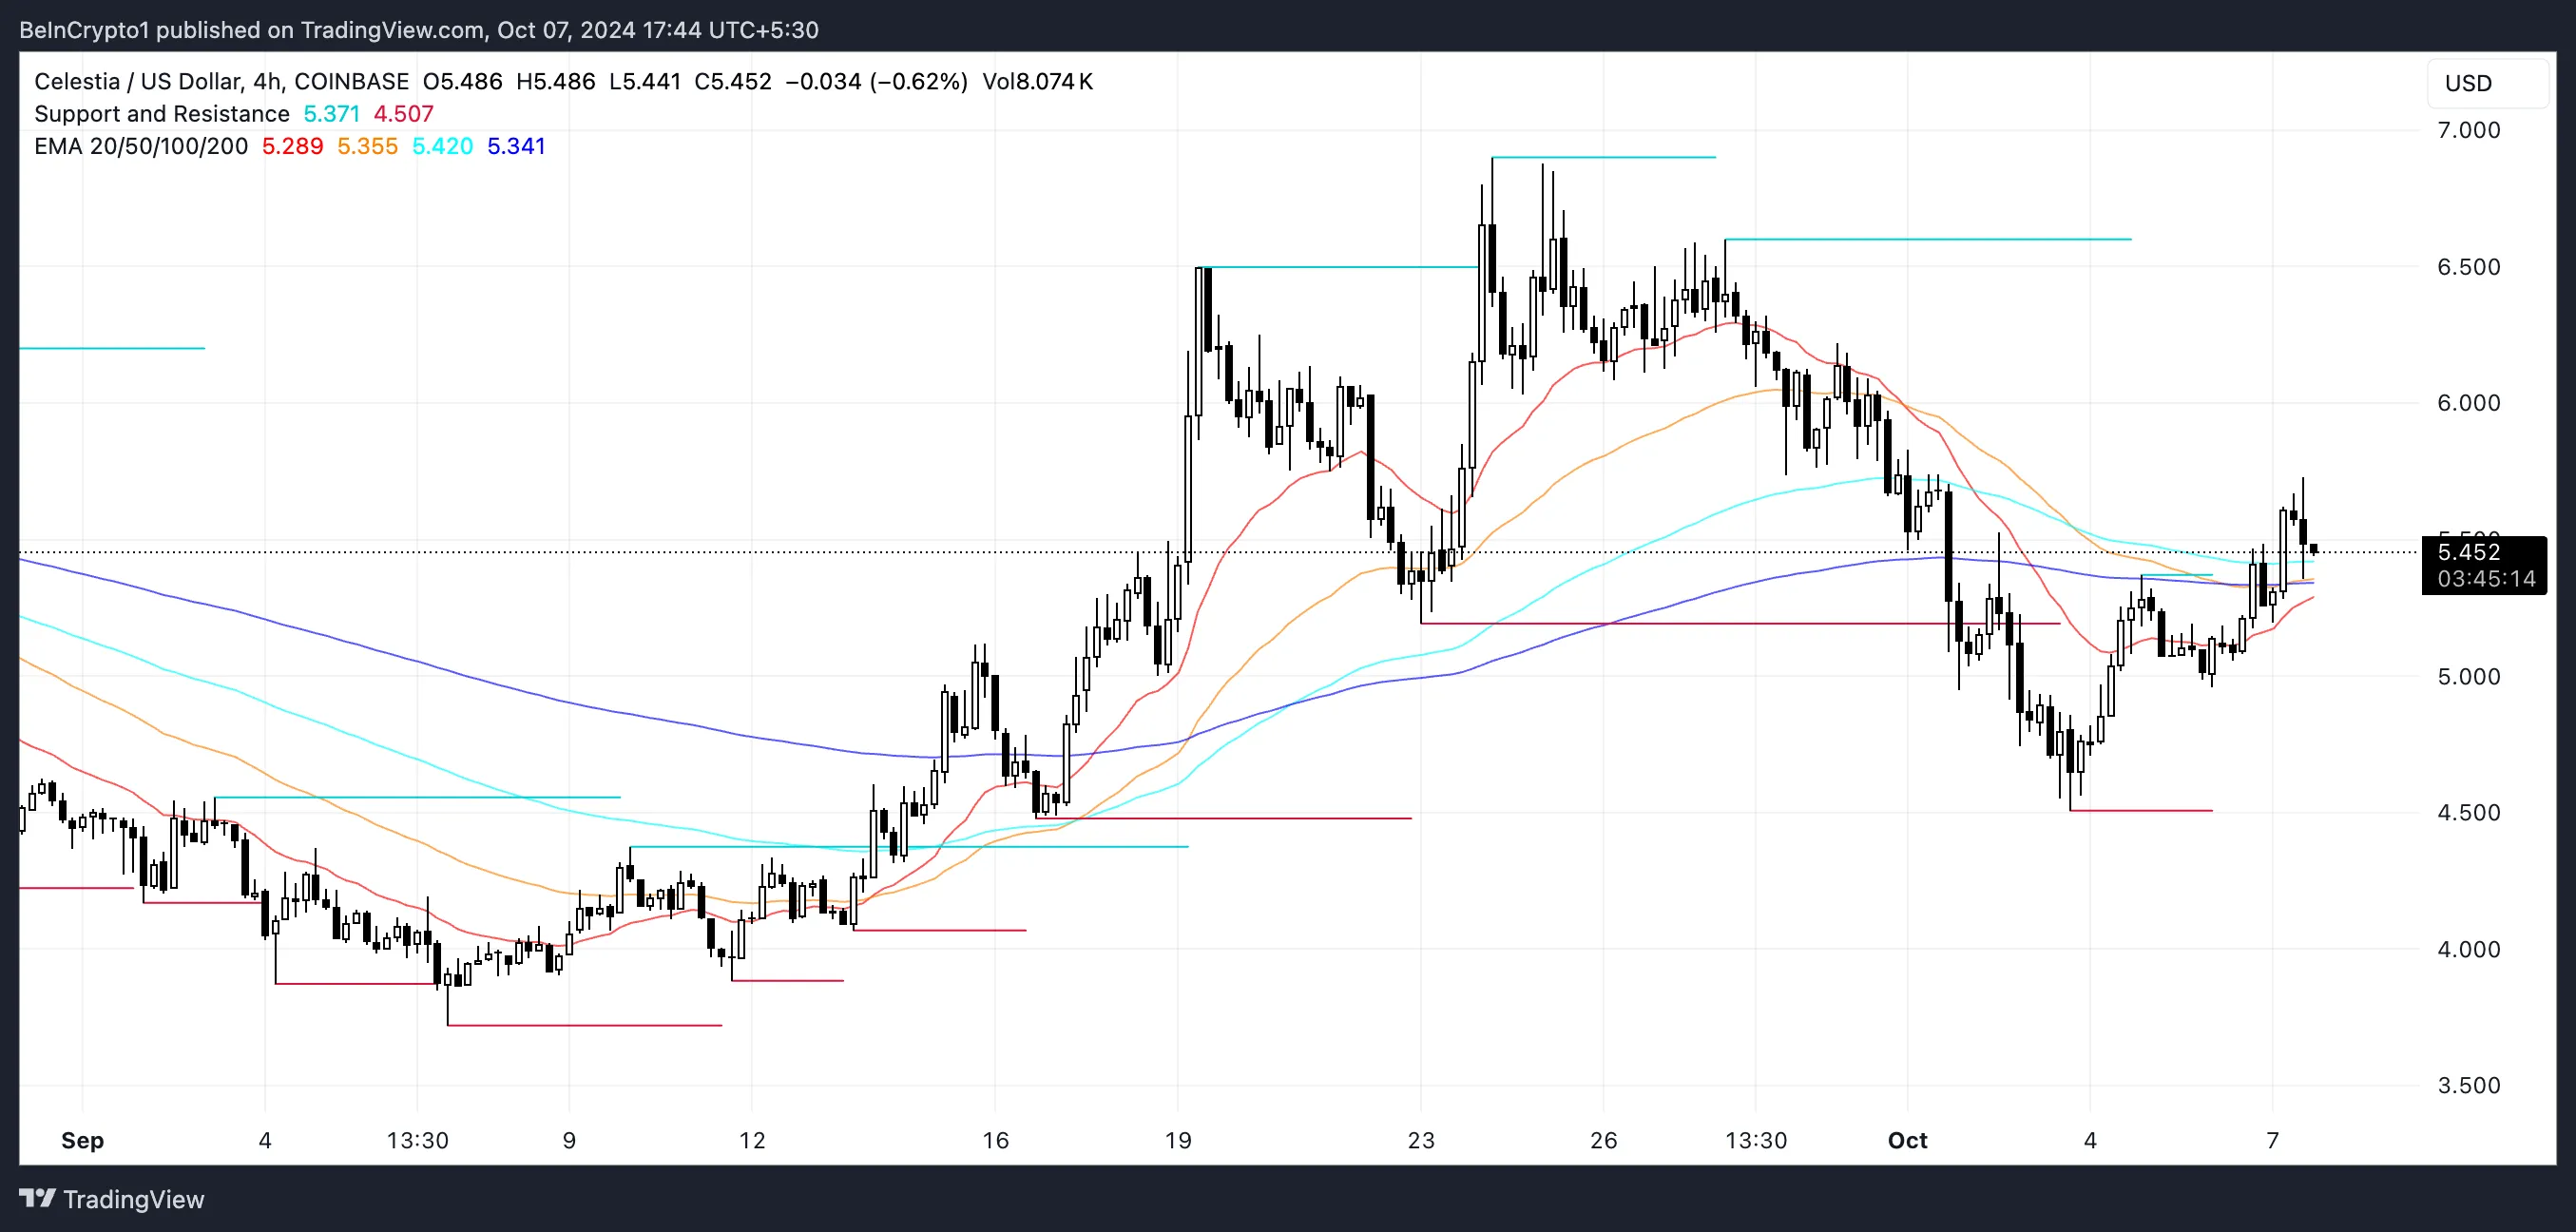
If TIA does indeed experience an uptrend following a golden cross, the next resistance levels to watch will be at $6.49 and $6.60. If those levels are broken, TIA could potentially rise even further to test $6.89, indicating a possible 26% growth from current levels.
Conversely, if the anticipated uptrend does not materialize and a downtrend occurs instead, TIA’s price could test $5.19 as a support level. Should this support fail to hold, the price could decline further to around $4.49, representing a potential 18% drop.
Disclaimer
In line with the Trust Project guidelines, this price analysis article is for informational purposes only and should not be considered financial or investment advice. BeInCrypto is committed to accurate, unbiased reporting, but market conditions are subject to change without notice. Always conduct your own research and consult with a professional before making any financial decisions. Please note that our Terms and Conditions, Privacy Policy, and Disclaimers have been updated.


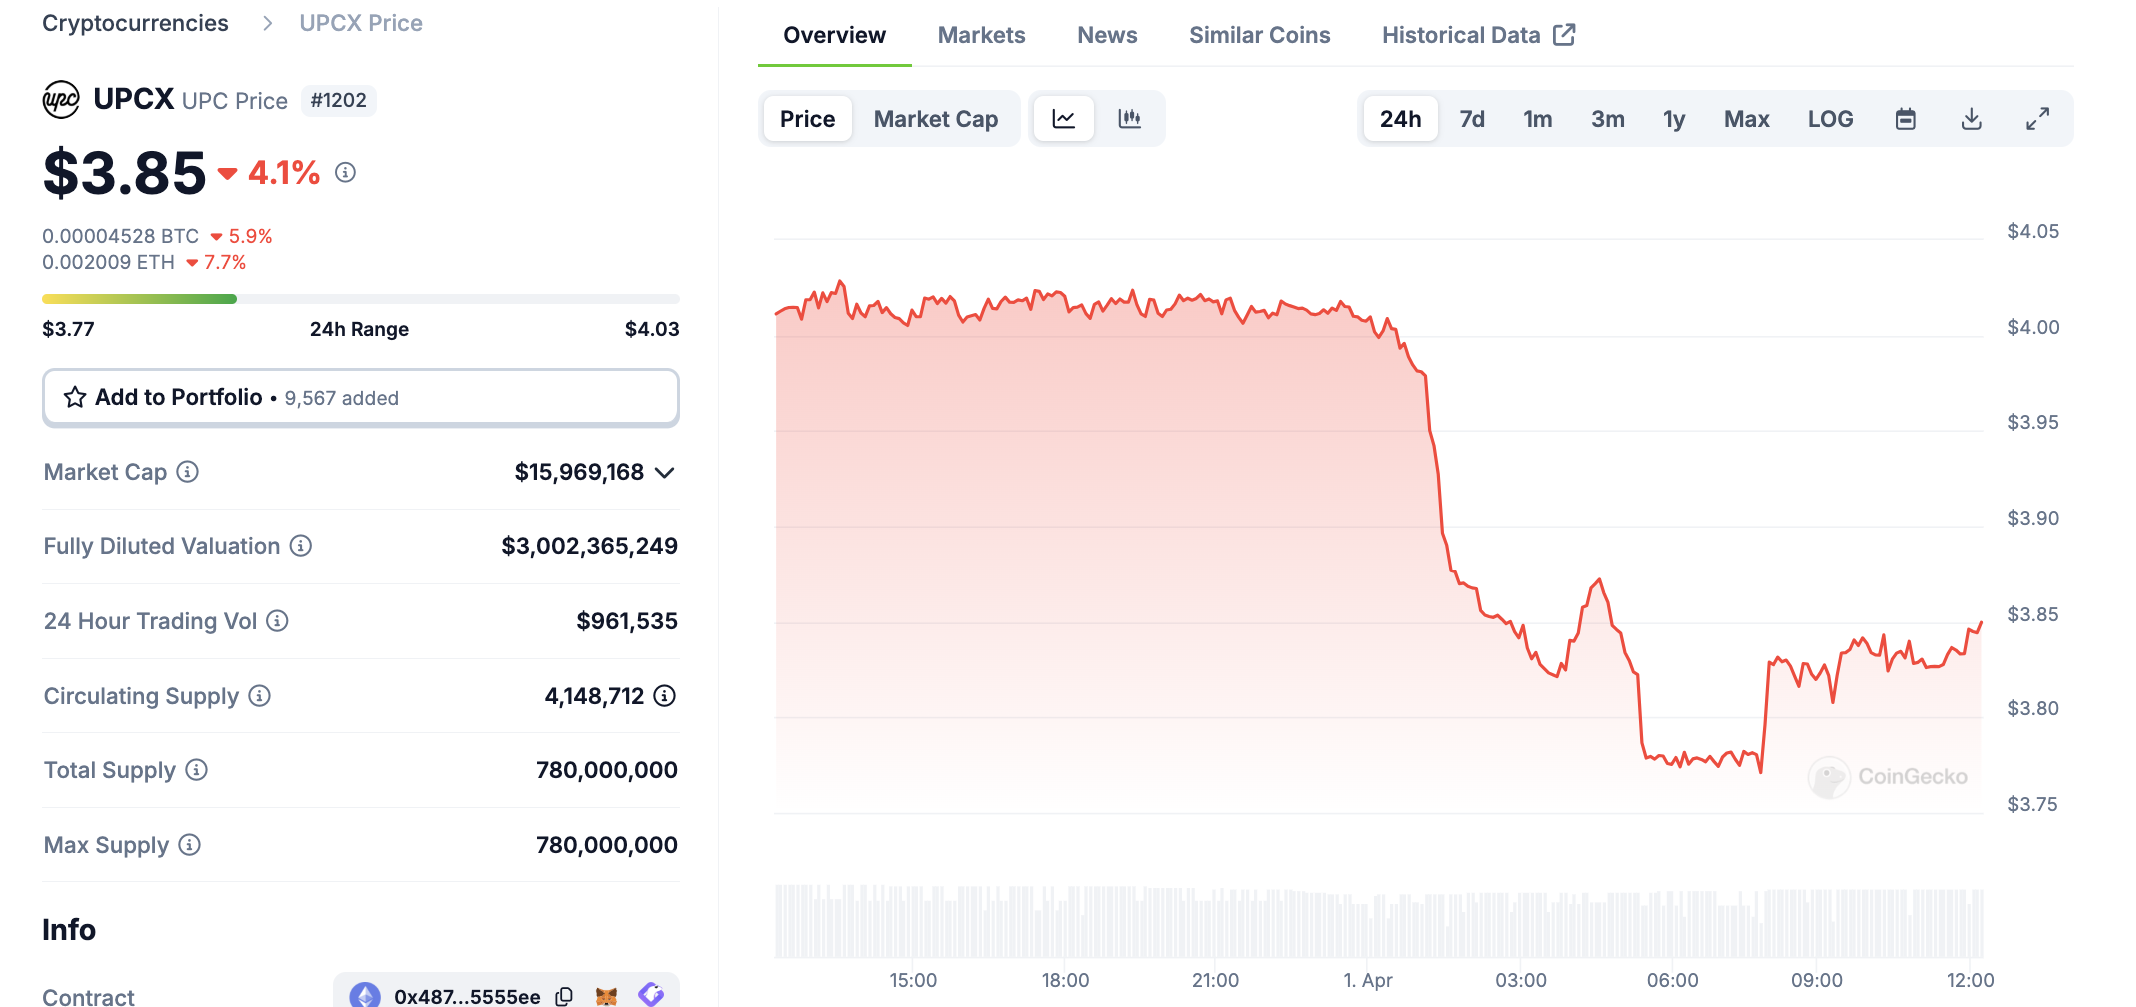
UPCX suffered a major hack today, with 18.4 million UPC tokens stolen from its management accounts. This amounts to about $70 million dollars, and the price of UPC fell drastically.
The hackers stole more UPC than is currently circulating in the markets and haven’t offloaded any assets yet. It is unclear who did this or how they will be able to secure their gains in other assets.
UPCX Suffers Major Hack
Cyvers, a crypto security firm that has tracked and uncovered several major crimes, identified a serious hack this morning. Multiple suspicious transactions took place involving UPCX’s management account, and the firm acknowledged suspicious activity. UPCX didn’t go into great detail, only describing a few security measures, but Cyvers showed the extent of the hack:
“It appears that someone gained access to the address 0x4C….3583E, upgraded the ‘ProxyAdmin’ contract, and executed the ‘withdrawByAdmin’ function, resulting in the transfer of 18.4 million UPC (approximately $70 million) from three different management accounts,” Cyvers claimed via social media.
UPCX is an open-source crypto payment system, and this hack may represent a serious blow to the company. According to CoinGecko data, the hackers stole significantly more UPC tokens than are currently available, which is around 4 million. Naturally, this caused the price to drop significantly, in an immediate drop of over 4%:
Although a $70 million hack will certainly damage UPCX individually, it’s unclear if it will actually impact the broader market much. The largest hack in crypto history took place a little over a month ago, and the community is still assessing the fallout. Meanwhile, UPCX is comparatively tiny; less than 10,000 X users viewed its post admitting to the security breach.
Since the UPCX hack took place, the recipient account hasn’t moved any of its UPC tokens. Indeed, it may be difficult for the perpetrator to convert these assets into usable fiat in the first place. If the hackers stole nearly 5x the amount of UPC tokens in circulation, any attempt to liquidate them will crash UPC’s token price even further.
Ultimately, the UPCX hack is strange for several reasons. Despite a large dollar amount, it hasn’t attracted a huge amount of buzz or impacted the market outside UPC. Hopefully, further analysis will identify the perpetrators, and possibly freeze the assets. Otherwise, the threat of a future sale could hamper UPC’s recover for the foreseeable future.
Disclaimer
In adherence to the Trust Project guidelines, BeInCrypto is committed to unbiased, transparent reporting. This news article aims to provide accurate, timely information. However, readers are advised to verify facts independently and consult with a professional before making any decisions based on this content. Please note that our Terms and Conditions, Privacy Policy, and Disclaimers have been updated.

Ethereum (ETH) enters the week with mixed signals as traders brace for tomorrow’s “Liberation Day” tariff announcement, a potential macro catalyst that could impact risk assets. While the BBTrend indicator remains deeply negative, it’s beginning to ease, hinting at a possible slowdown in bearish momentum.
On-chain data shows a slight uptick in whale accumulation, suggesting cautious optimism from large holders. Meanwhile, Ethereum’s EMA setup shows early signs of a trend reversal, but the price still needs to break key resistance levels to confirm a shift in direction.
ETH BBTrend Is Easing, But Still Very Negative
Ethereum’s BBTrend indicator is currently reading -11.66, slightly improved from -12.54 the day before, but still in negative territory for the second consecutive day.
The Bollinger Band Trend (BBTrend) measures the strength and direction of a trend based on how price interacts with the upper and lower Bollinger Bands.
A positive BBTrend suggests bullish momentum, with the price expanding toward the upper band, while a negative BBTrend indicates bearish momentum, with the price leaning toward the lower band. Typically, a value beyond 10 is considered a strong trend signal, making the current -11.66 reading a sign of continued downside pressure.
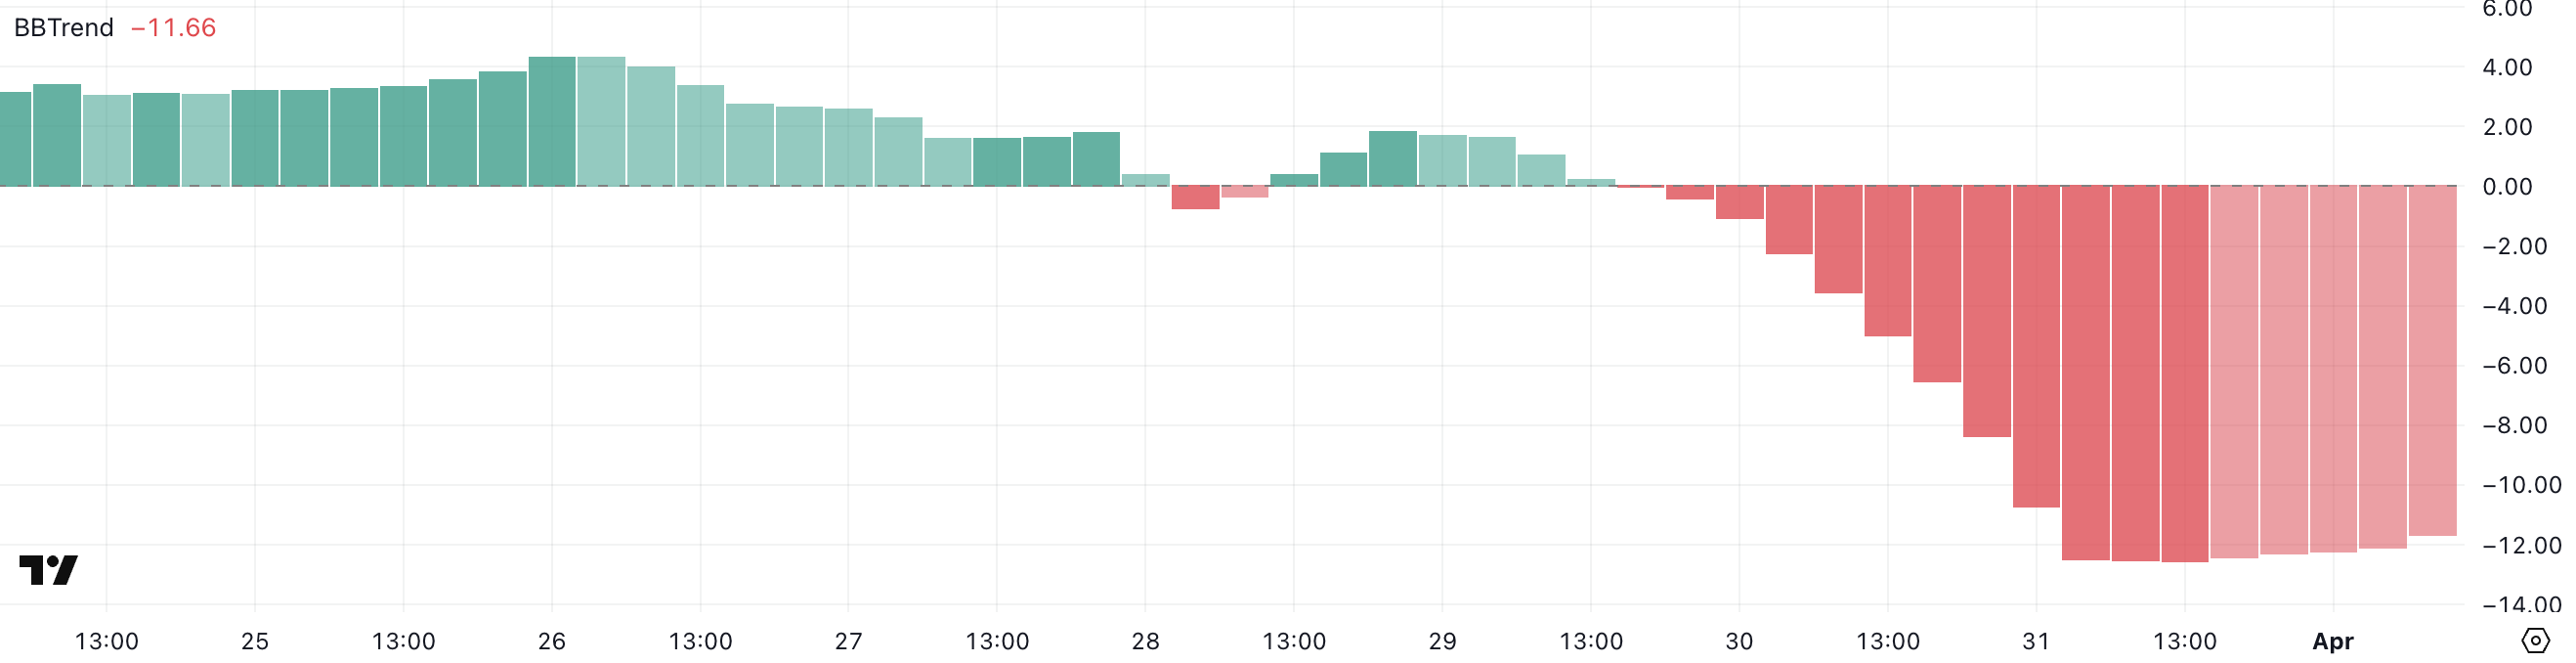
The persistent negative BBTrend suggests that Ethereum remains in a short-term bearish phase, with sellers still dominating the price action.
While yesterday’s slight uptick hints at a potential slowing of downward momentum, the indicator remains well below the neutral zone, meaning any reversal is still unconfirmed, despite Ethereum flipping Solana in DEX trading volume for the first time in 6 months.
Traders may interpret this as a warning to stay cautious, especially if ETH continues hugging the lower Bollinger Band. For now, price action remains fragile, and any bounce will need to be supported by a decisive shift in volume and sentiment to signal a meaningful reversal.
Ethereum Whales Are Accumulating Again
The number of Ethereum whales—wallets holding between 1,000 and 10,000 ETH—has ticked up slightly, rising from 5,322 to 5,330 in the past 24 hours.
While this is a modest increase, whale activity remains one of the most closely watched on-chain metrics, as these large holders often influence market direction. Whales’ accumulation can signal growing confidence in Ethereum’s medium—to long-term prospects, especially during periods of price uncertainty or consolidation.
Conversely, a decline in whale addresses typically suggests weakening conviction or profit-taking.
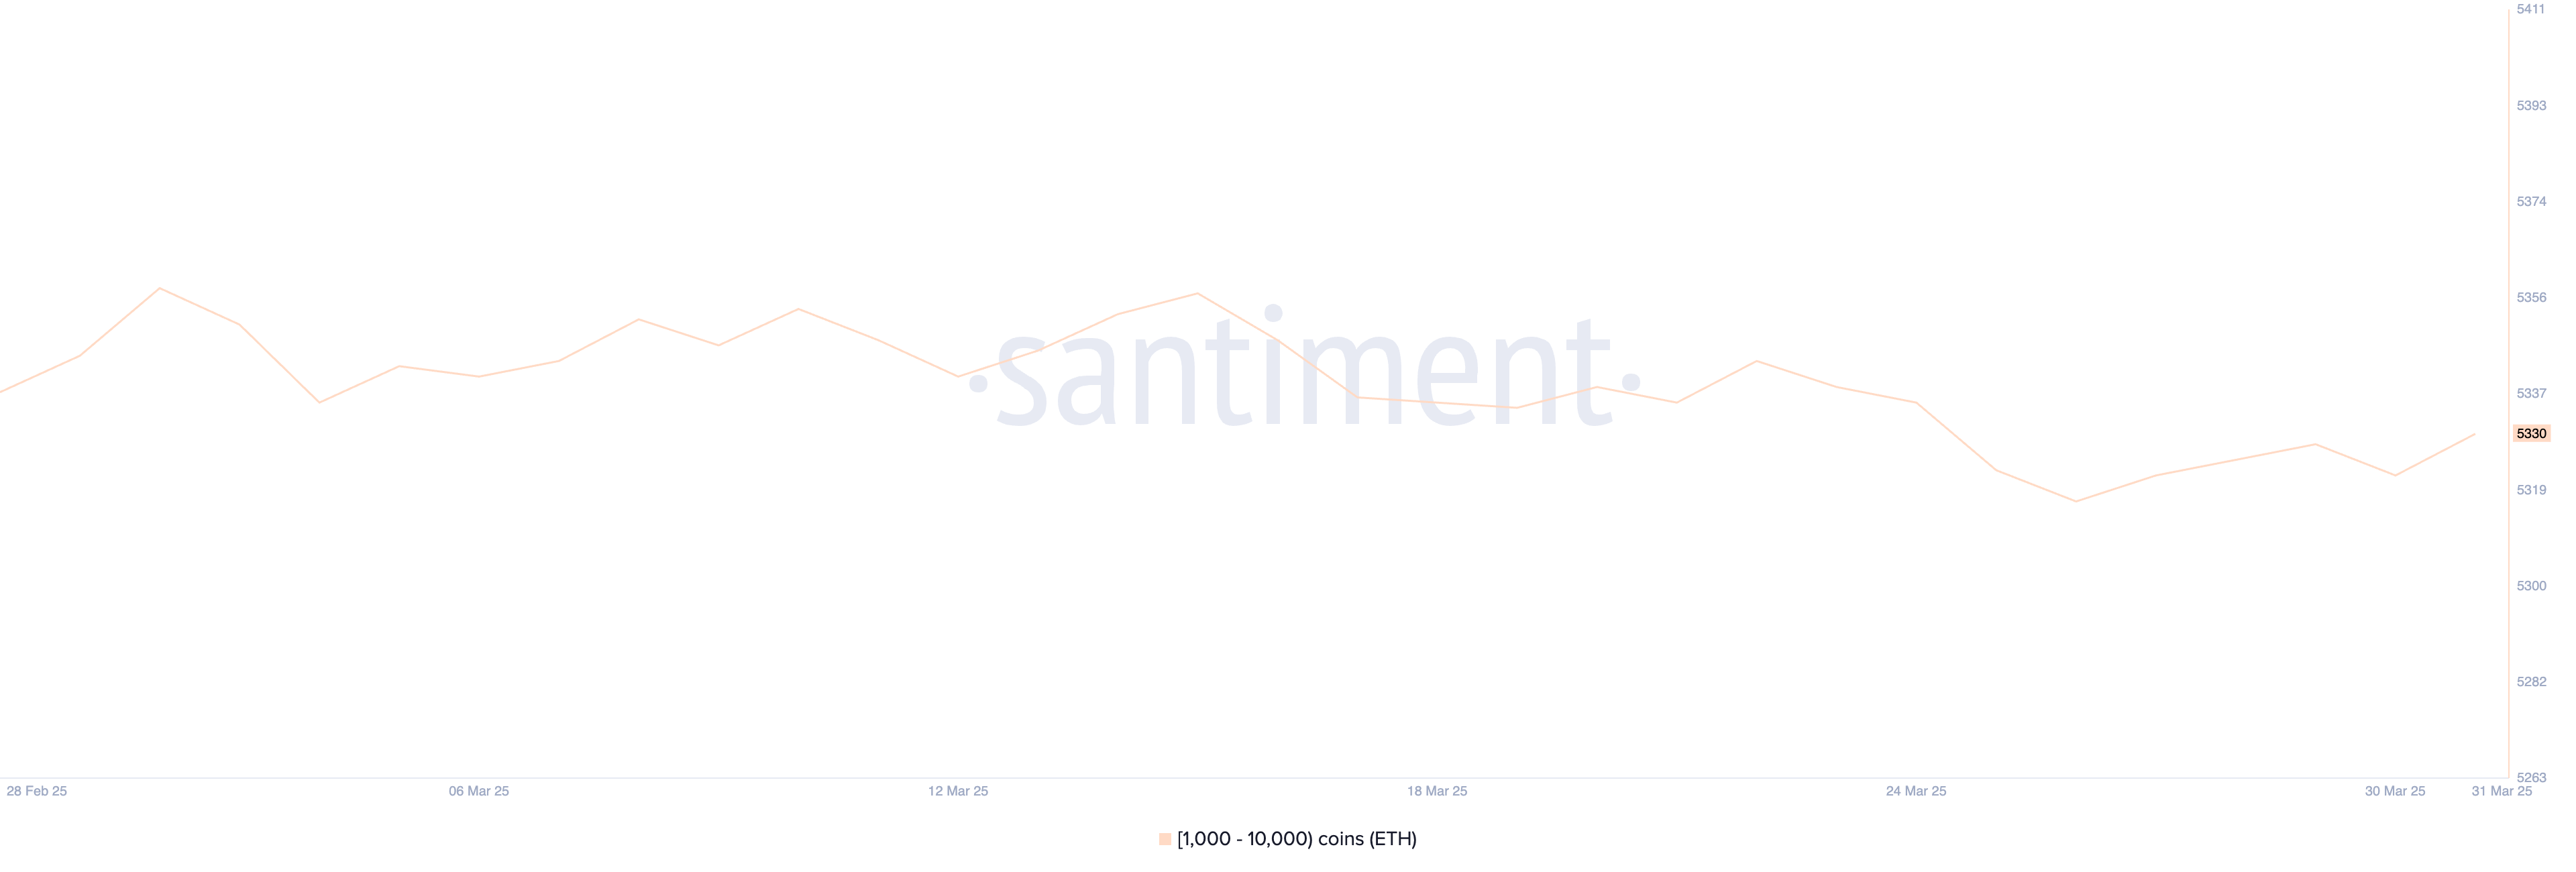
Although the recent uptick is a positive sign, it’s important to note that the current number of Ethereum whales is still below the levels observed in prior weeks.
This means that while some large holders may be re-entering the market, the broader whale cohort has yet to fully commit to an accumulation phase.
If the upward trend in whale numbers continues, it could support a bullish shift in sentiment and price. However, for now, the data points to cautious optimism rather than a decisive reversal.
Will Ethereum Break Above $2,100 Soon?
Ethereum’s EMA lines are showing early signs of a potential trend reversal, with price action attempting to break above key short-term averages.
If Ethereum price can push through the resistance at $1,938, it may signal the start of a broader recovery, potentially targeting the next resistance levels at $2,104, and if momentum builds—especially with supportive macro catalysts—increasing toward $2,320 and even $2,546.
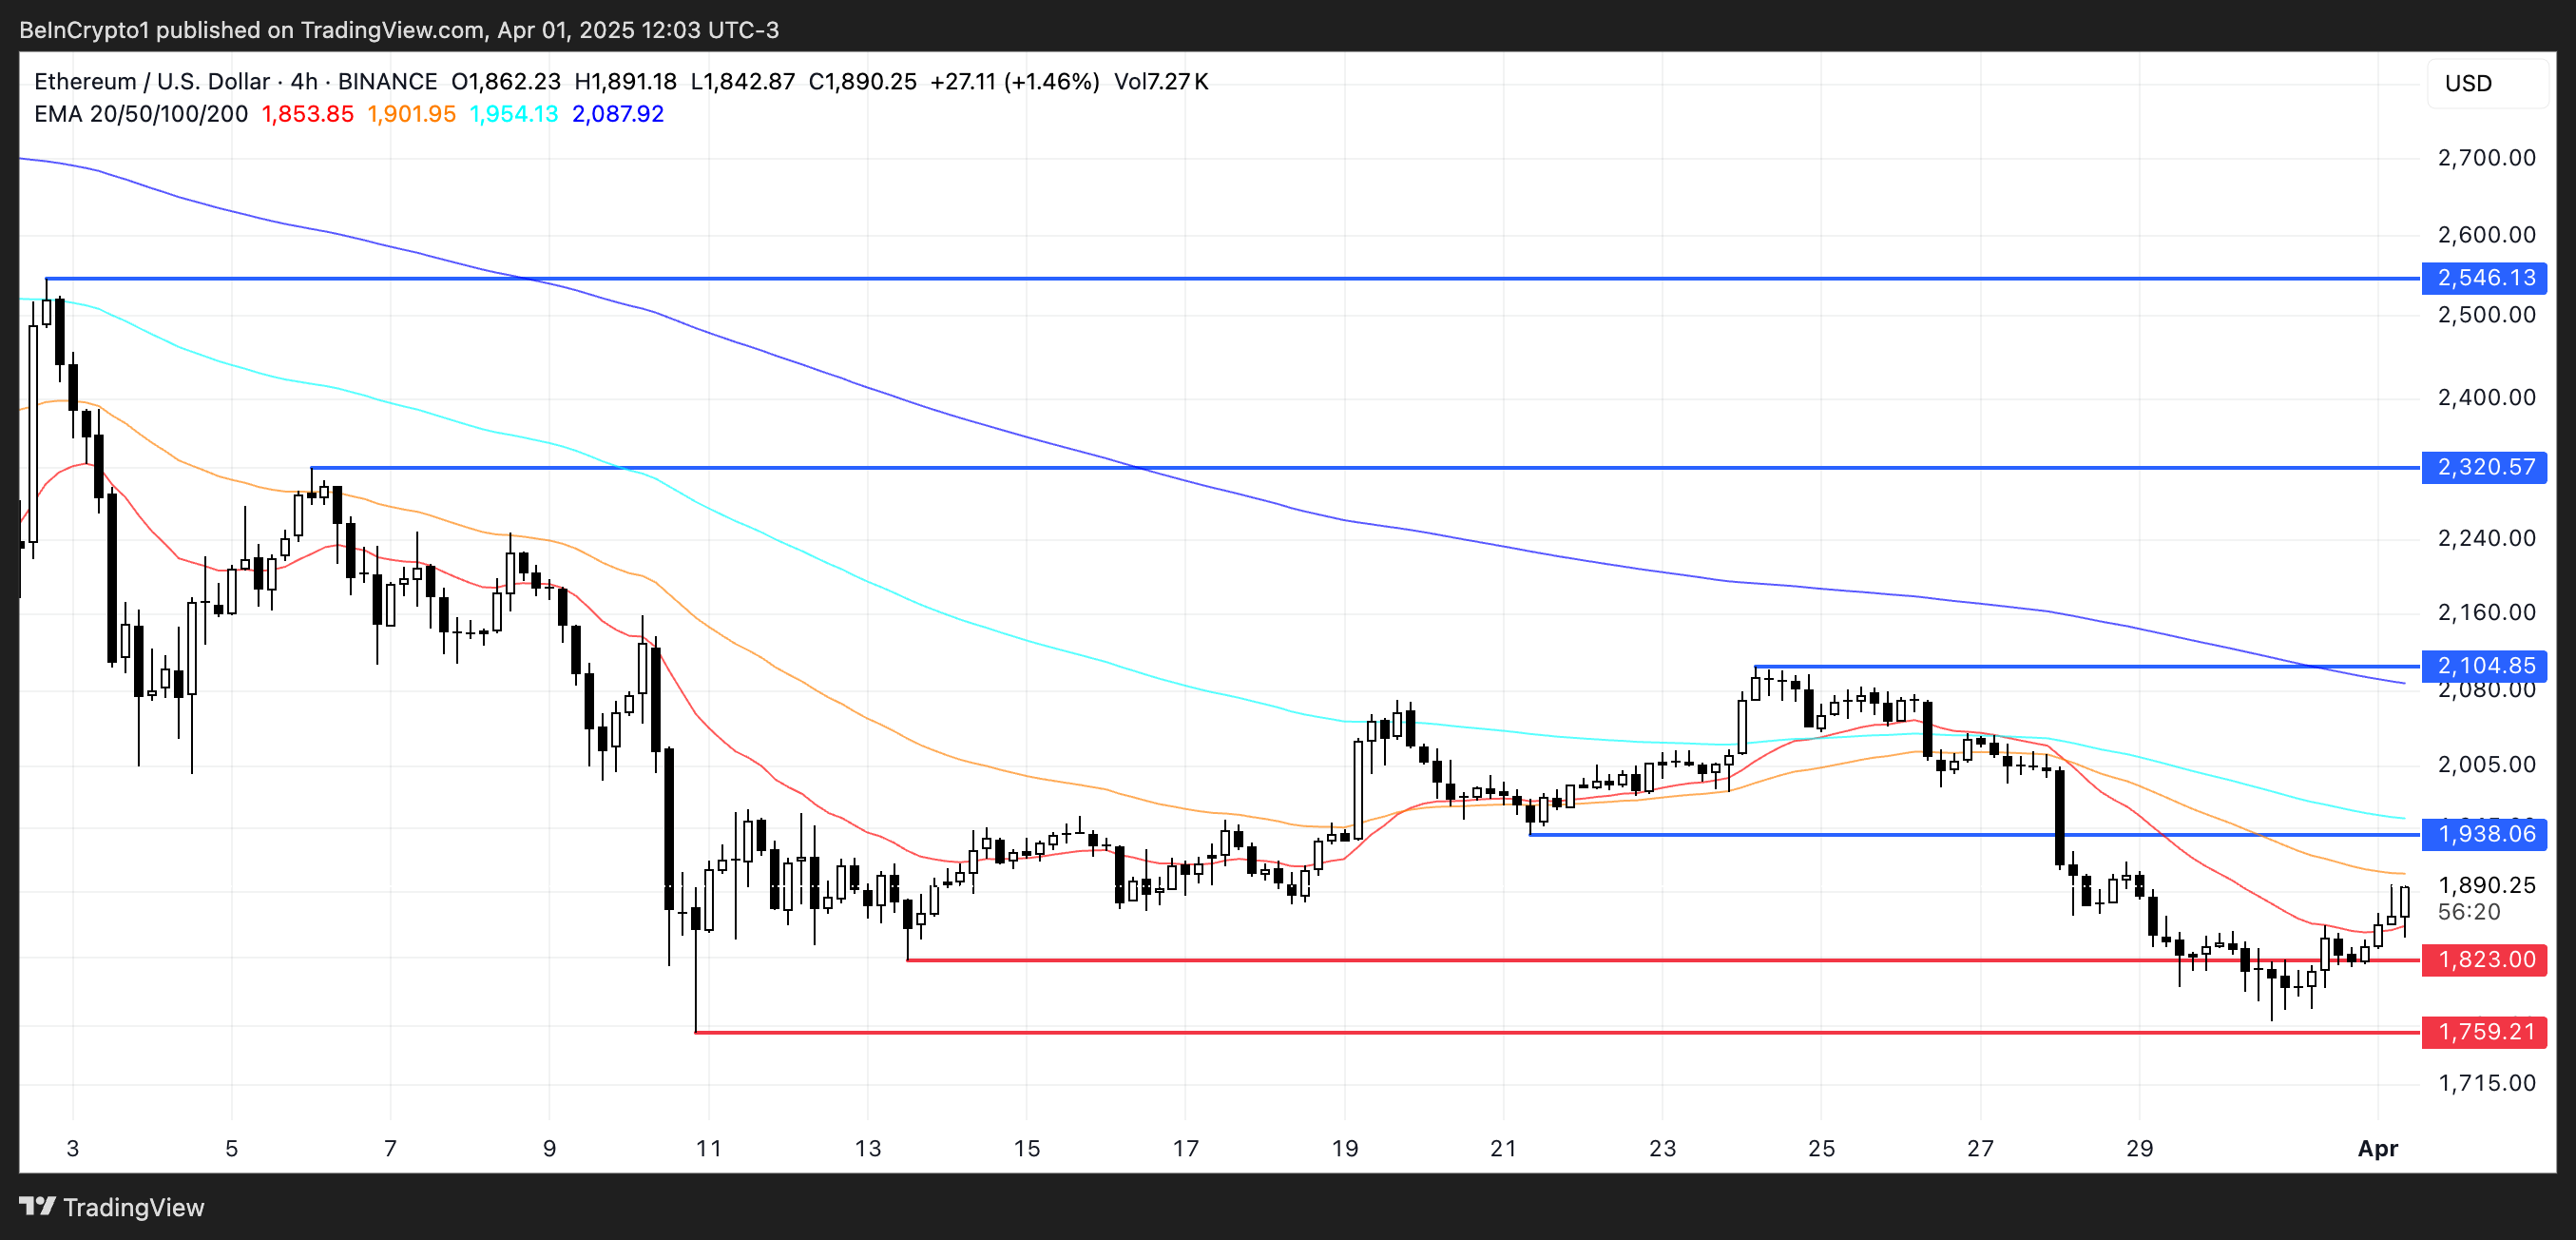
On the flip side, if Ethereum fails to maintain its upward push and bearish momentum resumes, the focus will shift back to downside levels.
The first key support sits at $1,823; a break below that could expose Ethereum to further losses toward $1,759.
Disclaimer
In line with the Trust Project guidelines, this price analysis article is for informational purposes only and should not be considered financial or investment advice. BeInCrypto is committed to accurate, unbiased reporting, but market conditions are subject to change without notice. Always conduct your own research and consult with a professional before making any financial decisions. Please note that our Terms and Conditions, Privacy Policy, and Disclaimers have been updated.

Binance Megadrop has announced its fourth project – KernelDAO (KERNEL), a restaking protocol supporting three key tokens Kernel, Kelp, and Gain.
Introduced in 2024, Binance Megadrop is a token launch platform that provides users with early access to promising crypto projects before their official listing.
KernelDAO and Binance Megadrop: Overview
KernelDAO is a restaking protocol that allows users to repurpose staked assets (such as ETH or BNB) to participate in other protocols, maximizing yield. The protocol launched its mainnet in December 2024.
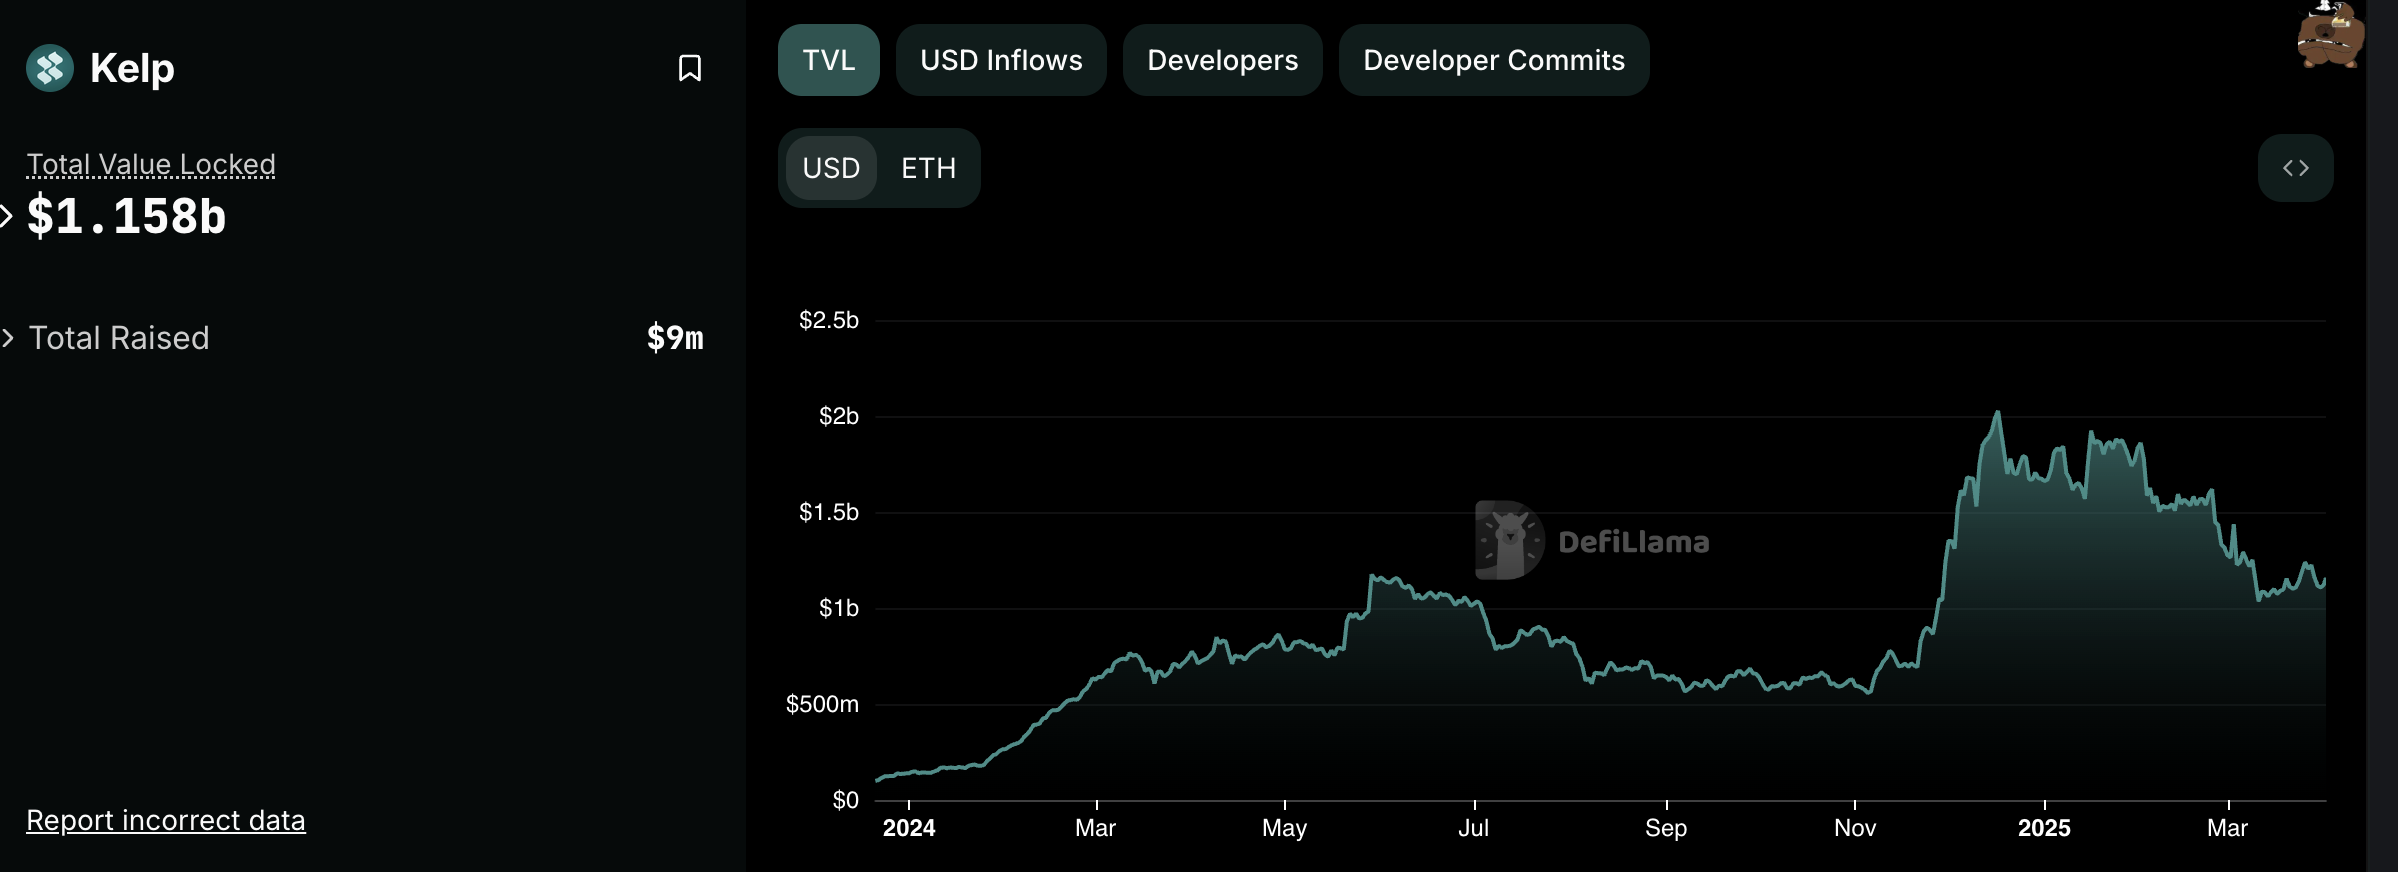
The KernelDAO Megadrop event kicks off on April 1, 2025, and lasts for 20 days, rewarding participants with KERNEL tokens. Kelp, a KernelDAO component, manages over $1.15 billion in Total Value Locked (TVL) across 10 blockchains, including Ethereum and BNB Chain.
KernelDAO has a maximum supply of 10 billion KERNEL tokens. Binance has allocated 40 million KERNEL (4% of the total supply) for participants. Upon listing on Binance, the initial circulating supply will be 162,317,496 KERNEL (16.23% of the total supply).
After the Megadrop event, KERNEL will be listed on Binance Spot with trading pairs such as KERNEL/BTC, KERNEL/USDT, and KERNEL/BNB.
KernelDAO is the fourth project on Binance Megadrop, following Lista (LISTA) and Xai (XAI). Previously, Binance Labs invested in Kernel to build recovery infrastructure on the BNB Chain.
Binance’s inclusion of KernelDAO could contribute to the growth of the restaking sector. According to DeFiLlama, the total TVL of restaking protocols surpassed $15 billion in early 2025, with EigenLayer and Kelp leading the market.
With 40 million KERNEL tokens distributed through Megadrop, many participants may sell immediately after receiving their tokens, potentially creating downward price pressure. Additionally, increasing competition from protocols like EigenLayer could pose challenges for KernelDAO.
Additionally, not all projects listed on Binance have performed impressively. In 2024, Binance-listed tokens all fell, with 29 out of 30 tokens posting significant losses.
Disclaimer
In adherence to the Trust Project guidelines, BeInCrypto is committed to unbiased, transparent reporting. This news article aims to provide accurate, timely information. However, readers are advised to verify facts independently and consult with a professional before making any decisions based on this content. Please note that our Terms and Conditions, Privacy Policy, and Disclaimers have been updated.

How Did UPCX Lose $70 Million in a UPC Hack?

Ethereum Struggles to Break Out as Bear Trend Fades

XRP Price to $27? Expert Predicts Exact Timeline for the Next Massive Surge

Binance Megadrop Launches KernelDAO
Wintermute Sells ACT Tokens Due To Binance Limit Changes

Ethereum Founder Buterin Funds Swiss Project With 274 ETH—What’s The Agenda?

2.52 Million Altcoins Are Ruining Crypto’s Future

Animoca Brands Valuation Tanks 75% In Two Years, Here’s Why

Crypto exchange BingX hacked for $43 million

Are The Big Players Losing Interest?

Hong Kong’s Securities Association Tips Authorities On Crypto Self-Regulation

Coinbase cbBTC Set to go Live on Solana
2.52 Million Altcoins Are Ruining Crypto’s Future
Animoca Brands Valuation Tanks 75% In Two Years, Here’s Why
Crypto exchange BingX hacked for $43 million
Are The Big Players Losing Interest?
Hong Kong’s Securities Association Tips Authorities On Crypto Self-Regulation
Coinbase cbBTC Set to go Live on Solana
-

 Ethereum23 hours ago
Ethereum May Have To Undo This Death Cross For Bull’s Return
-

 Market22 hours ago
BlackRock’s Larry Fink Thinks Crypto Could Harm The Dollar
-

 Market21 hours ago
Coinbase Tries to Resume Lawsuit Against the FDIC
-
 Altcoin21 hours ago
Charles Hoskinson Reveals How Cardano Will Boost Bitcoin’s Adoption
-

 Market20 hours ago
Hedera (HBAR) Bears Dominate, HBAR Eyes Key $0.15 Level
-

 Market23 hours ago
XRP Bears Lead, But Bulls Protect Key Price Zone
-

 Altcoin22 hours ago
Ethereum Bitcoin Ratio Drops to Record Low, What Next for ETH?
-

 Market19 hours ago
This is Why PumpSwap Brings Pump.fun To the Next Level