
Market
Cardano (ADA) Surges 8% as Bulls Push for Breakout

Cardano (ADA) is showing signs of life despite dropping 3% in the past 24 hours as traders weigh the possibility of a broader recovery. Technical indicators like BBTrend and DMI are flashing mixed signals, hinting that momentum may be fading after a brief surge.
ADA’s BBTrend has flipped into negative territory, while its DMI suggests bulls are gaining ground but haven’t fully taken control. With ADA hovering just above key support levels, the next few sessions will be crucial in determining whether this rally has legs or if another correction is around the corner.
ADA BBTrend Is Fading After Reaching Levels Above 5 Yesterday
Cardano’s BBTrend indicator has flipped into negative territory, currently sitting at -0.02 after reaching a positive peak of 5.28 just a day earlier.
This sharp reversal highlights a potential shift in market sentiment, suggesting that bullish momentum may be losing strength.
The abrupt drop adds to growing concerns among ADA holders, especially with the broader altcoin market showing signs of weakness.
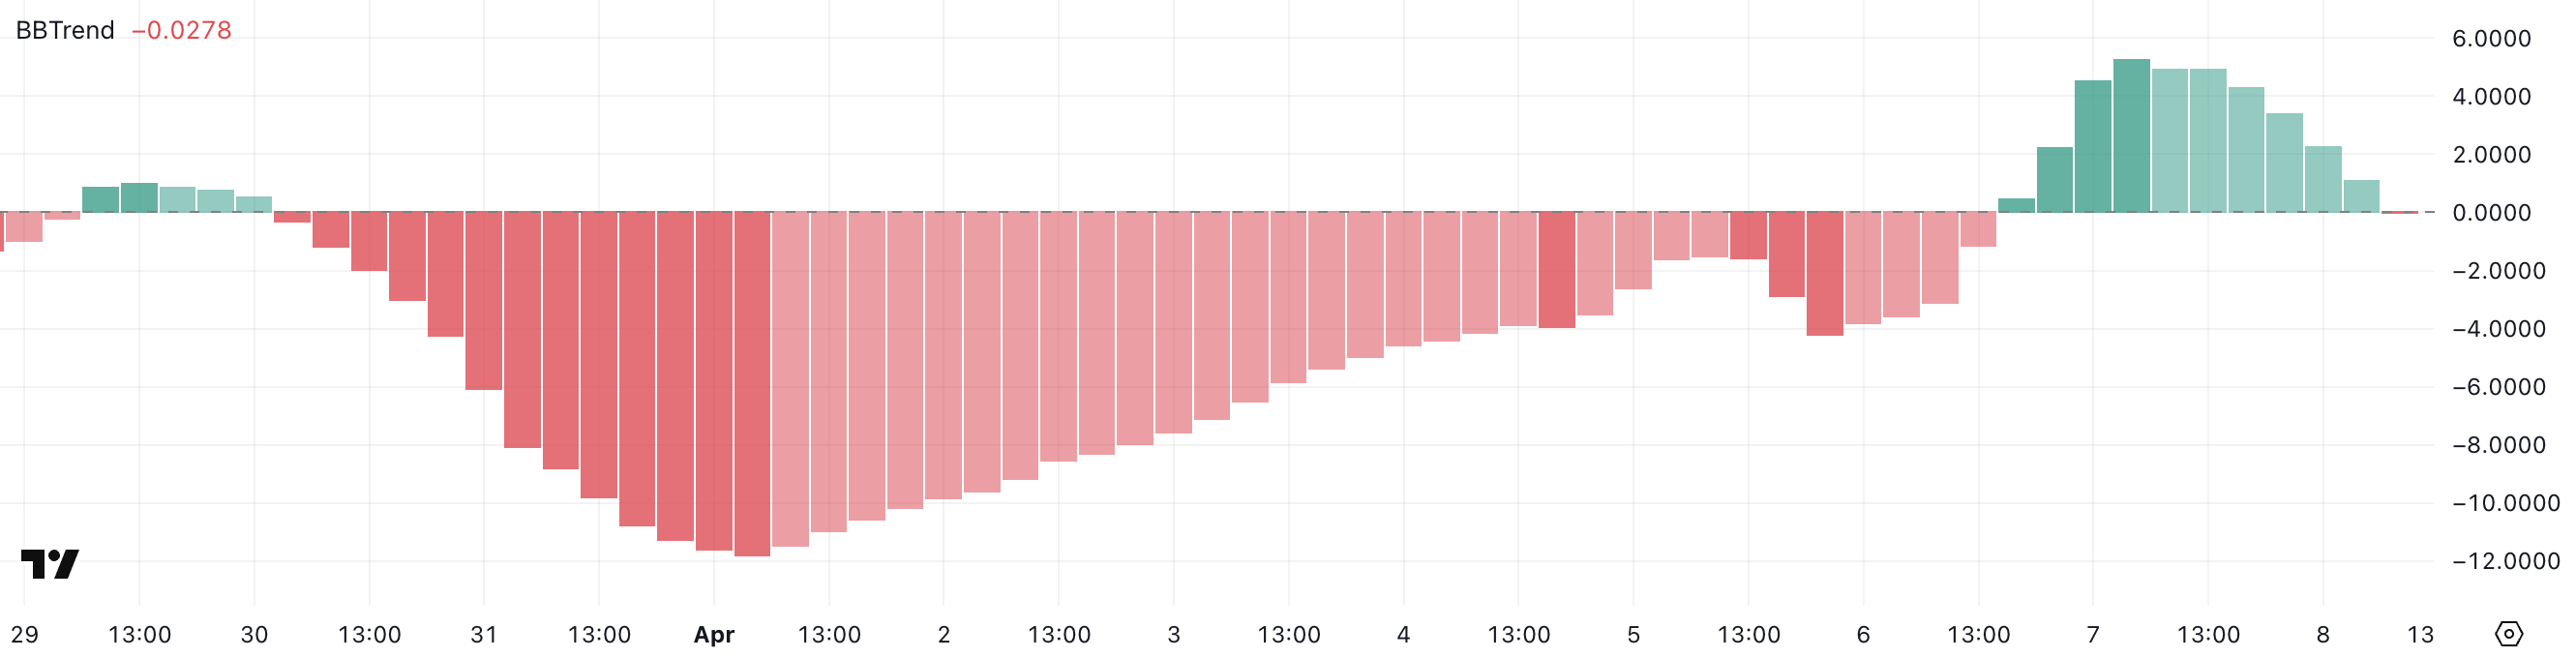
The BBTrend (Bull and Bear Trend) indicator measures the strength and direction of a price trend. Values above +1 typically indicate a strong bullish trend, while readings below -1 signal a strong bearish trend.
A value near zero, like the current -0.02, suggests indecision or a possible trend reversal.
For Cardano, this neutral-to-negative reading could mean that upward momentum is fading, increasing the risk of further downside if selling pressure builds in the coming sessions.
Cardano DMI Shows Buyers Are Almost Taking Control
Cardano’s DMI (Directional Movement Index) chart shows that its ADX, which measures trend strength, has dropped to 34.29 from 43.41 yesterday.
While this indicates that the current trend is weakening, the ADX is still well above the key 25 threshold, meaning the market remains in a strong directional move.
The shift suggests that although momentum is cooling, the currently bearish trend hasn’t lost control just yet.
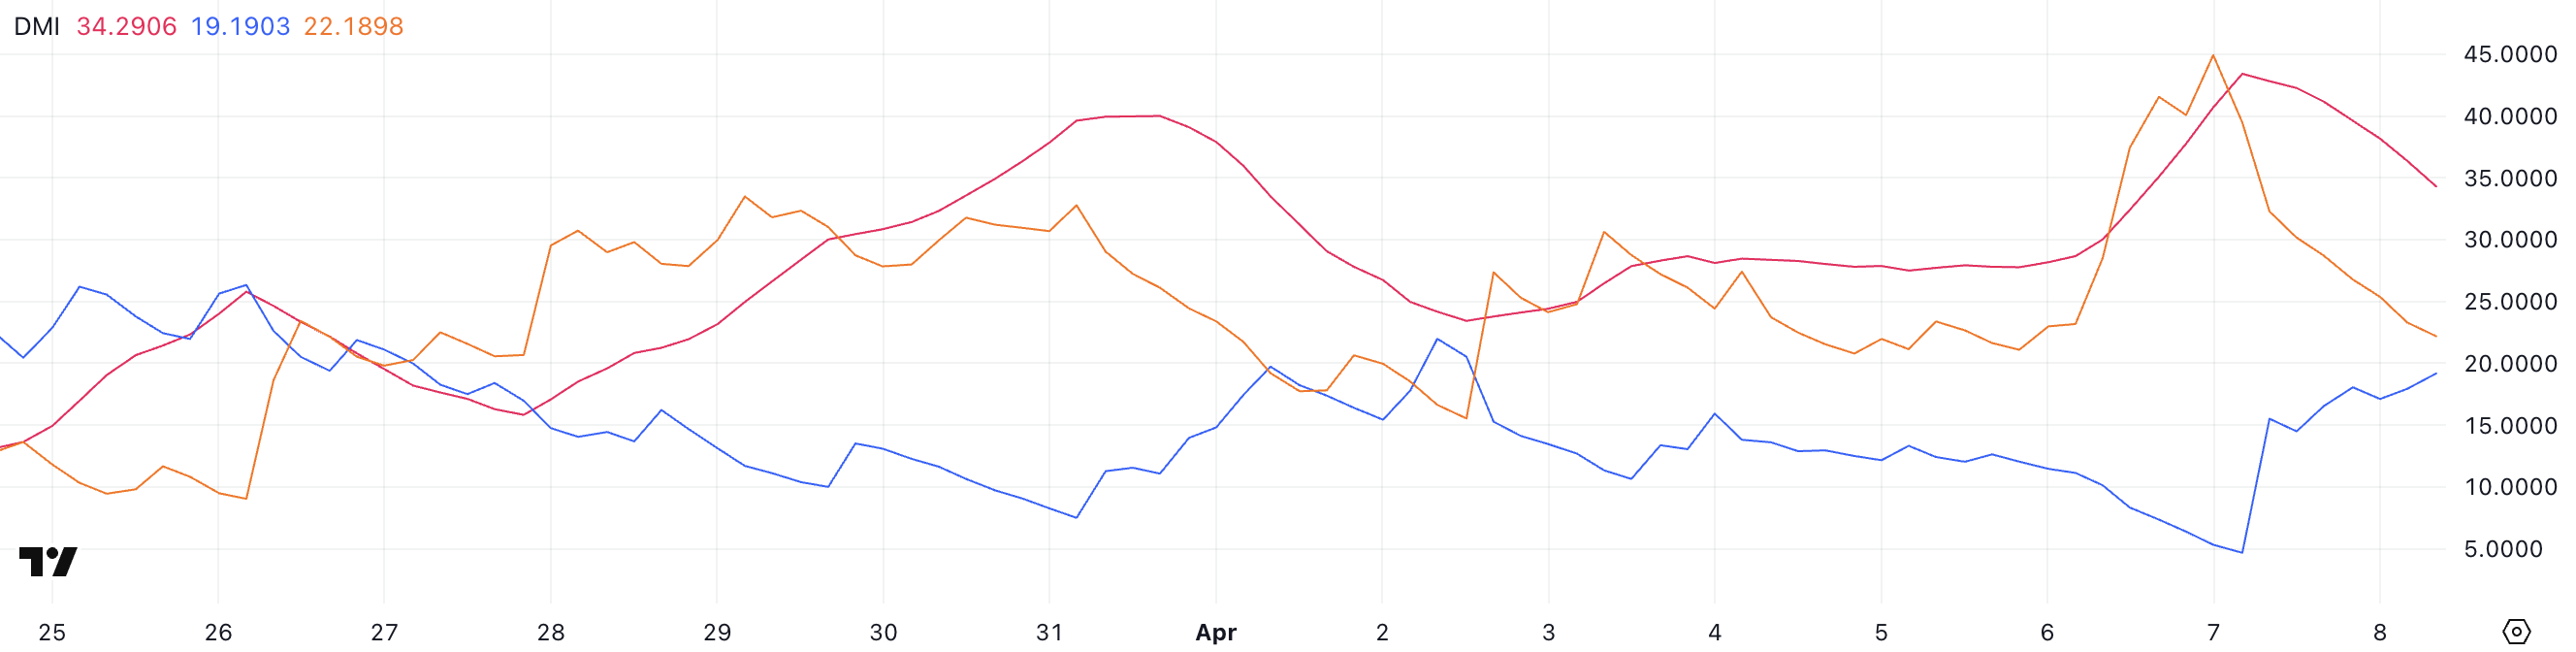
The ADX is part of the DMI system, which includes the +DI (positive directional index) and -DI (negative directional index).
The +DI has climbed from 4.68 to 19.19, showing growing bullish interest, while the -DI has sharply dropped from 44.92 to 22.18. This narrowing gap hints at a potential trend reversal or at least a slowing of bearish momentum.
However, since -DI is still slightly above +DI and ADX remains elevated, ADA is technically still in a downtrend — though bulls may be starting to regain some ground.
Is Cardano Getting Ready For A Recovery?
Cardano price is currently attempting a recovery after dipping below the $0.52 mark, a key support level in recent weeks. If buyers manage to confirm their strength and sustain upward momentum, ADA could first test resistance at $0.629.
A successful breakout above that could open the path toward $0.70, and if bullish pressure continues, a further rally to $0.77 may be on the table — levels not seen since early 2024.
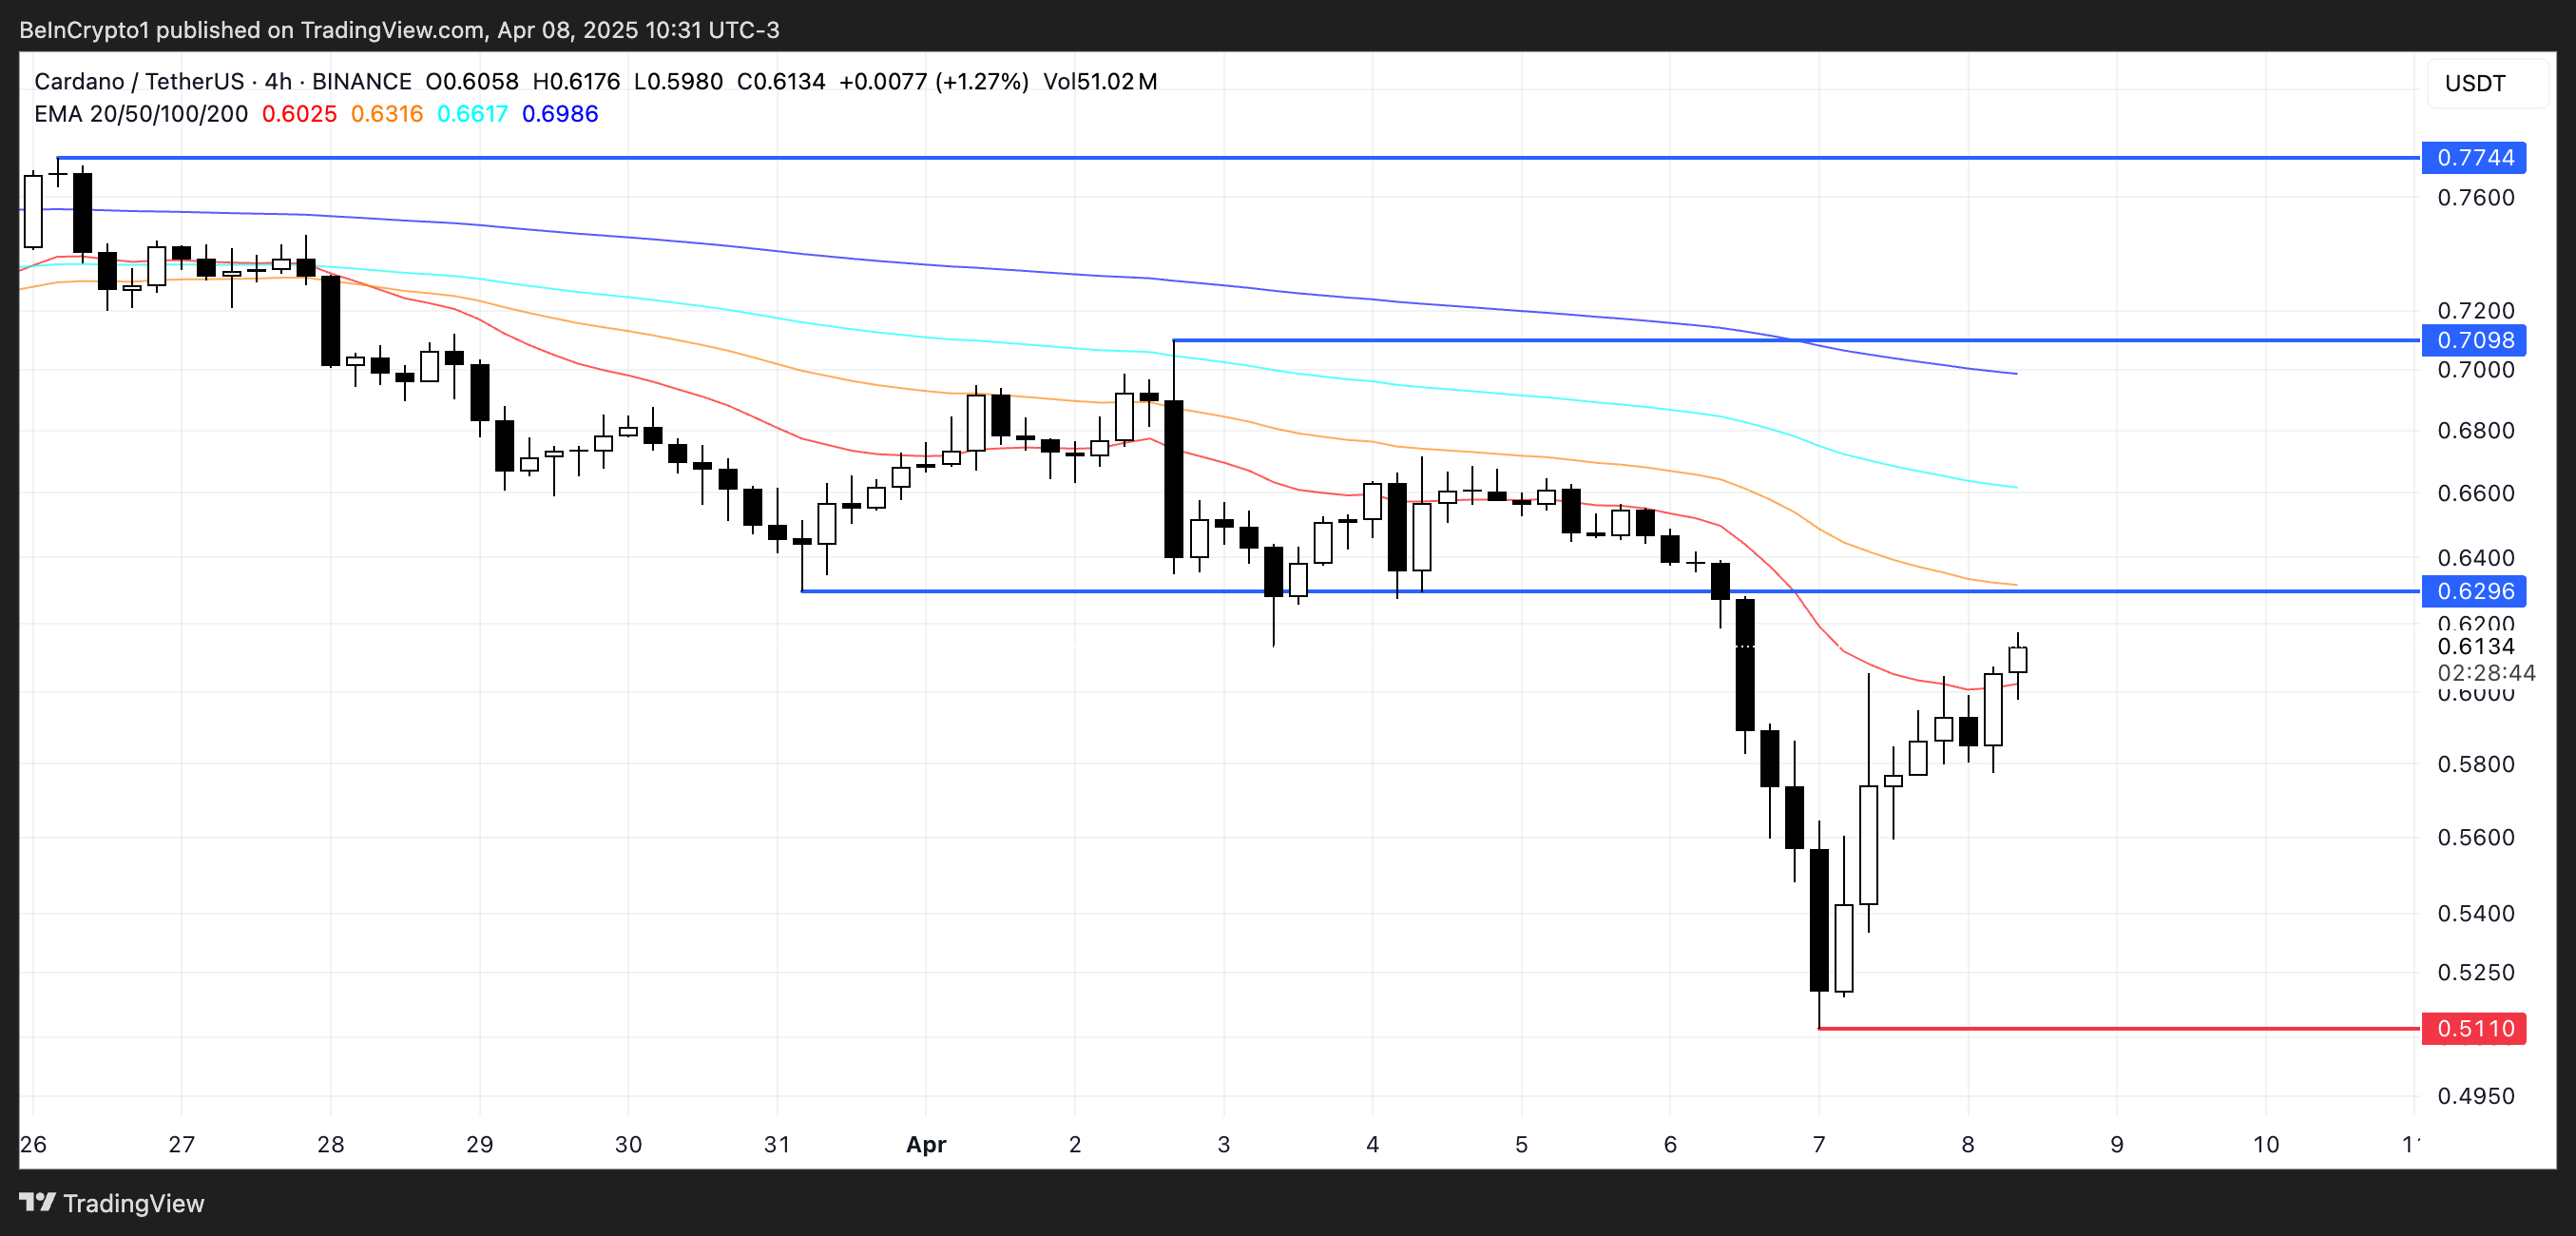
However, if ADA fails to hold its current ground and bearish momentum returns, the token risks sliding back below $0.52.
A move toward $0.51 would be the first critical test, and losing that level could push Cardano below the $0.50 threshold for the first time since November 2024.
Disclaimer
In line with the Trust Project guidelines, this price analysis article is for informational purposes only and should not be considered financial or investment advice. BeInCrypto is committed to accurate, unbiased reporting, but market conditions are subject to change without notice. Always conduct your own research and consult with a professional before making any financial decisions. Please note that our Terms and Conditions, Privacy Policy, and Disclaimers have been updated.


Reason to trust
![]()
Strict editorial policy that focuses on accuracy, relevance, and impartiality
Created by industry experts and meticulously reviewed
The highest standards in reporting and publishing
Strict editorial policy that focuses on accuracy, relevance, and impartiality
Morbi pretium leo et nisl aliquam mollis. Quisque arcu lorem, ultricies quis pellentesque nec, ullamcorper eu odio.
Bitcoin price started a fresh increase above the $83,500 zone. BTC is now consolidating gains and might attempt to clear the $85,500 resistance.
- Bitcoin started a fresh increase above the $83,500 zone.
- The price is trading above $83,000 and the 100 hourly Simple moving average.
- There is a connecting bullish trend line forming with support at $84,200 on the hourly chart of the BTC/USD pair (data feed from Kraken).
- The pair could start another increase if it clears the $85,500 zone.
Bitcoin Price Eyes More Gains
Bitcoin price started a fresh increase above the $82,500 zone. BTC formed a base and gained pace for a move above the $83,000 and $83,500 resistance levels.
The bulls pumped the price above the $84,500 resistance. A high was formed at $85,850 and the price recently started a downside correction. There was a move below the $84,000 support. The price dipped below the 23.6% Fib retracement level of the upward move from the $78,600 swing low to the $85,850 high.
However, the bulls were active near the $83,000 zone and the price recovered losses. Bitcoin price is now trading above $83,500 and the 100 hourly Simple moving average. There is also a connecting bullish trend line forming with support at $84,200 on the hourly chart of the BTC/USD pair.

On the upside, immediate resistance is near the $85,000 level. The first key resistance is near the $85,500 level. The next key resistance could be $86,200. A close above the $86,200 resistance might send the price further higher. In the stated case, the price could rise and test the $87,500 resistance level. Any more gains might send the price toward the $88,000 level.
Another Rejection In BTC?
If Bitcoin fails to rise above the $85,500 resistance zone, it could start another decline. Immediate support on the downside is near the $84,200 level and the trend line. The first major support is near the $83,200 level.
The next support is now near the $82,200 zone and the 50% Fib retracement level of the upward move from the $78,600 swing low to the $85,850 high. Any more losses might send the price toward the $81,500 support in the near term. The main support sits at $80,800.
Technical indicators:
Hourly MACD – The MACD is now gaining pace in the bullish zone.
Hourly RSI (Relative Strength Index) – The RSI for BTC/USD is now above the 50 level.
Major Support Levels – $84,200, followed by $83,500.
Major Resistance Levels – $85,500 and $85,850.


KiloEx, a newly launched perpetual trading platform backed by YZi Labs (formerly Binance Labs), has suffered a cross-chain exploit resulting in the theft of approximately $7 million.
The attack, which began on April 14, is ongoing and has impacted operations across BNB Smart Chain, Base, and Taiko networks.
Hackers Drain $7 Million from KiloEx Using Tornado Cash
Cyvers analysts report that the attacker used a Tornado Cash-funded address to execute a series of coordinated transactions. It exploited potential access control flaws in KiloEx’s price oracle system.
On-chain evidence shows rapid fund movements between multiple chains. This raises concerns over systemic vulnerabilities in multi-chain DeFi architecture.
KiloEx launched its Token Generation Event (TGE) on March 27 in partnership with Binance Wallet and PancakeSwap. It’s currently listed on Binance Alpha.
“Root cause was a potential price oracle access control vulnerability. The attacker is still actively exploiting the system, and USDC may be subject to blacklisting,” wrote Cyvers.
The project was incubated by YZi Labs, an investment and innovation division previously branded as Binance Labs.
The launch attracted significant attention due to its backing and integration with BNB Smart Chain.
Following the attack, KiloEx has suspended its platform and is collaborating with security partners to investigate the breach and track stolen funds.
The team has announced plans to launch a bounty program to encourage white hat assistance and recover user assets.
The incident has triggered sharp market reactions. The KILO token plummeted by 30%, with its market capitalization dropping from $11 million to $7.5 million within hours of the attack.
Security teams are actively monitoring the attacker’s wallet addresses. The situation remains fluid as remediation efforts continue and the vulnerability is further assessed.
Disclaimer
In adherence to the Trust Project guidelines, BeInCrypto is committed to unbiased, transparent reporting. This news article aims to provide accurate, timely information. However, readers are advised to verify facts independently and consult with a professional before making any decisions based on this content. Please note that our Terms and Conditions, Privacy Policy, and Disclaimers have been updated.

Yesterday, MANTRA (OM) suffered a staggering 90% crash, and it’s still spiraling down today. Most notably, OM charts and indicators seem as bad as the 2022 Terra LUNA collapse, if not worse.
OM’s RSI is hovering near extreme oversold levels, and indicators reflect there’s barely any buying activity. When LUNA collapsed, a large number of traders bought the crash for a short-term pump. But, even this seems unlikely for MANTRA, based on current charts.
OM RSI Reached Levels Below 10
After crashing more than 90% in a matter of hours, some traders may be eyeing MANTRA’s OM token as a potential “buy the crash” opportunity.
However, the Relative Strength Index (RSI) tells a different story—OM’s RSI plummeted from 45 to 4 during the collapse and has only slightly recovered to 10.85.
The RSI is a momentum indicator that measures the speed and magnitude of price changes on a scale from 0 to 100. Typically, values below 30 indicate oversold conditions, while levels above 70 suggest the asset is overbought.
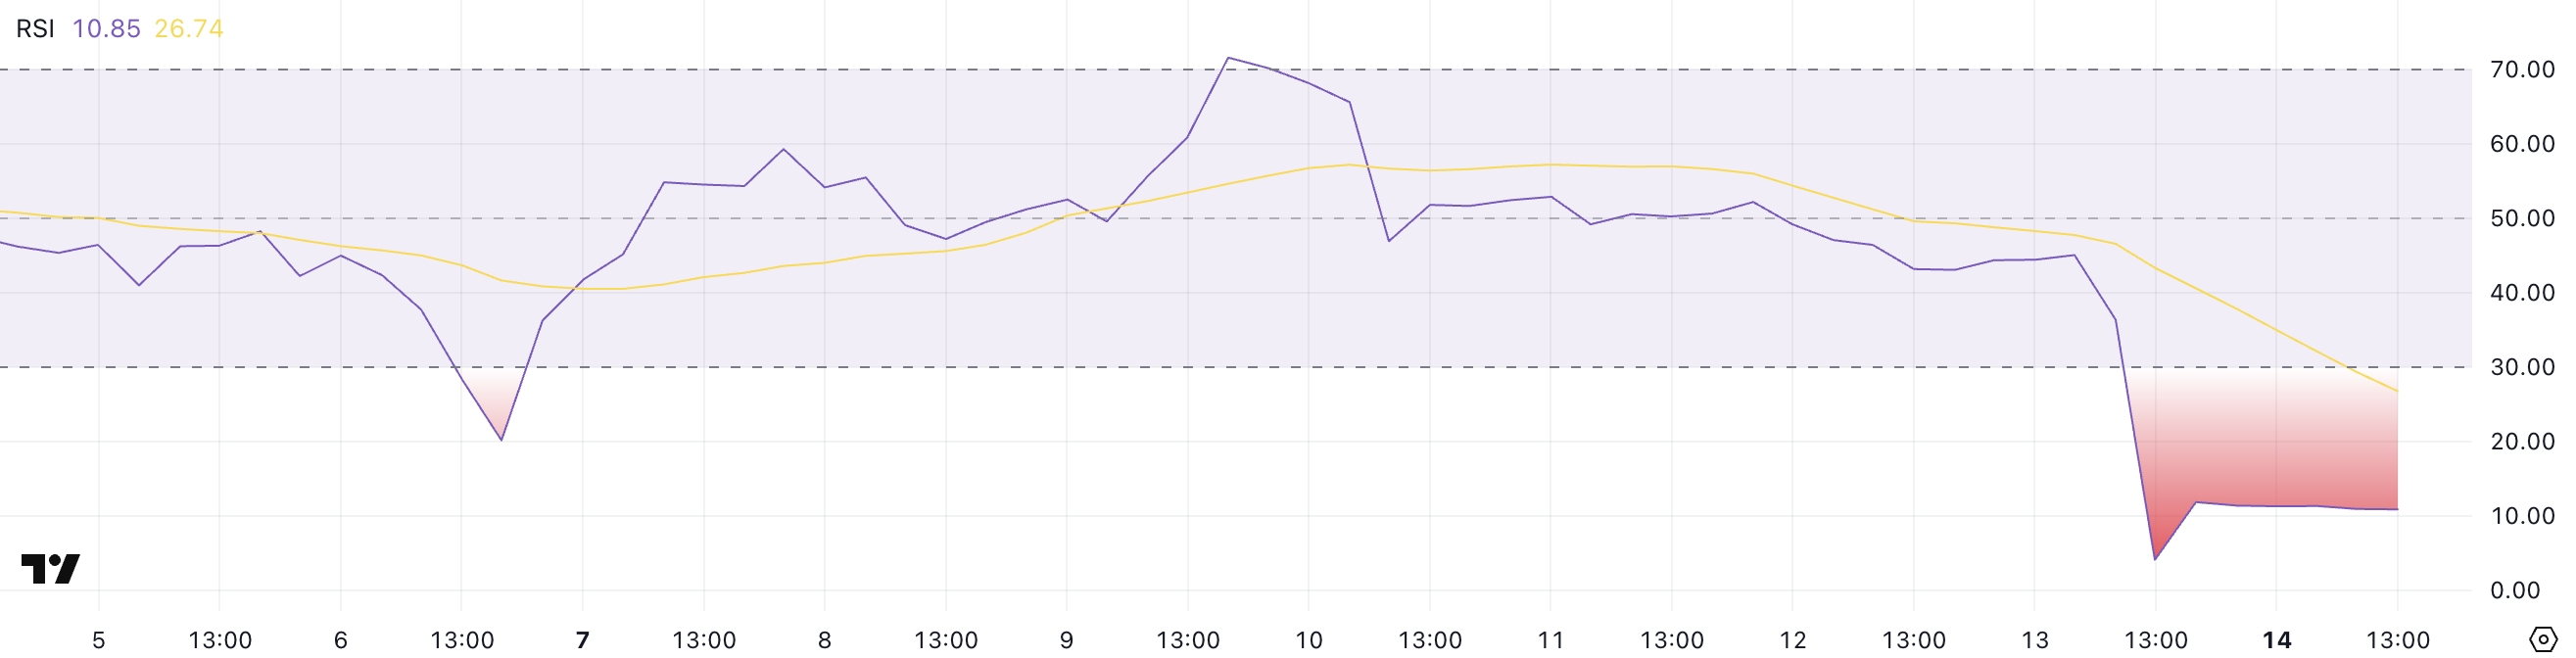
Despite bouncing from extreme lows, OM’s RSI has hovered around 10.85 for several hours, signaling that very few buyers are stepping in to support the price.
This lack of follow-through buying pressure shows that sentiment remains heavily bearish, and traders are not yet confident enough to accumulate the token—even at these steeply discounted levels.
Recently, talking to BeInCrypto, analysts warned about Mantra’s potential lack of true on-chain value.
OM is potentially setting up for further downside or a prolonged period of stagnation as the market waits for a catalyst or clearer recovery signals.
Mantra DMI Shows Buying Activity Is Almost Non-existent
Mantra’s DMI (Directional Movement Index) chart clearly shows intense bearish momentum. The ADX, which measures the strength of a trend regardless of direction, is currently at 47.23—well above the 25 threshold and showing no signs of weakening.
The -DI, which tracks selling pressure, has decreased from its peak of 85.29 to 69.69, indicating that while the panic sell-off may be slowing, it remains dominant.
Meanwhile, the +DI, which measures buying pressure, has dropped from 3.12 to just 2.42, highlighting a complete lack of bullish response to the collapse.

This imbalance reveals that although the worst of the immediate selling may be over, virtually no meaningful buying activity is stepping in to support OM’s price.
The fact that +DI remains extremely low suggests traders are still avoiding the token, hesitant to buy even after a massive discount.
As long as this dynamic continues—strong trend strength, high selling pressure, and near-zero buying pressure—OM is likely to stay under severe bearish pressure, with any recovery attempt extremely unlikely unless sentiment shifts dramatically.
Disclaimer
In line with the Trust Project guidelines, this price analysis article is for informational purposes only and should not be considered financial or investment advice. BeInCrypto is committed to accurate, unbiased reporting, but market conditions are subject to change without notice. Always conduct your own research and consult with a professional before making any financial decisions. Please note that our Terms and Conditions, Privacy Policy, and Disclaimers have been updated.

Expert Urges Pi Network To Learn From The OM Crash Ahead Of Open Mainnet Transition

Bitcoin Price Eyes Bullish Continuation—Is $90K Within Reach?

$7 Million Hack Hits Binance-Backed Project

MANTRA (OM) Charts Look Worse than LUNA – No Buying Activity

Is The XRP Price Mirroring Bitcoin’s Macro Action? Analyst Maps Out How It Could Get To $71
Ondo Finance (ONDO) Rises 3.5% Following MANTRA Crash

2.52 Million Altcoins Are Ruining Crypto’s Future

Animoca Brands Valuation Tanks 75% In Two Years, Here’s Why

Crypto exchange BingX hacked for $43 million

Are The Big Players Losing Interest?

Hong Kong’s Securities Association Tips Authorities On Crypto Self-Regulation

Coinbase cbBTC Set to go Live on Solana
2.52 Million Altcoins Are Ruining Crypto’s Future
Animoca Brands Valuation Tanks 75% In Two Years, Here’s Why
Crypto exchange BingX hacked for $43 million
Are The Big Players Losing Interest?
Hong Kong’s Securities Association Tips Authorities On Crypto Self-Regulation
Coinbase cbBTC Set to go Live on Solana
-

 Market18 hours ago
XRP Outflows Cross $300 Million In April, Why The Price Could Crash Further
-

 Market17 hours ago
FLR Token Hits Weekly High, Outperforms Major Coins
-
 Altcoin16 hours ago
XRP Price Climbs Again, Will XRP Still Face a Death Cross?
-

 Market21 hours ago
Bitcoin’s Price Under $85,000 Brings HODlers Profit To 2-Year Low
-

 Altcoin19 hours ago
Binance Breaks Silence Amid Mantra (OM) 90% Price Crash
-

 Bitcoin16 hours ago
Crypto Outflows Hit $795 Million On Trump’s Tariffs & Market Fear
-

 Market16 hours ago
Auto.fun Launchpad Set to Debut Amid Fierce Market Rivalry
-
 Altcoin15 hours ago
Analyst Predicts Dogecoin Price Rally To $0.29 If This Level Holds