Market
Cardano (ADA) Rises to a Seven-Day High

Last week’s rally in the altcoin market has led to a spike in Cardano’s (ADA) value. Exchanging hands at $0.40 at press time, the price of the tenth cryptocurrency by market capitalization has risen by 22% in the past seven days.
At its current value, the altcoin sits at its highest price level during the period in review.
Cardano’s Price Rally Puts Daily Traders in Profit
Cardano’s (ADA) double-digit price rally over the past week has put a number of its holders in profit. BeinCrypto assessed the daily ratio of ADA’s on-chain transaction volume in profit to loss using a seven-day moving average, and it returned a value of 1.05.

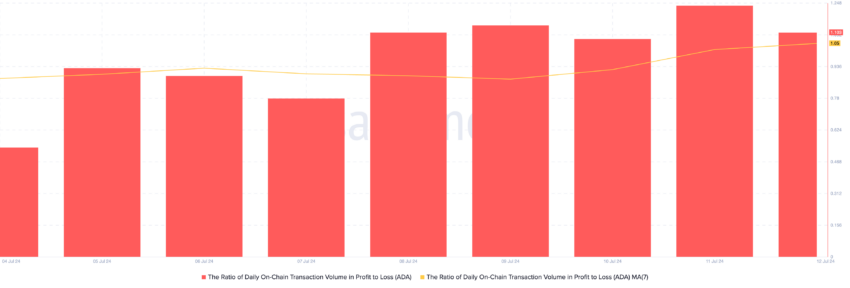
This metric measures the proportion of an asset’s profitable versus unprofitable daily transaction volume. A ratio greater than 1 indicates that more volume was transacted at a profit than at a loss, suggesting a generally positive market sentiment. Conversely, when the metric’s value is below zero, it indicates that more volume was transacted at a loss than at a profit.
ADA’s ratio of 1.05 indicates that over the past week, for every transaction resulting in a loss, an average of 1.05 transactions yielded a profit. This means there have been more profitable transactions than those resulting in losses.
Further, ADA’s rising Relative Strength Index (RSI) suggests that the price hike is backed by an actual demand for the coin. The metric is in an uptrend at press time and rests at 53.66.
Read More: How To Buy Cardano (ADA) and Everything You Need To Know
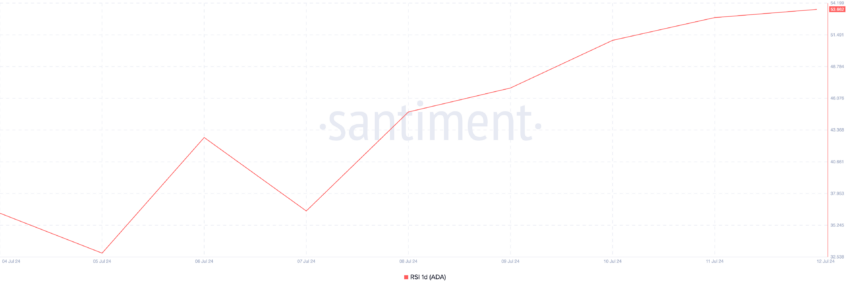
The RSI measures an asset’s overbought and oversold market conditions. It ranges between 0 and 100, with values above 70 suggesting that the asset is overbought and due for a decline, while values under 30 suggest that the asset is oversold and may witness a rebound.
At 53.66, ADA’s RSI signals that buying pressure is climbing and is beginning to outpace selling activity.
ADA Price Prediction: Coin Gears For More
ADA’s 22% price hike in the last week has pushed its price above its 20-day exponential moving average (EMA). This measures an asset’s average price over the past 20 trading days. When price trades above this key moving average, it signals an uptick in buying pressure.
ADA is currently trending toward its 50-day small moving average (SMA), which is a bullish signal. If ADA successfully crosses above it, it will signal that its recent average price is higher than its longer-term average, confirming the possibility of a further rally in the coin’s price.
If this happens, ADA will trade above $0.41.
Read More: Cardano (ADA) Price Prediction 2024/2025/2030

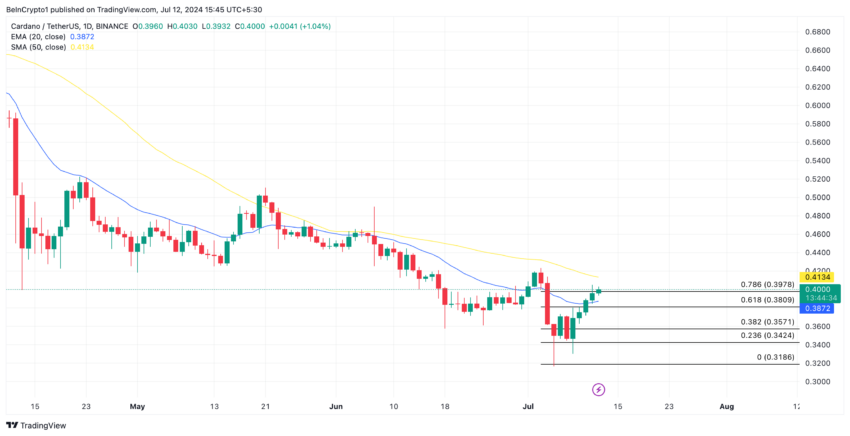
However, if a decline occurs, the coin’s price will drop to $0.38.
Disclaimer
In line with the Trust Project guidelines, this price analysis article is for informational purposes only and should not be considered financial or investment advice. BeInCrypto is committed to accurate, unbiased reporting, but market conditions are subject to change without notice. Always conduct your own research and consult with a professional before making any financial decisions. Please note that our Terms and Conditions, Privacy Policy, and Disclaimers have been updated.