
Market
Cardano (ADA) Faces Fresh Decline: Key Drivers Behind The Downtrend
Cardano price failed to surpass $0.40 and started another decline. ADA is now trading below $0.3850 and might extend losses in the near term.
- ADA price started a fresh decline and traded below $0.3880.
- The price is trading below $0.3850 and the 100-hourly simple moving average.
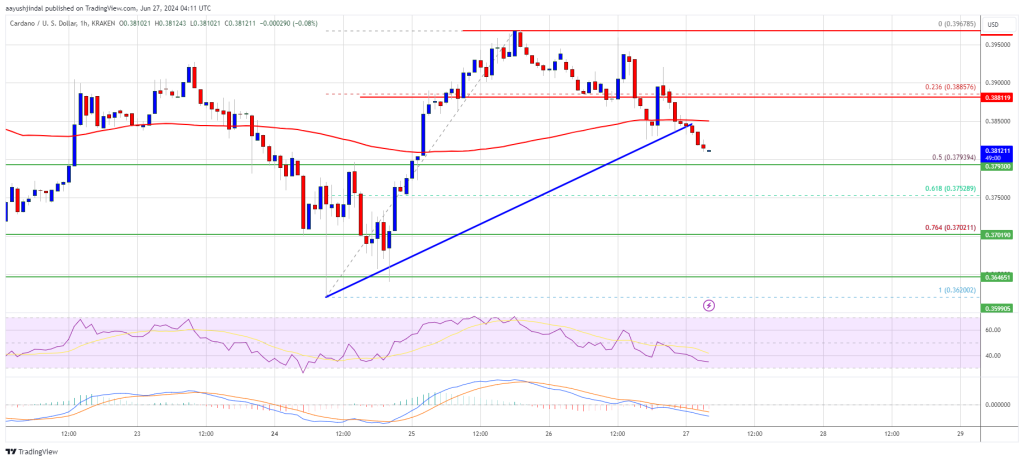
- There was a break below a key bullish trend line with support at $0.3845 on the hourly chart of the ADA/USD pair (data source from Kraken).
- The pair could extend losses and test the $0.370 support zone.
Cardano Price Dips Again
In the past few days, Cardano attempted a recovery wave above the $0.3650 zone like Bitcoin and Ethereum. However, ADA failed to clear the $0.40 resistance zone. A high was formed at $0.3967 and the price started a fresh decline.
There was a move below the $0.3880 and $0.3865 support levels. The price declined below the 23.6% Fib retracement level of the upward move from the $0.3620 swing low to the $0.3967 high. Besides, there was a break below a key bullish trend line with support at $0.3845 on the hourly chart of the ADA/USD pair.
ADA price is now trading below $0.3850 and the 100-hourly simple moving average. If there is another upward move, the price might face resistance near the $0.3850 zone.
The first resistance is near $0.3880. The next key resistance might be $0.40. If there is a close above the $0.40 resistance, the price could start a strong rally. In the stated case, the price could rise toward the $0.4150 region. Any more gains might call for a move toward $0.4250.
More Downsides in ADA?
If Cardano’s price fails to climb above the $0.3850 resistance level, it could continue to move down. Immediate support on the downside is near the $0.3795 level or the 50% Fib retracement level of the upward move from the $0.3620 swing low to the $0.3967 high.
The next major support is near the $0.370 level. A downside break below the $0.370 level could open the doors for a test of $0.350. The next major support is near the $0.3350 level.
Technical Indicators
Hourly MACD – The MACD for ADA/USD is gaining momentum in the bearish zone.
Hourly RSI (Relative Strength Index) – The RSI for ADA/USD is now below the 50 level.
Major Support Levels – $0.3790, $0.370, and $0.350.
Major Resistance Levels – $0.3880 and $0.400.


The brief rumor of a 90-day pause from Trump’s tariffs caused the markets to rally significantly. However, the White House squashed these rumors, fueling further crashes.
This highlights a genuine desperation in the markets as traders try to regain some bullish momentum and prevent a recession.
Trump Tariff Fakeout
The threat of Trump’s tariffs is closer than ever, and it’s causing a “Black Monday” event in the crypto markets. Bitcoin dipped below $80,000, and over $1 billion was liquidated from crypto.
However, one of the President’s advisors, Kevin Hassett, suggested this morning that he might be having second thoughts:
“Would Trump consider a 90-day pause in tariffs?’ ‘I think the president is gonna decide what the president is gonna decide … even if you think there will be some negative effect from the trade side, that’s still a small share of GDP,’” Hassett said in an interview.
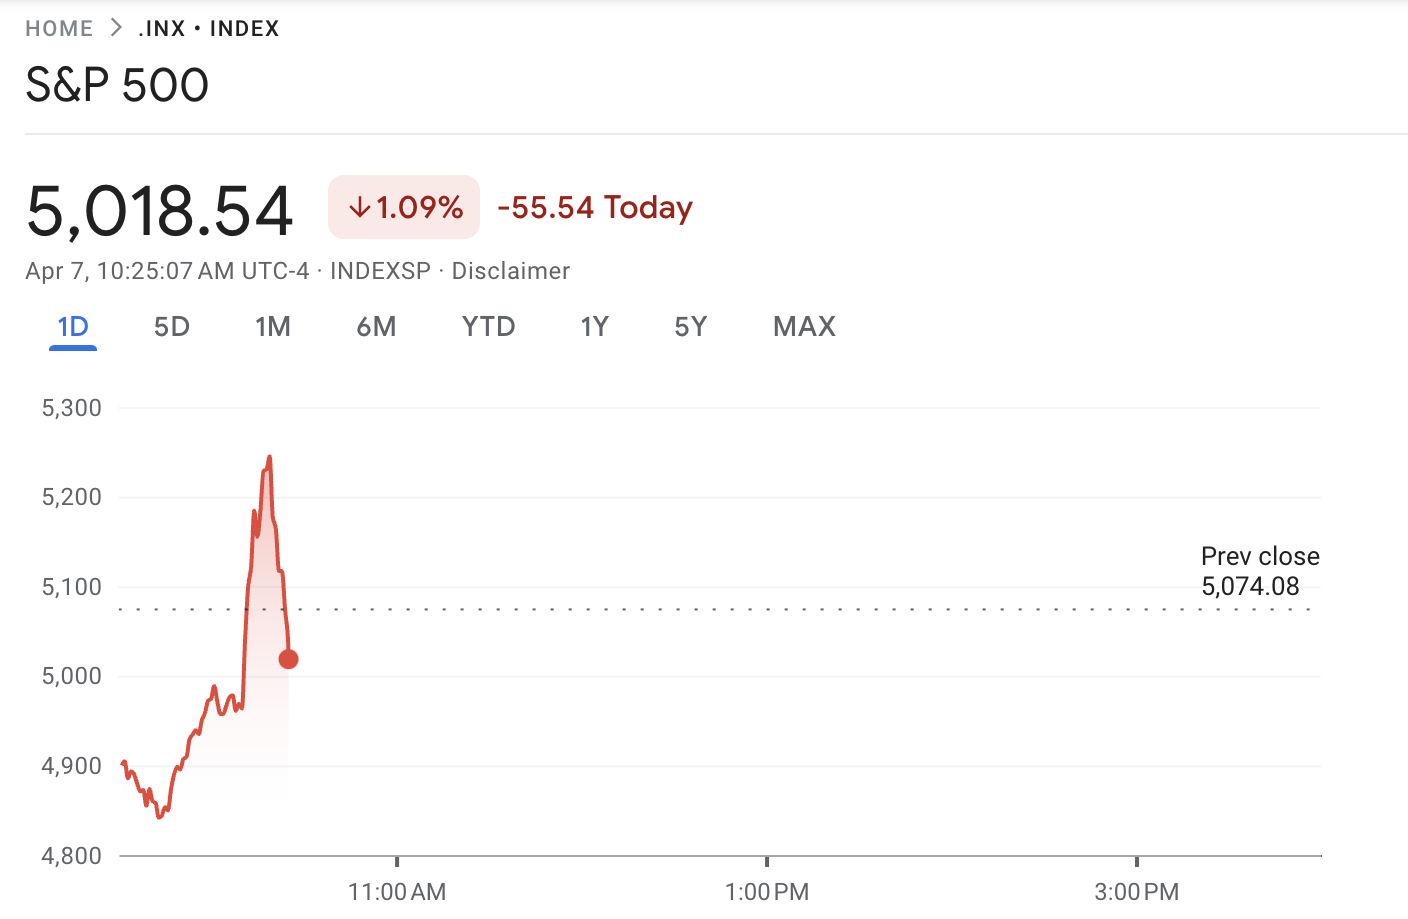
This news quickly began recirculating, claiming that Trump was seriously considering a 90-day pause in tariffs. This created a huge rally in traditional markets, with the S&P 500 shooting up 6% in seconds. This rally turned on a dime to a certain extent, falling again quickly.
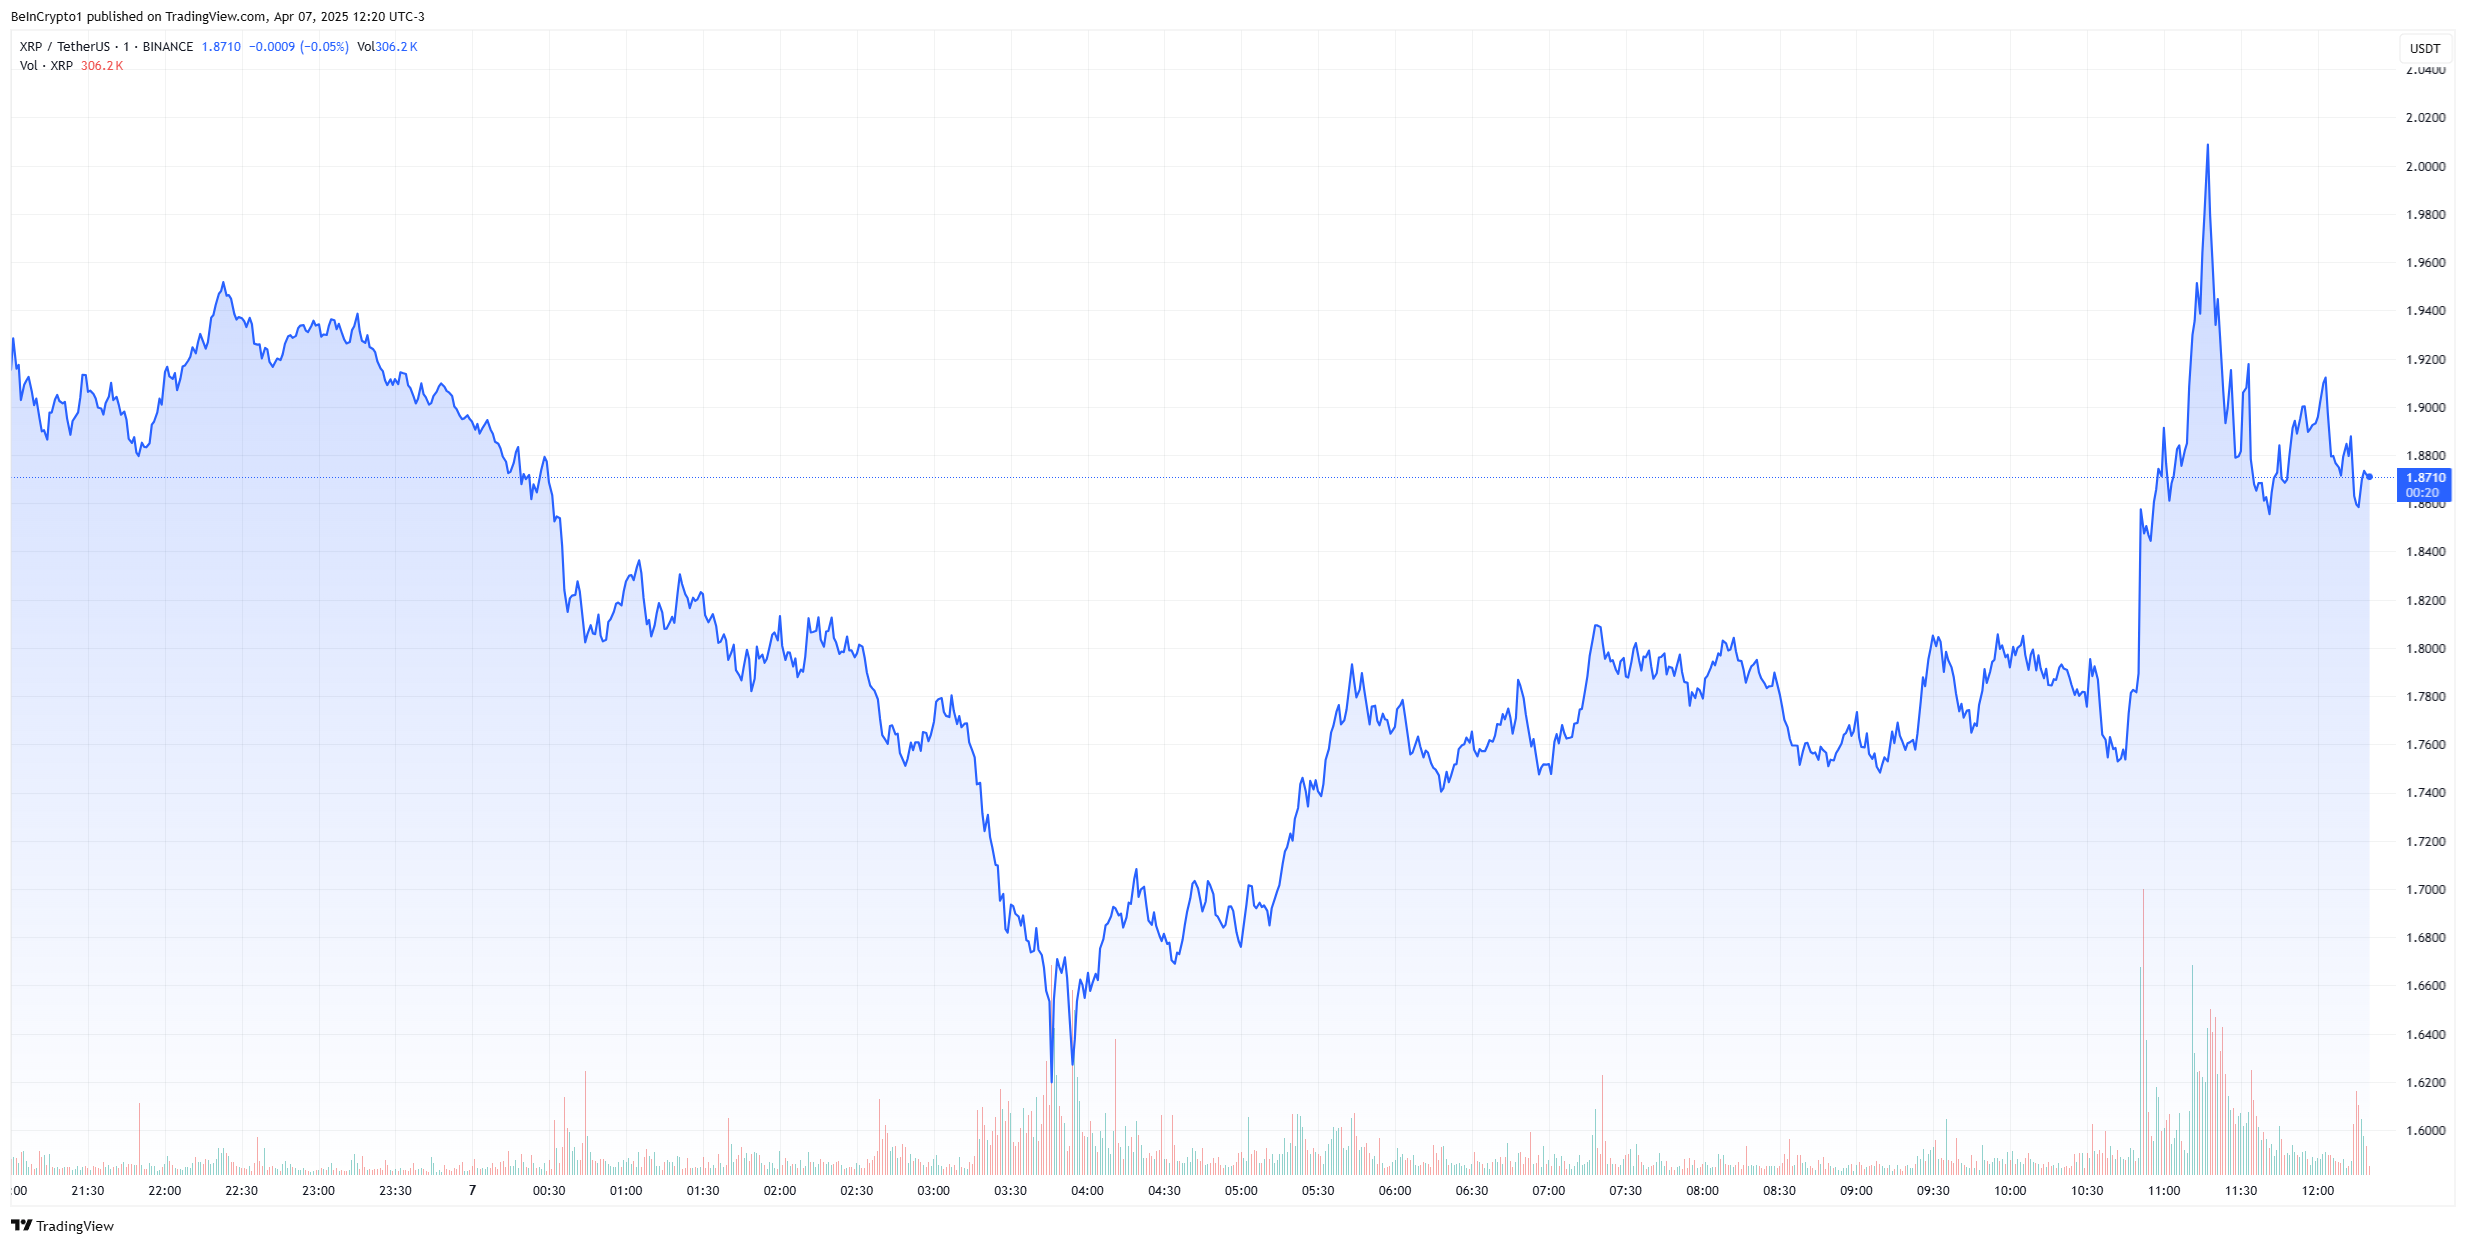
Following the rumor, XRP rallied nearly 10% to hit $2, while Bitcoin rebounded back to $80,000. Both assets have declined again due to the lack of credibility of the news. Overall, the volatility has been extremely chaotic in the crypto market today.
In his interview, Hassett did not make any firm commitments that Trump is considering pausing tariffs. His response focused mostly on ongoing negotiations and assertions that the tariffs would have a limited impact.
Shortly afterward, the White House officially denied any knowledge of a 90-day pause. They are still set to begin in two days.
Disclaimer
In adherence to the Trust Project guidelines, BeInCrypto is committed to unbiased, transparent reporting. This news article aims to provide accurate, timely information. However, readers are advised to verify facts independently and consult with a professional before making any decisions based on this content. Please note that our Terms and Conditions, Privacy Policy, and Disclaimers have been updated.


Changpeng ‘CZ’ Zhao, the founder of Binance, has reportedly taken on a new role as Strategic Advisor to the Pakistan Crypto Council.
Pakistan’s local media suggests that the appointment was confirmed during a meeting held in Islamabad with top government officials.
CZ Joins Pakistan Crypto Council
The Finance Minister, Senator Muhammad Aurangzeb, reportedly led the session. Other attendees included the heads of Pakistan’s key financial and regulatory bodies—the Securities and Exchange Commission and the State Bank—and senior officials from the law and IT ministries.
According to the reports, Zhao also met separately with Pakistan’s Prime Minister and Deputy Prime Minister to discuss digital asset policy and blockchain adoption.
His involvement with Pakistan follows a recent agreement with the Kyrgyz Republic. There, he is advising on Web3 infrastructure and blockchain education.
Kyrgyzstan has also launched the A7A5 stablecoin, pegged to the Russian ruble. Both Kyrgyzstan and Pakistan are looking to develop their financial ecosystem around crypto to attract industry interest in the regions.
Meanwhile, CZ continues to engage with multiple governments on crypto regulation. He has been focused on building secure frameworks and enabling digital finance ecosystems.
BeInCrypto has contacted Binance about the reports and whether the company is involved in the initiative.
Disclaimer
In adherence to the Trust Project guidelines, BeInCrypto is committed to unbiased, transparent reporting. This news article aims to provide accurate, timely information. However, readers are advised to verify facts independently and consult with a professional before making any decisions based on this content. Please note that our Terms and Conditions, Privacy Policy, and Disclaimers have been updated.

The value of the leading altcoin, Ethereum, has plunged to its lowest point since March 2023, signaling a steep decline in market confidence. This has happened amid the broader market’s downturn, which was exacerbated by Donald Trump’s Liberation Day.
Compounding the bearish sentiment, the ETH/BTC ratio has now dropped to a five-year low, indicating that Bitcoin is gaining relative strength against Ethereum.
ETH/BTC Ratio Hits 5-Year Low as Traders Flee
ETH’s price decline has pushed the ETH/BTC ratio to a five-year low of 0.019. This ratio measures ETH’s relative value compared to BTC. When it rises, it indicates that ETH is outperforming BTC, either because the altcoin’s price is growing faster or the king coin’s price is falling.
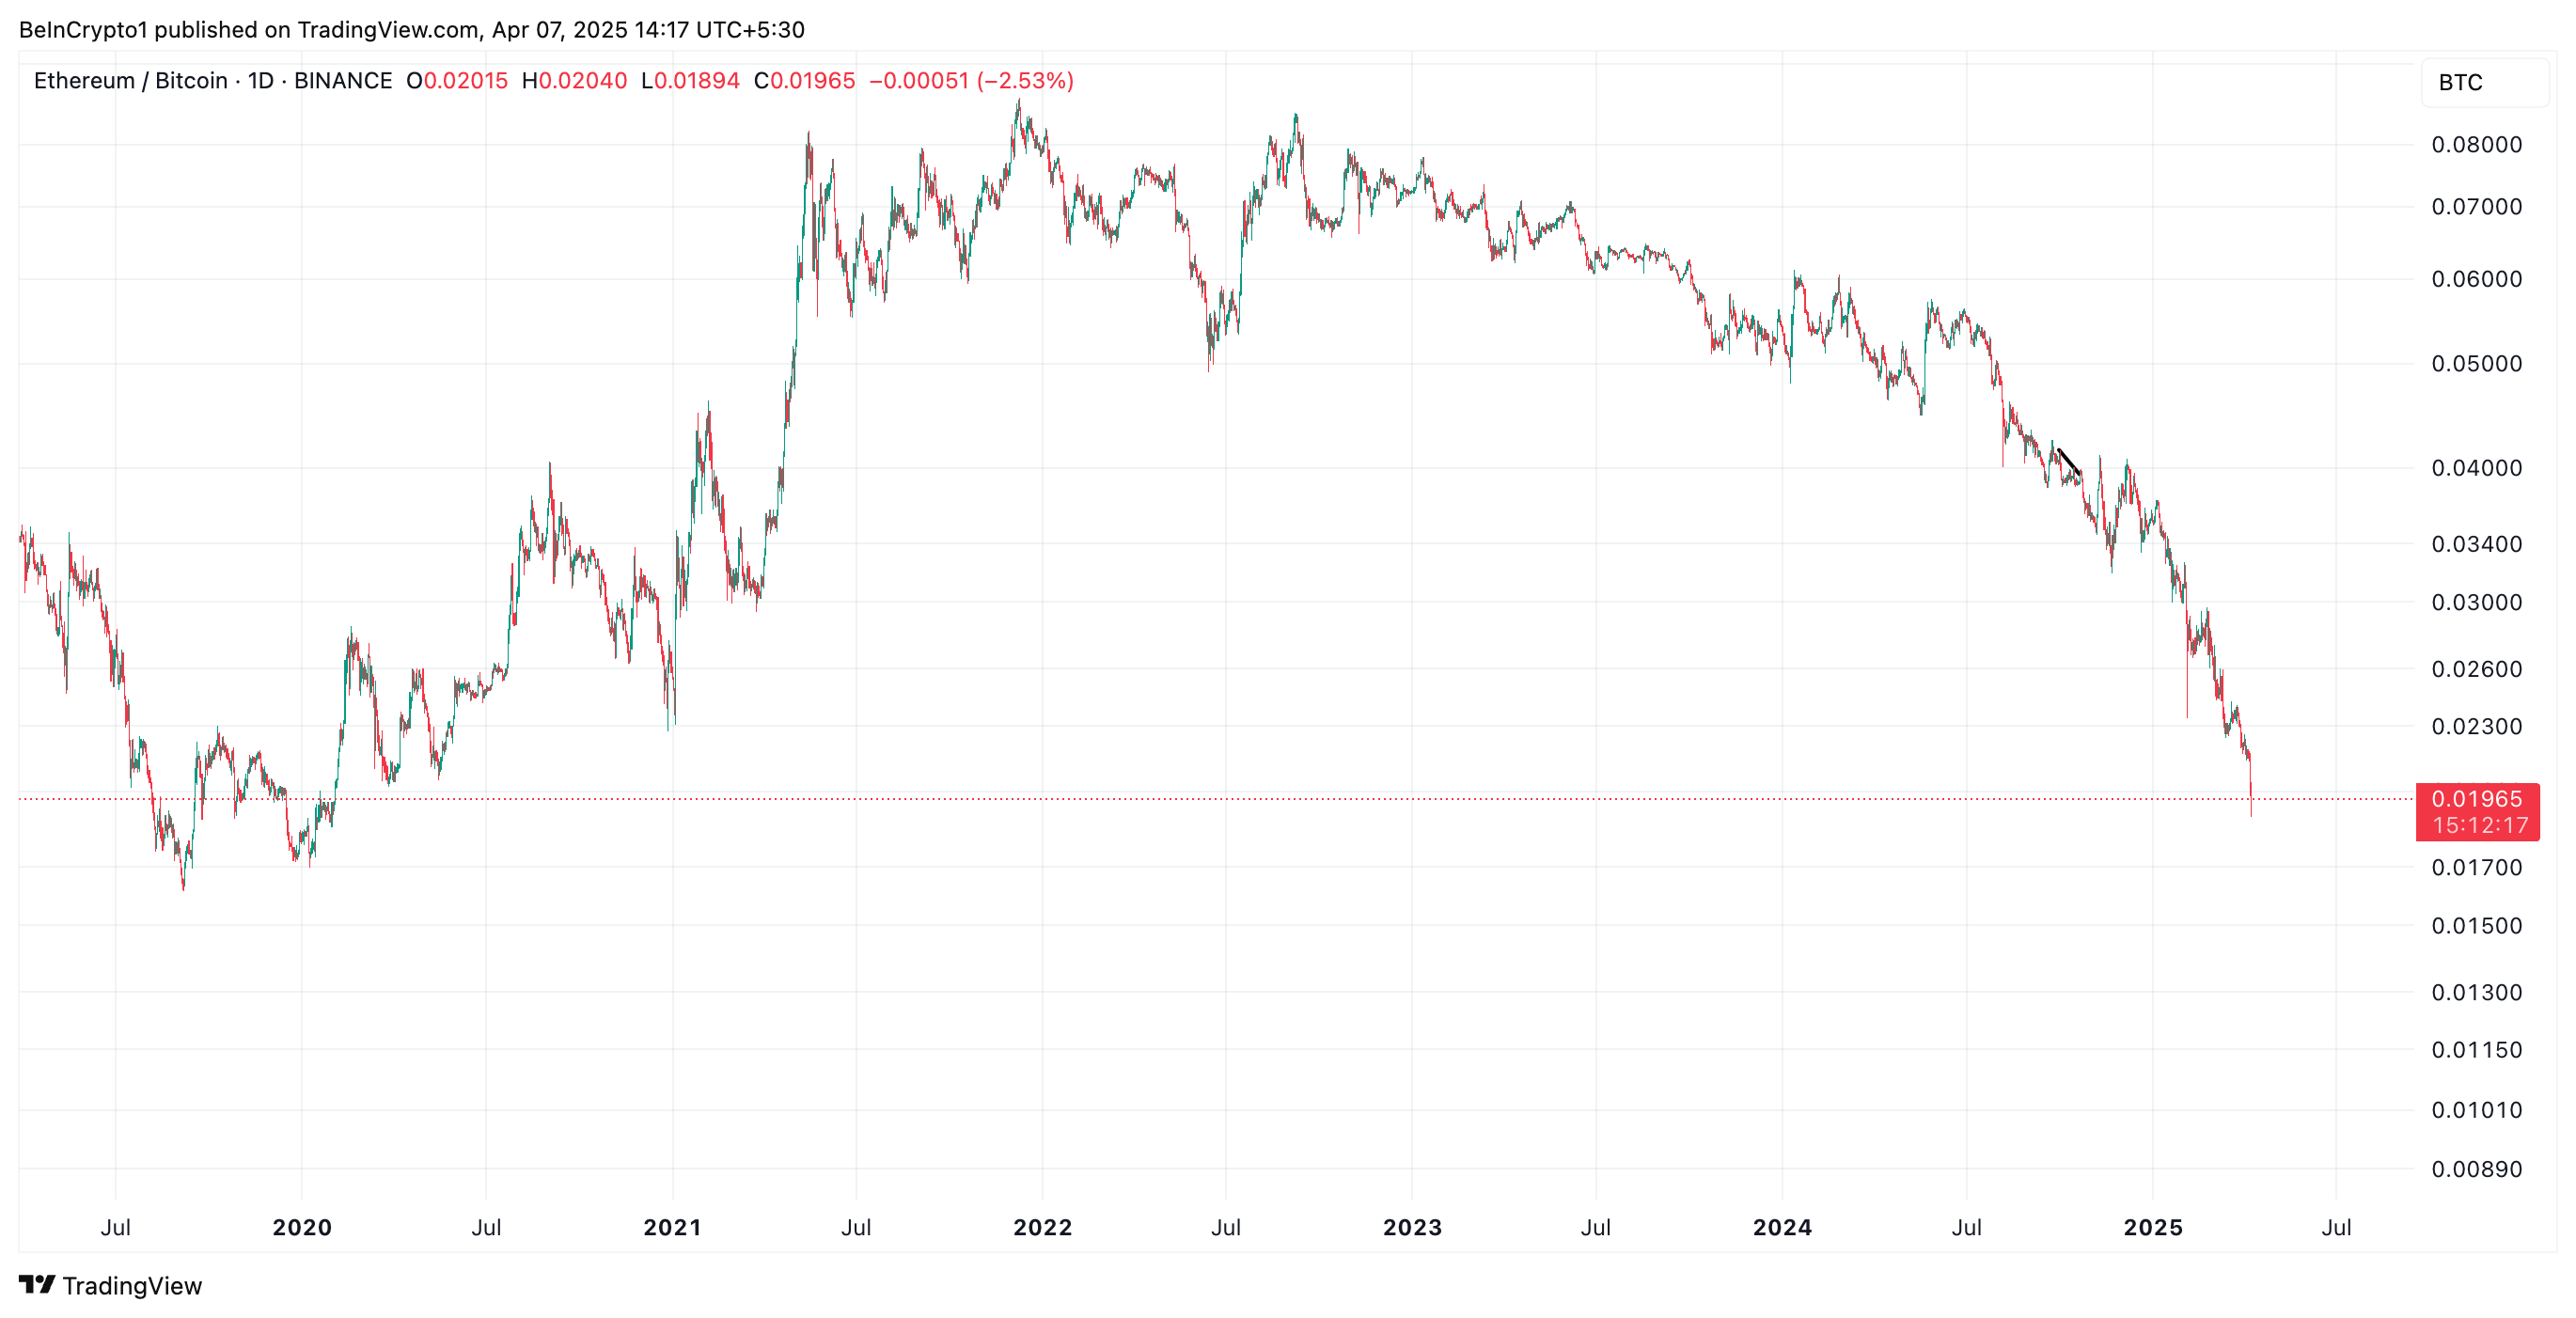
Conversely, a decline like this suggests that the leading coin, BTC, is gaining strength relative to the top altcoin, ETH. It suggests that traders are moving capital into BTC, seeing it as a safer or more profitable investment at the moment despite its own price troubles.
Further, on the daily chart, ETH’s negative Chaikin Money Flow (CMF) confirms the coin’s plummeting demand. At press time, it is at -0.07.
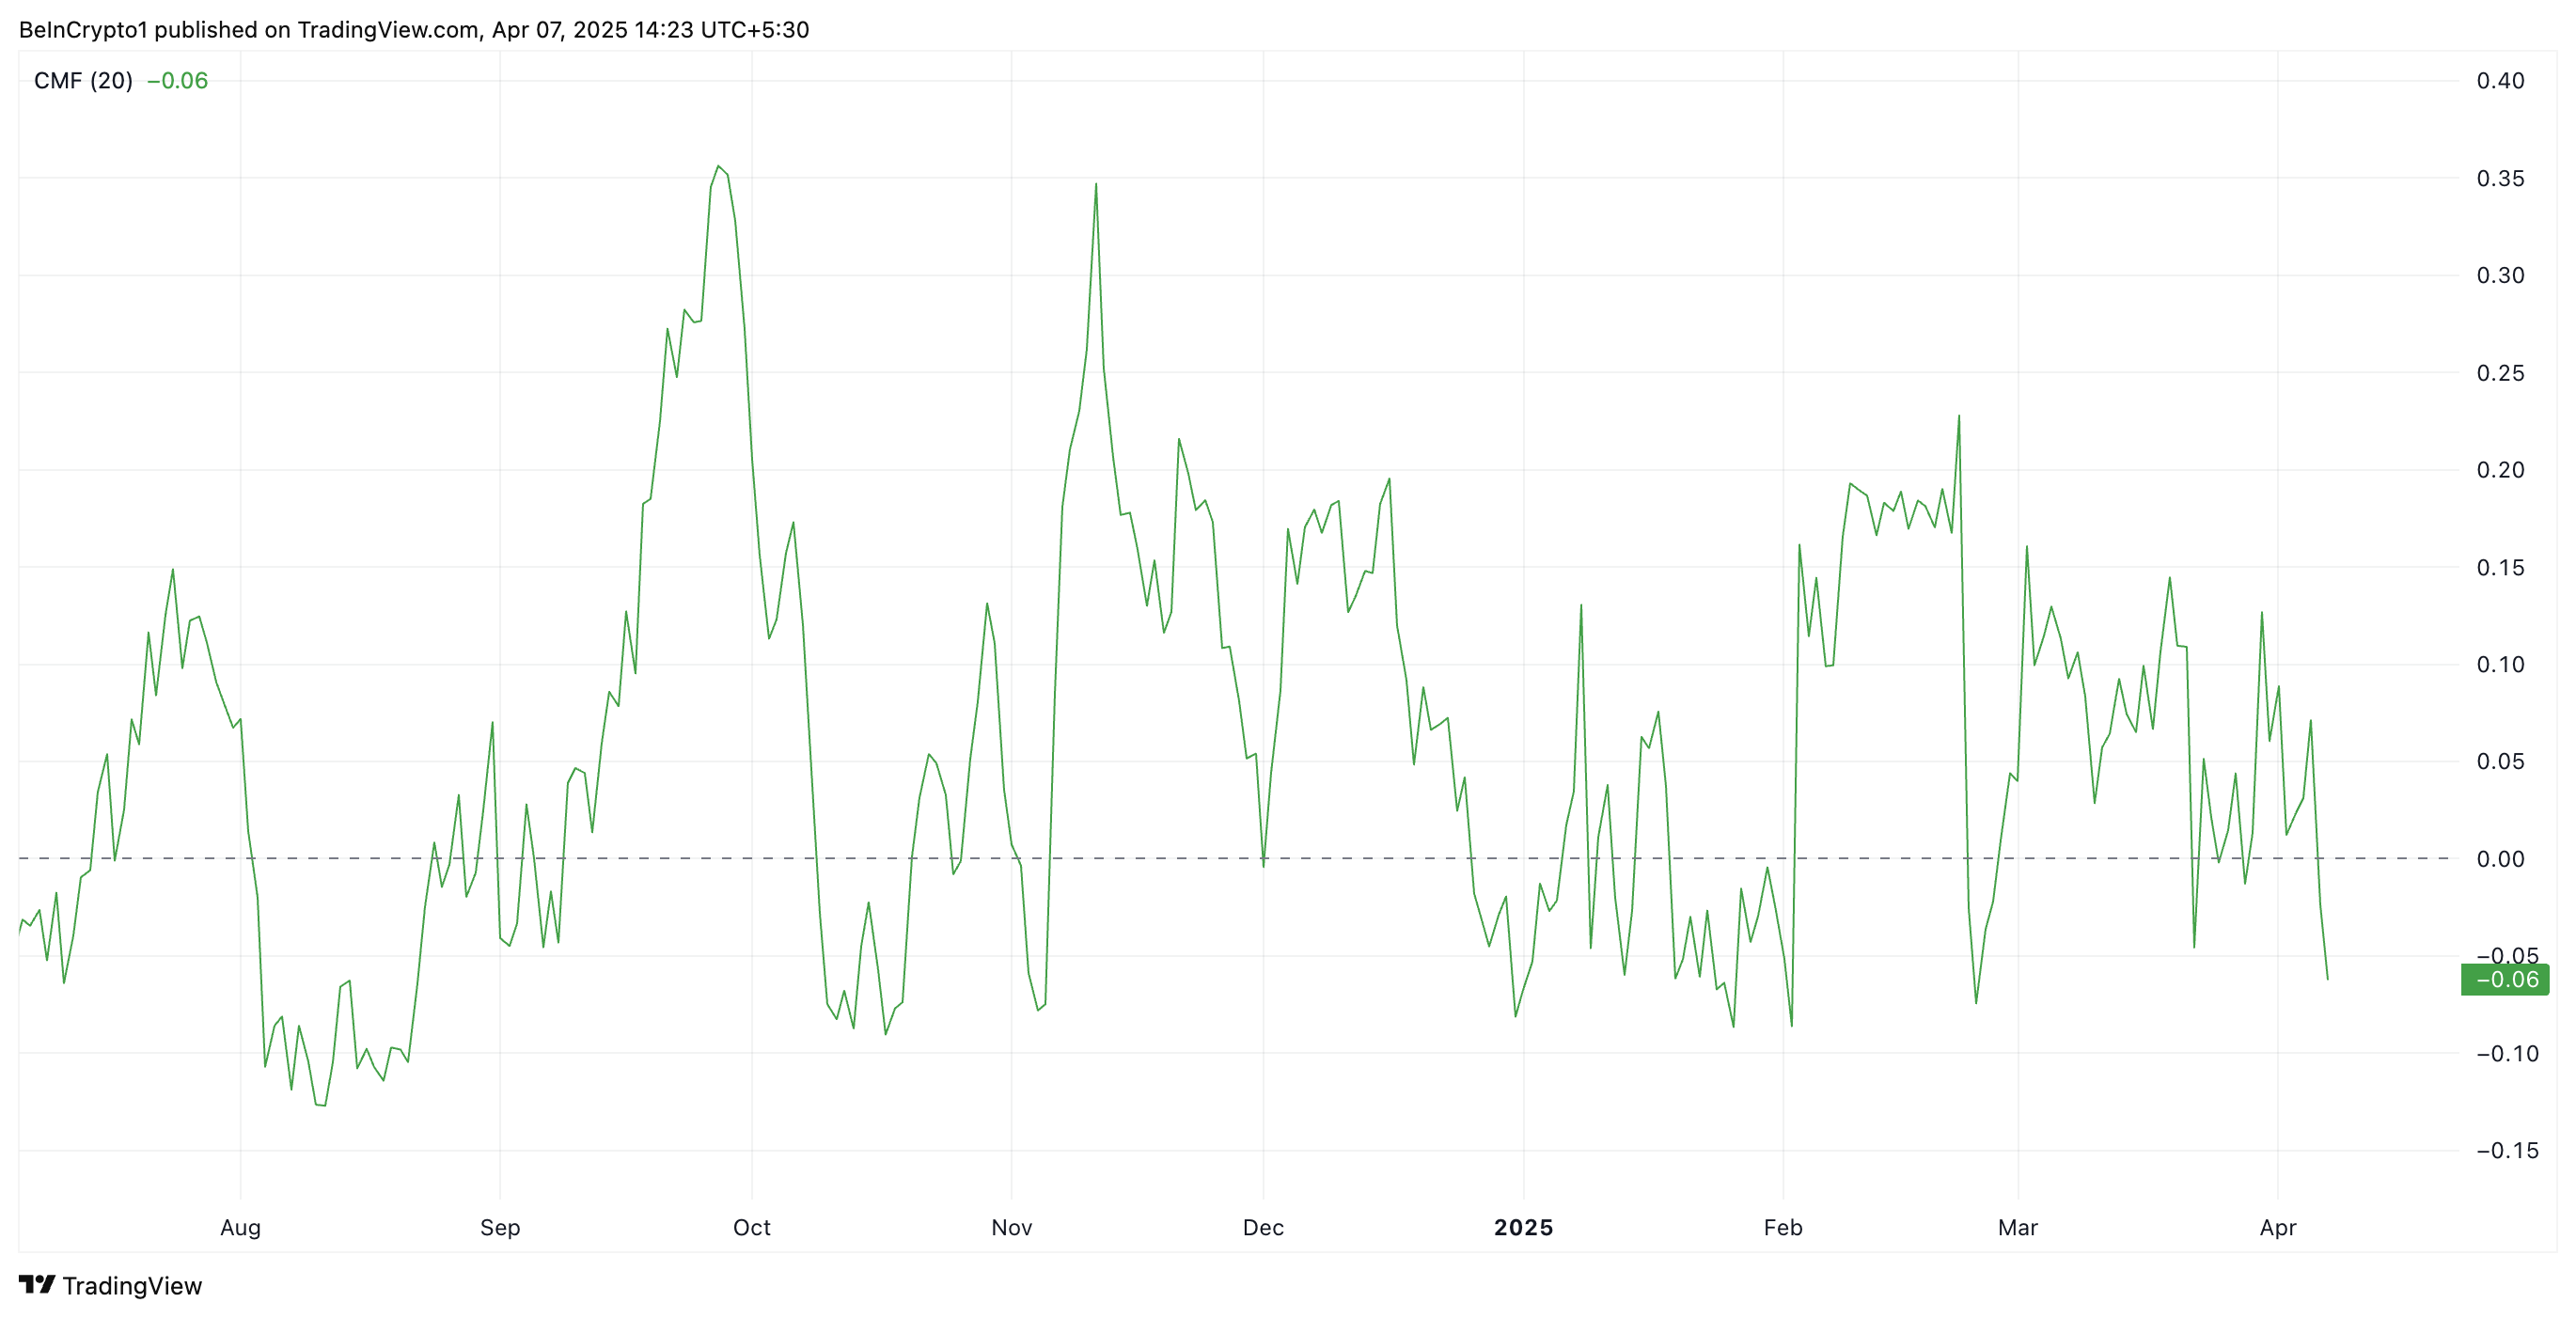
The CMF indicator measures the volume-weighted accumulation and distribution of an asset over a set period, helping gauge buying and selling pressure. When its value falls below zero like this, it indicates that selling pressure is dominating.
ETH’s CMF readings suggest that more traders are distributing (selling) the coin than accumulating it. This reflects weakening demand and is a bearish signal for the asset’s price momentum.
ETH Flashes Oversold Signal: Is a Bounce Back on the Horizon?
ETH’s Relative Strength Index (RSI), observed on a one-day chart, shows that the altcoin is currently oversold. At press time, the momentum indicator is in a downtrend at 25.62.
The RSI indicator measures an asset’s overbought and oversold market conditions. It ranges between 0 and 100. Values above 70 suggest that the asset is overbought and due for a price decline, while values under 30 indicate that the asset is oversold and may witness a rebound.
At 25.62, ETH’s RSI signals that the coin is deeply oversold. This presents a buying opportunity, as such lows are usually followed by a price rebound.
If this happens, ETH’s price could regain and climb back above $1,589. If this support level strengthens, it could propel ETH’s value to $1,904.
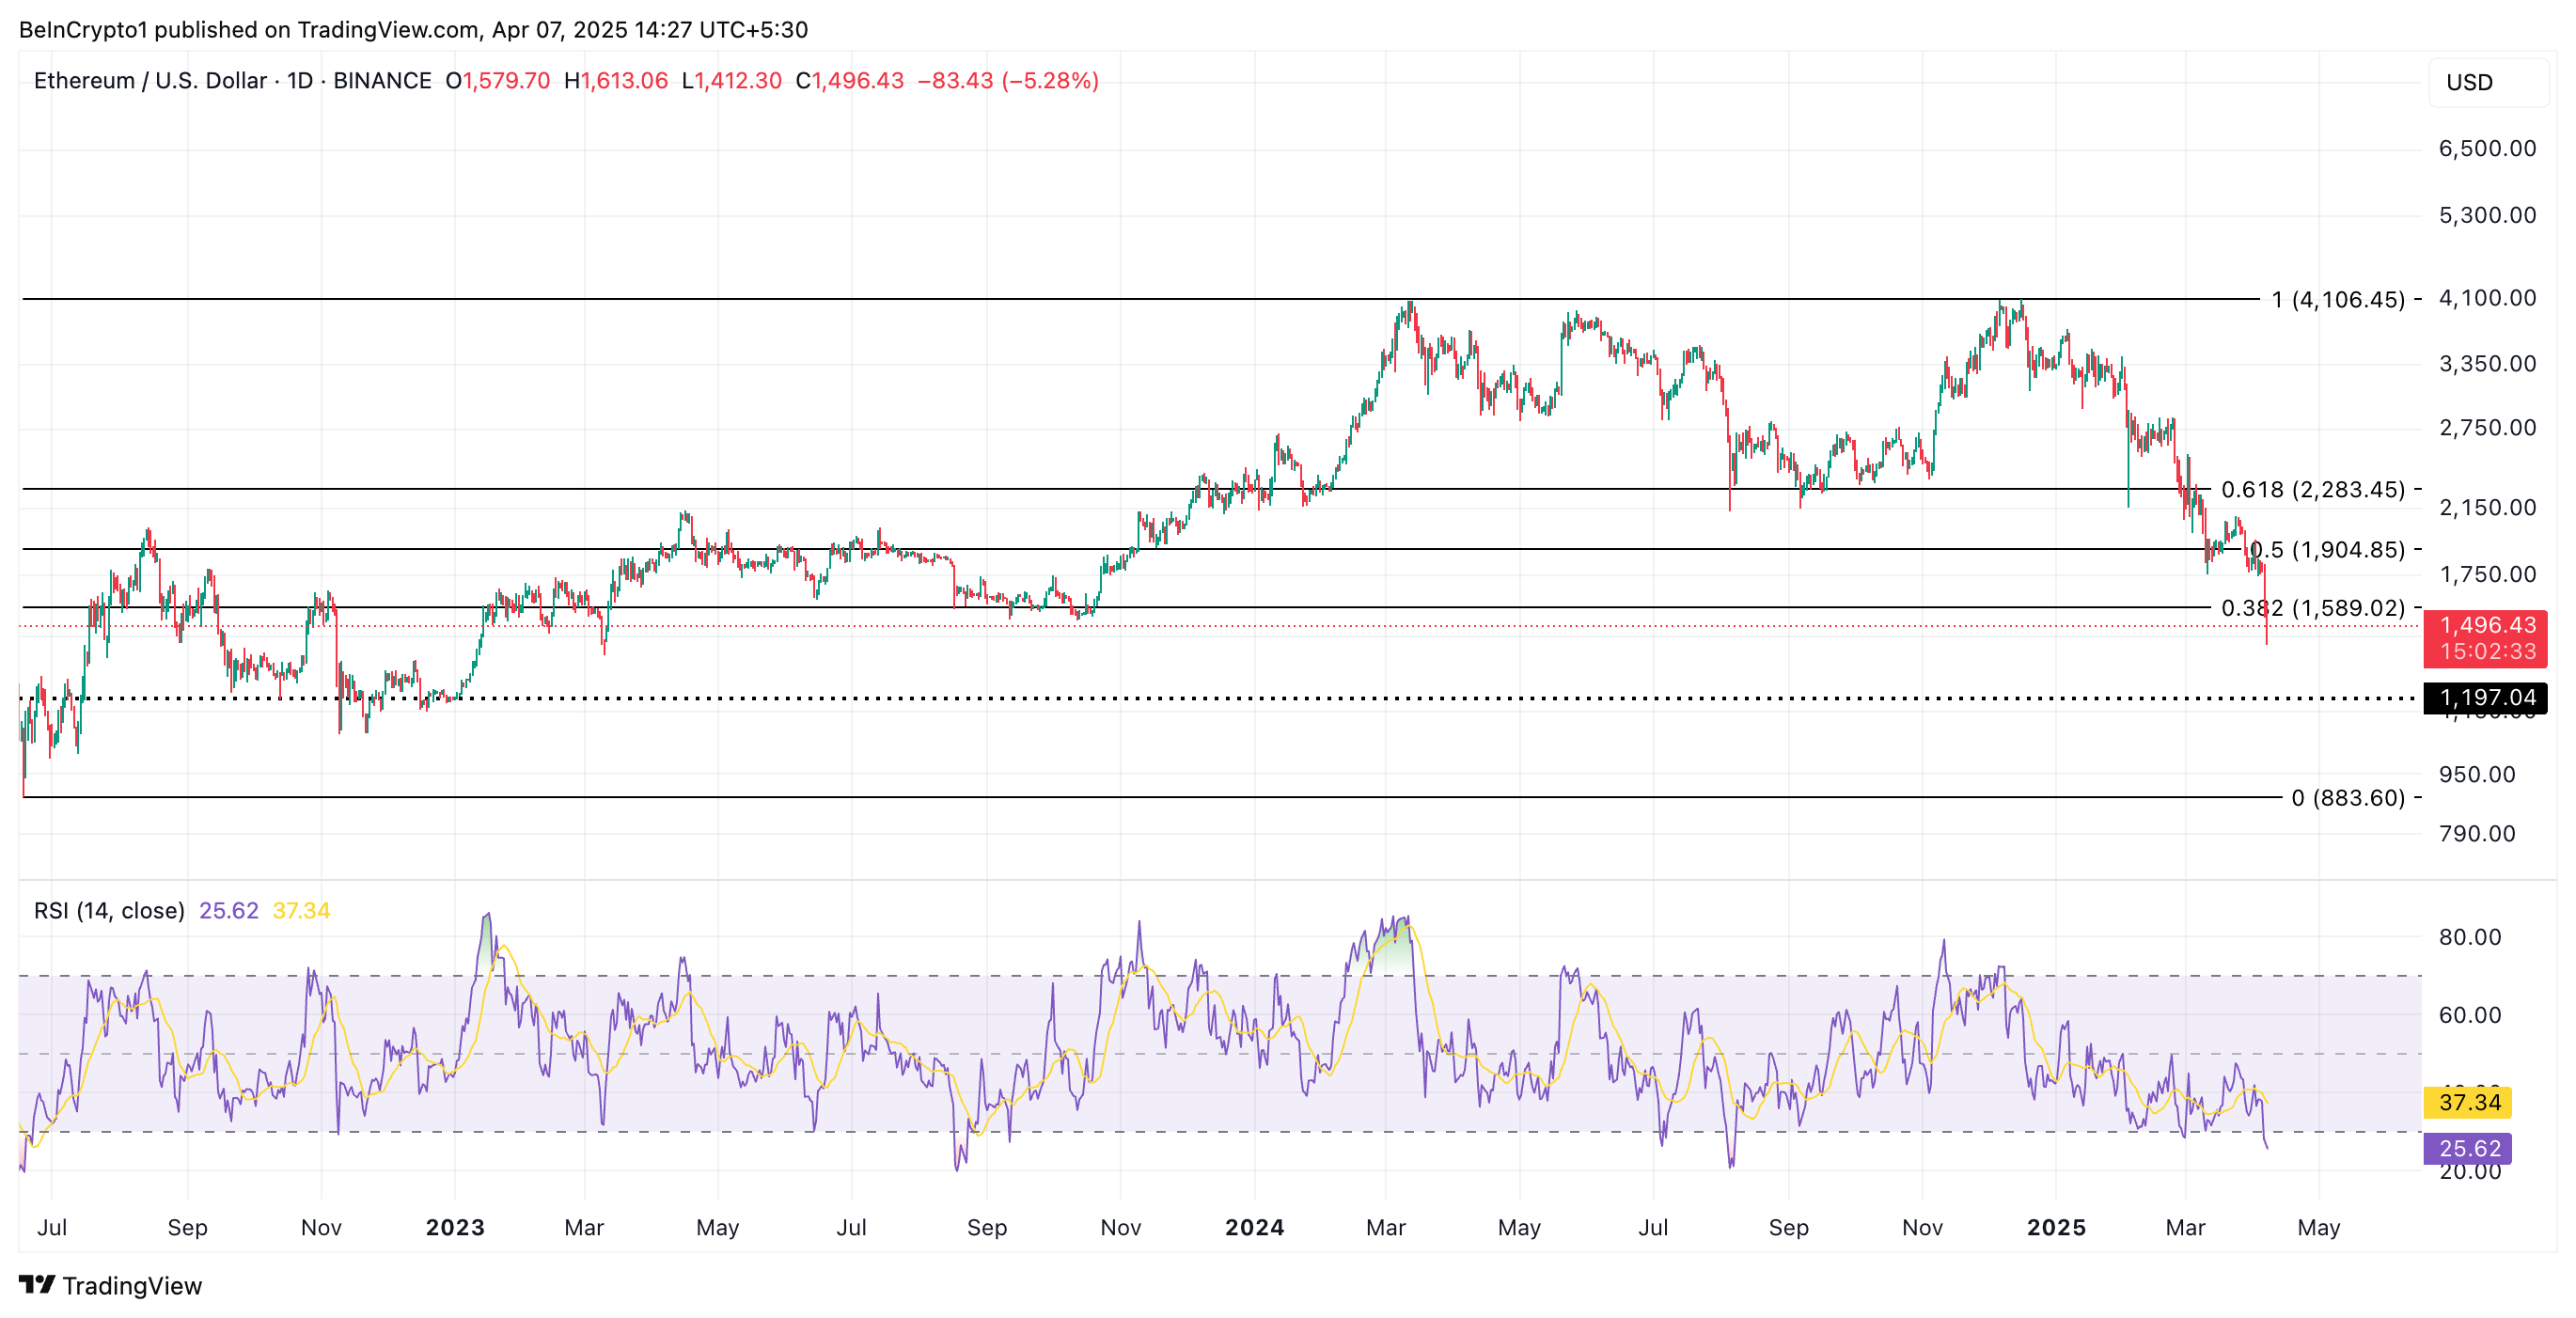
However, this rebound is not guaranteed. If ETH bears maintain dominance and selloffs continue, the coin could extend its decline and fall toward $1,197.
The post Ethereum (ETH) Tanks to March 2023 Levels as ETH/BTC Ratio Plummets to 5-Year Low appeared first on BeInCrypto.

XRP and Bitcoin Briefly Rallies After Rumors of 90-Day Tariff Pause
US Trade Tariffs Trigger $240 Million Crypto Outflows Last Week

Ethereum Price Looks Set To Crash To $1,000-$1,500, But Can It Fill The CME Gaps Upwards To $3,933

Pakistan’s Crypto Council Appoints Binance Founder Changpeng Zhao As Strategic Advisor

Dogecoin Whale Dumps 300M Coins Amid Market Crash, Can DOGE Price Dip Below $0.1?
Binance Founder CZ Joins Pakistan Crypto Council as Advisor

2.52 Million Altcoins Are Ruining Crypto’s Future

Animoca Brands Valuation Tanks 75% In Two Years, Here’s Why

Crypto exchange BingX hacked for $43 million

Are The Big Players Losing Interest?

Hong Kong’s Securities Association Tips Authorities On Crypto Self-Regulation

Coinbase cbBTC Set to go Live on Solana
2.52 Million Altcoins Are Ruining Crypto’s Future
Animoca Brands Valuation Tanks 75% In Two Years, Here’s Why
Crypto exchange BingX hacked for $43 million
Are The Big Players Losing Interest?
Hong Kong’s Securities Association Tips Authorities On Crypto Self-Regulation
Coinbase cbBTC Set to go Live on Solana
-
 Altcoin20 hours ago
Expert Reveals Decentralized Strategy To Stabilize Pi Network Price
-

 Bitcoin23 hours ago
US Macro Setup To Favour New Bitcoin ATH In The Long Run
-

 Ethereum22 hours ago
Ethereum Lags Behind Bitcoin In Q1 Performance Amid Market Downturn – Details
-
 Ethereum18 hours ago
Ethereum Supply On Exchanges Plummets – Is A Supply Squeeze Coming?
-

 Market23 hours ago
3 Token Unlocks for This Week: AXS, JTO, XAV
-

 Market20 hours ago
Bitcoin Price Drops Below $80,000 Amid Heavy Weekend Selloff
-

 Market24 hours ago
Key Solana Holders’ 6-Month High Accumulation Signal Price Rise
-

 Market6 hours ago
Ethereum Price Tanks Hard—Can It Survive the $1,500 Test?