
Market
Can XRP Price Break New Highs as Whales Exit Exchanges?
Ripple’s (XRP) price has surged back to $0.60 for the first time in 10 days, recording a 7.74% gain in the last 24 hours. This rally aligns with a broader market recovery, making XRP the top gainer among the top 10 cryptocurrencies.
Starting the week with this positive momentum is promising, but the key question remains whether XRP can maintain this trend and end the week even stronger.
Demand for Ripple Jumps as Whales Take the Bull by the Horn
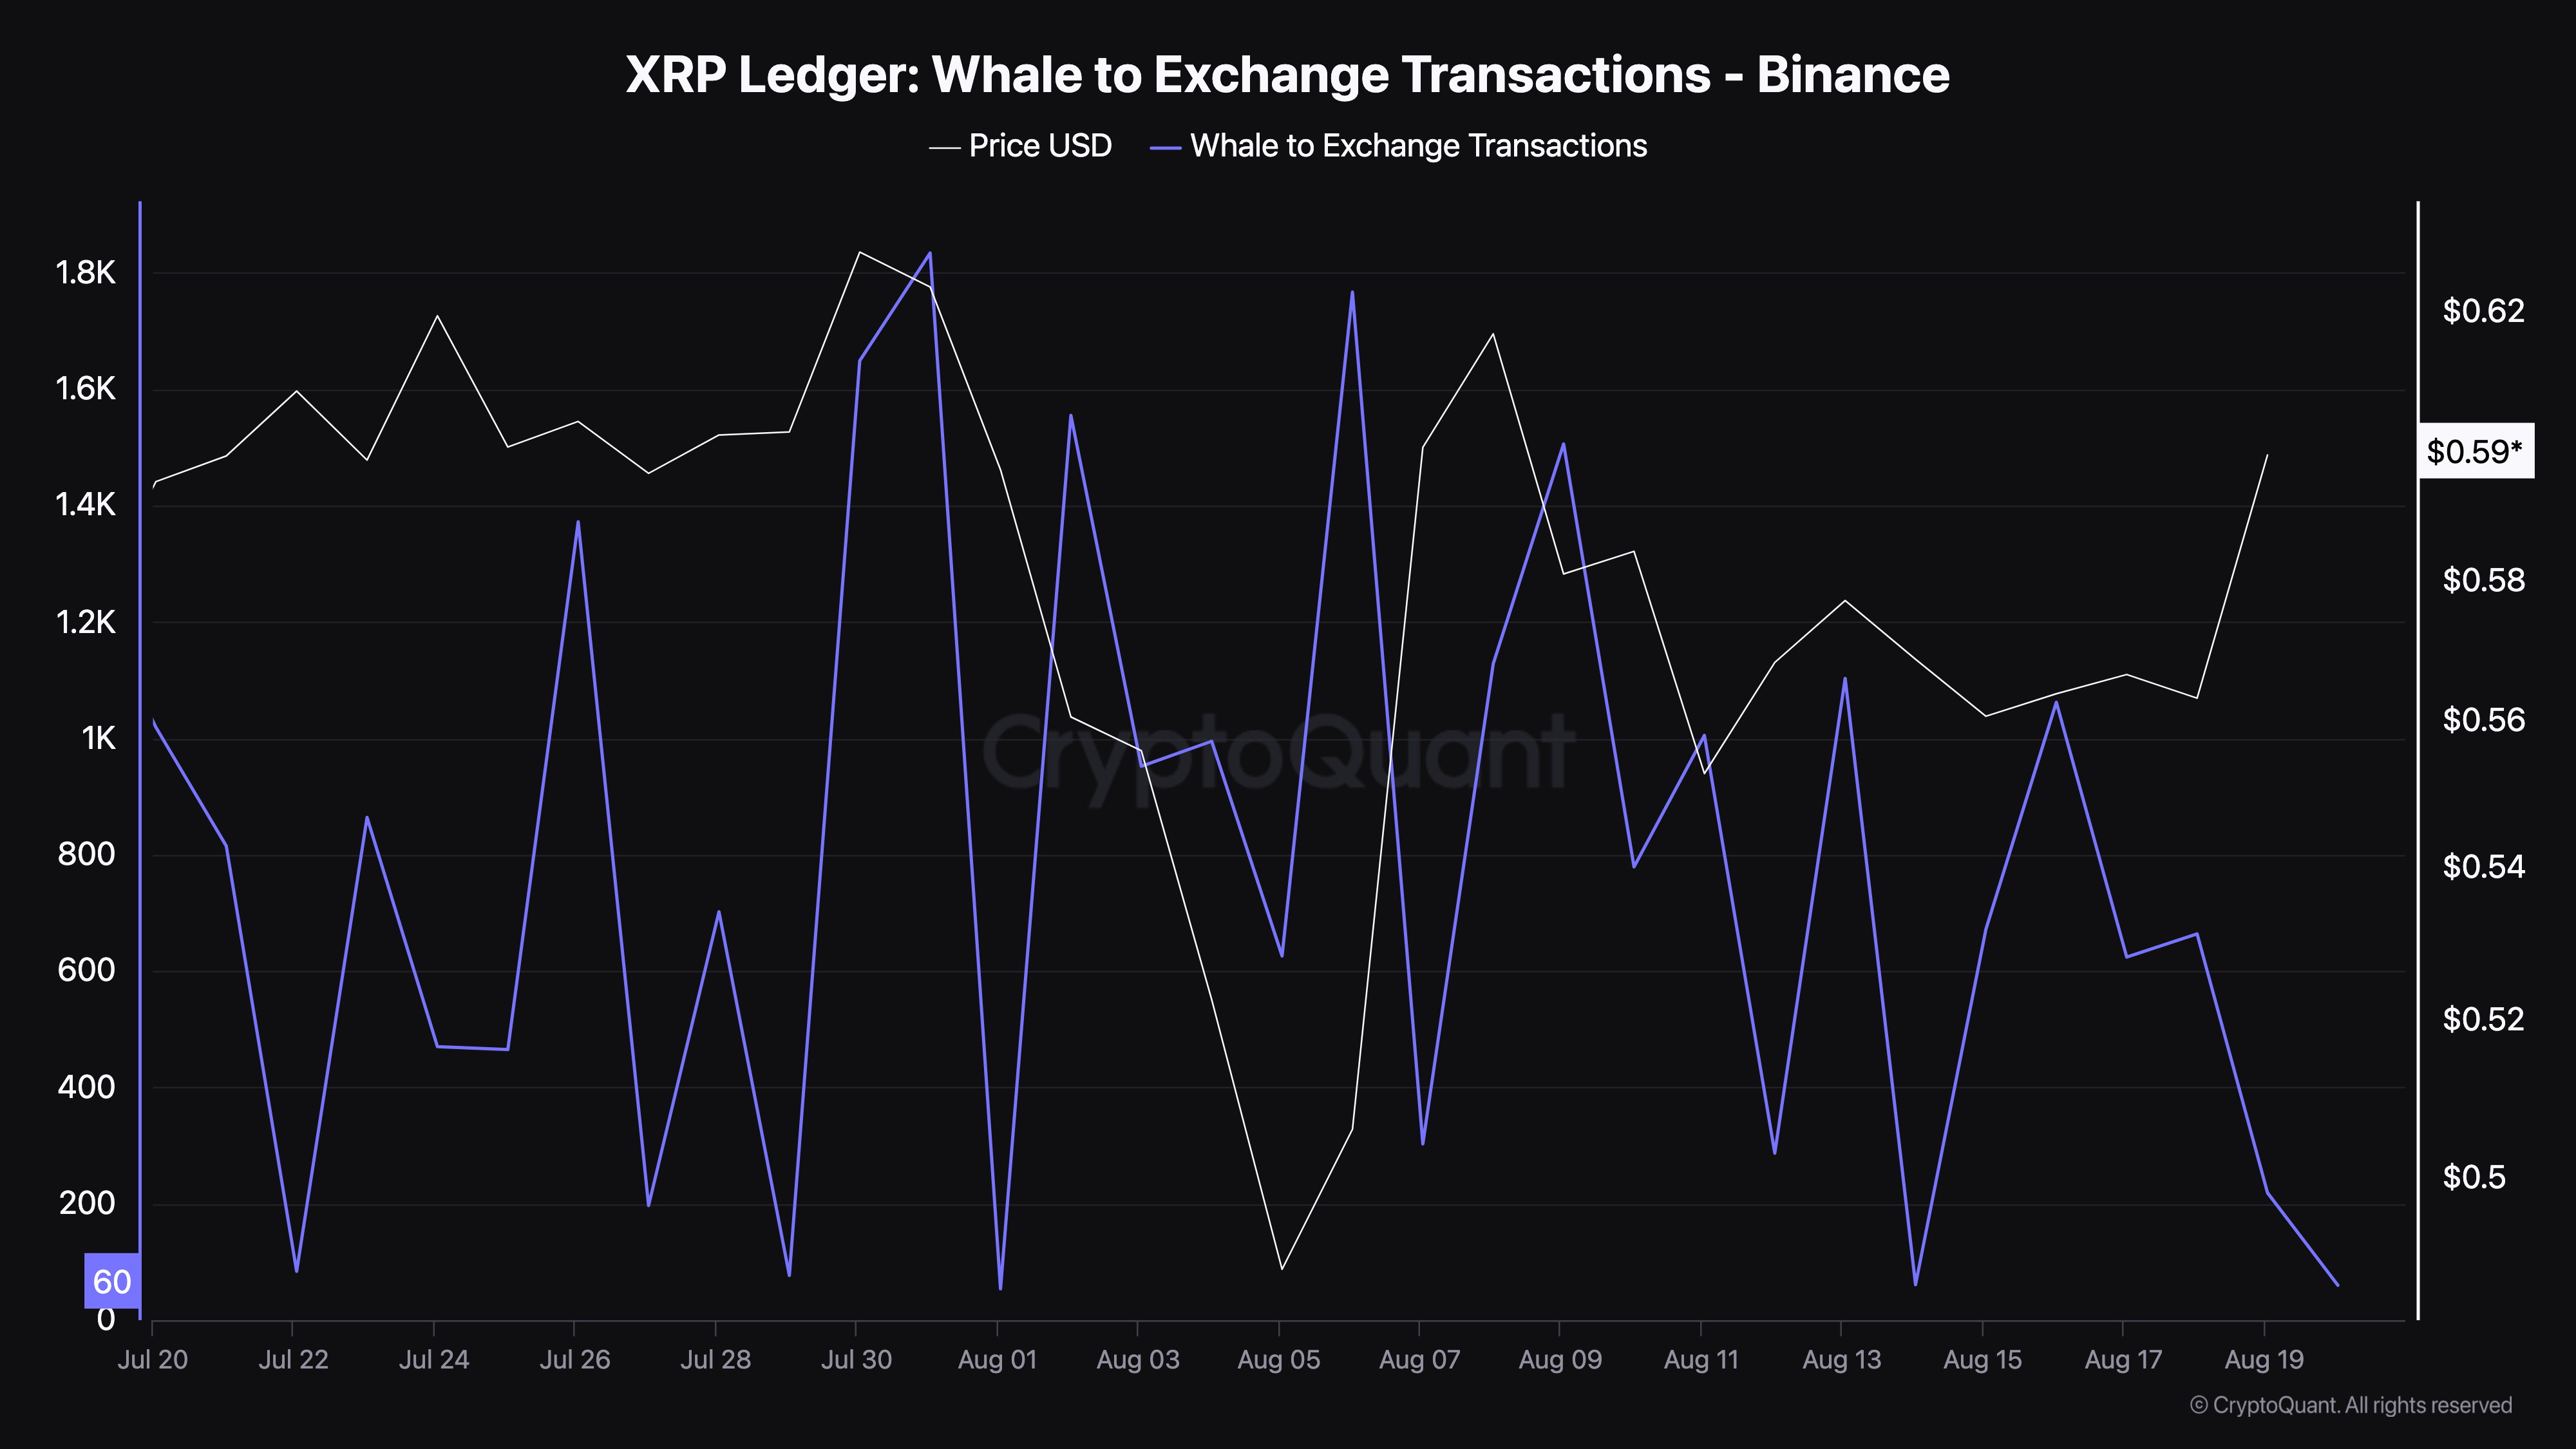
According to CryptoQuant, the Whale-to-Exchange Transactions obtained from the XRP Ledger have fallen tenfold since August 18. This metric measures how active cryptos move between whales and exchanges — in this instance, Binance.
Typically, an increase in transactions suggests that whales are willing to offload some tokens. A decrease points to withdrawals from the platform, which is a bullish sign.
On Sunday, there were about 664 transactions. But as of this writing, there are 60, indicating that most whales do not plan to sell their XRP anytime soon. Furthermore, it appears that this lack of selling pressure was crucial to the cryptocurrency’s rebound.
Read more: XRP ETF Explained: What It Is and How It Works
If sustained, XRP’s price will likely trade above $0.60 in the coming days. However, it is important to mention that the transactions in the above context are related to centralized exchanges (CEXes).
While large transactions on CEXes dropped, the volume of transactions on Decentralized Exchanges (DEXes) jumped by 28% in the last 24 hours. This increase suggests that demand for XRP increased on-chain.
Likewise, the high volume concentration is likely a byproduct of active user engagement on the XRP Ledger. DEX volume is an important metric that measures liquidity in the market.
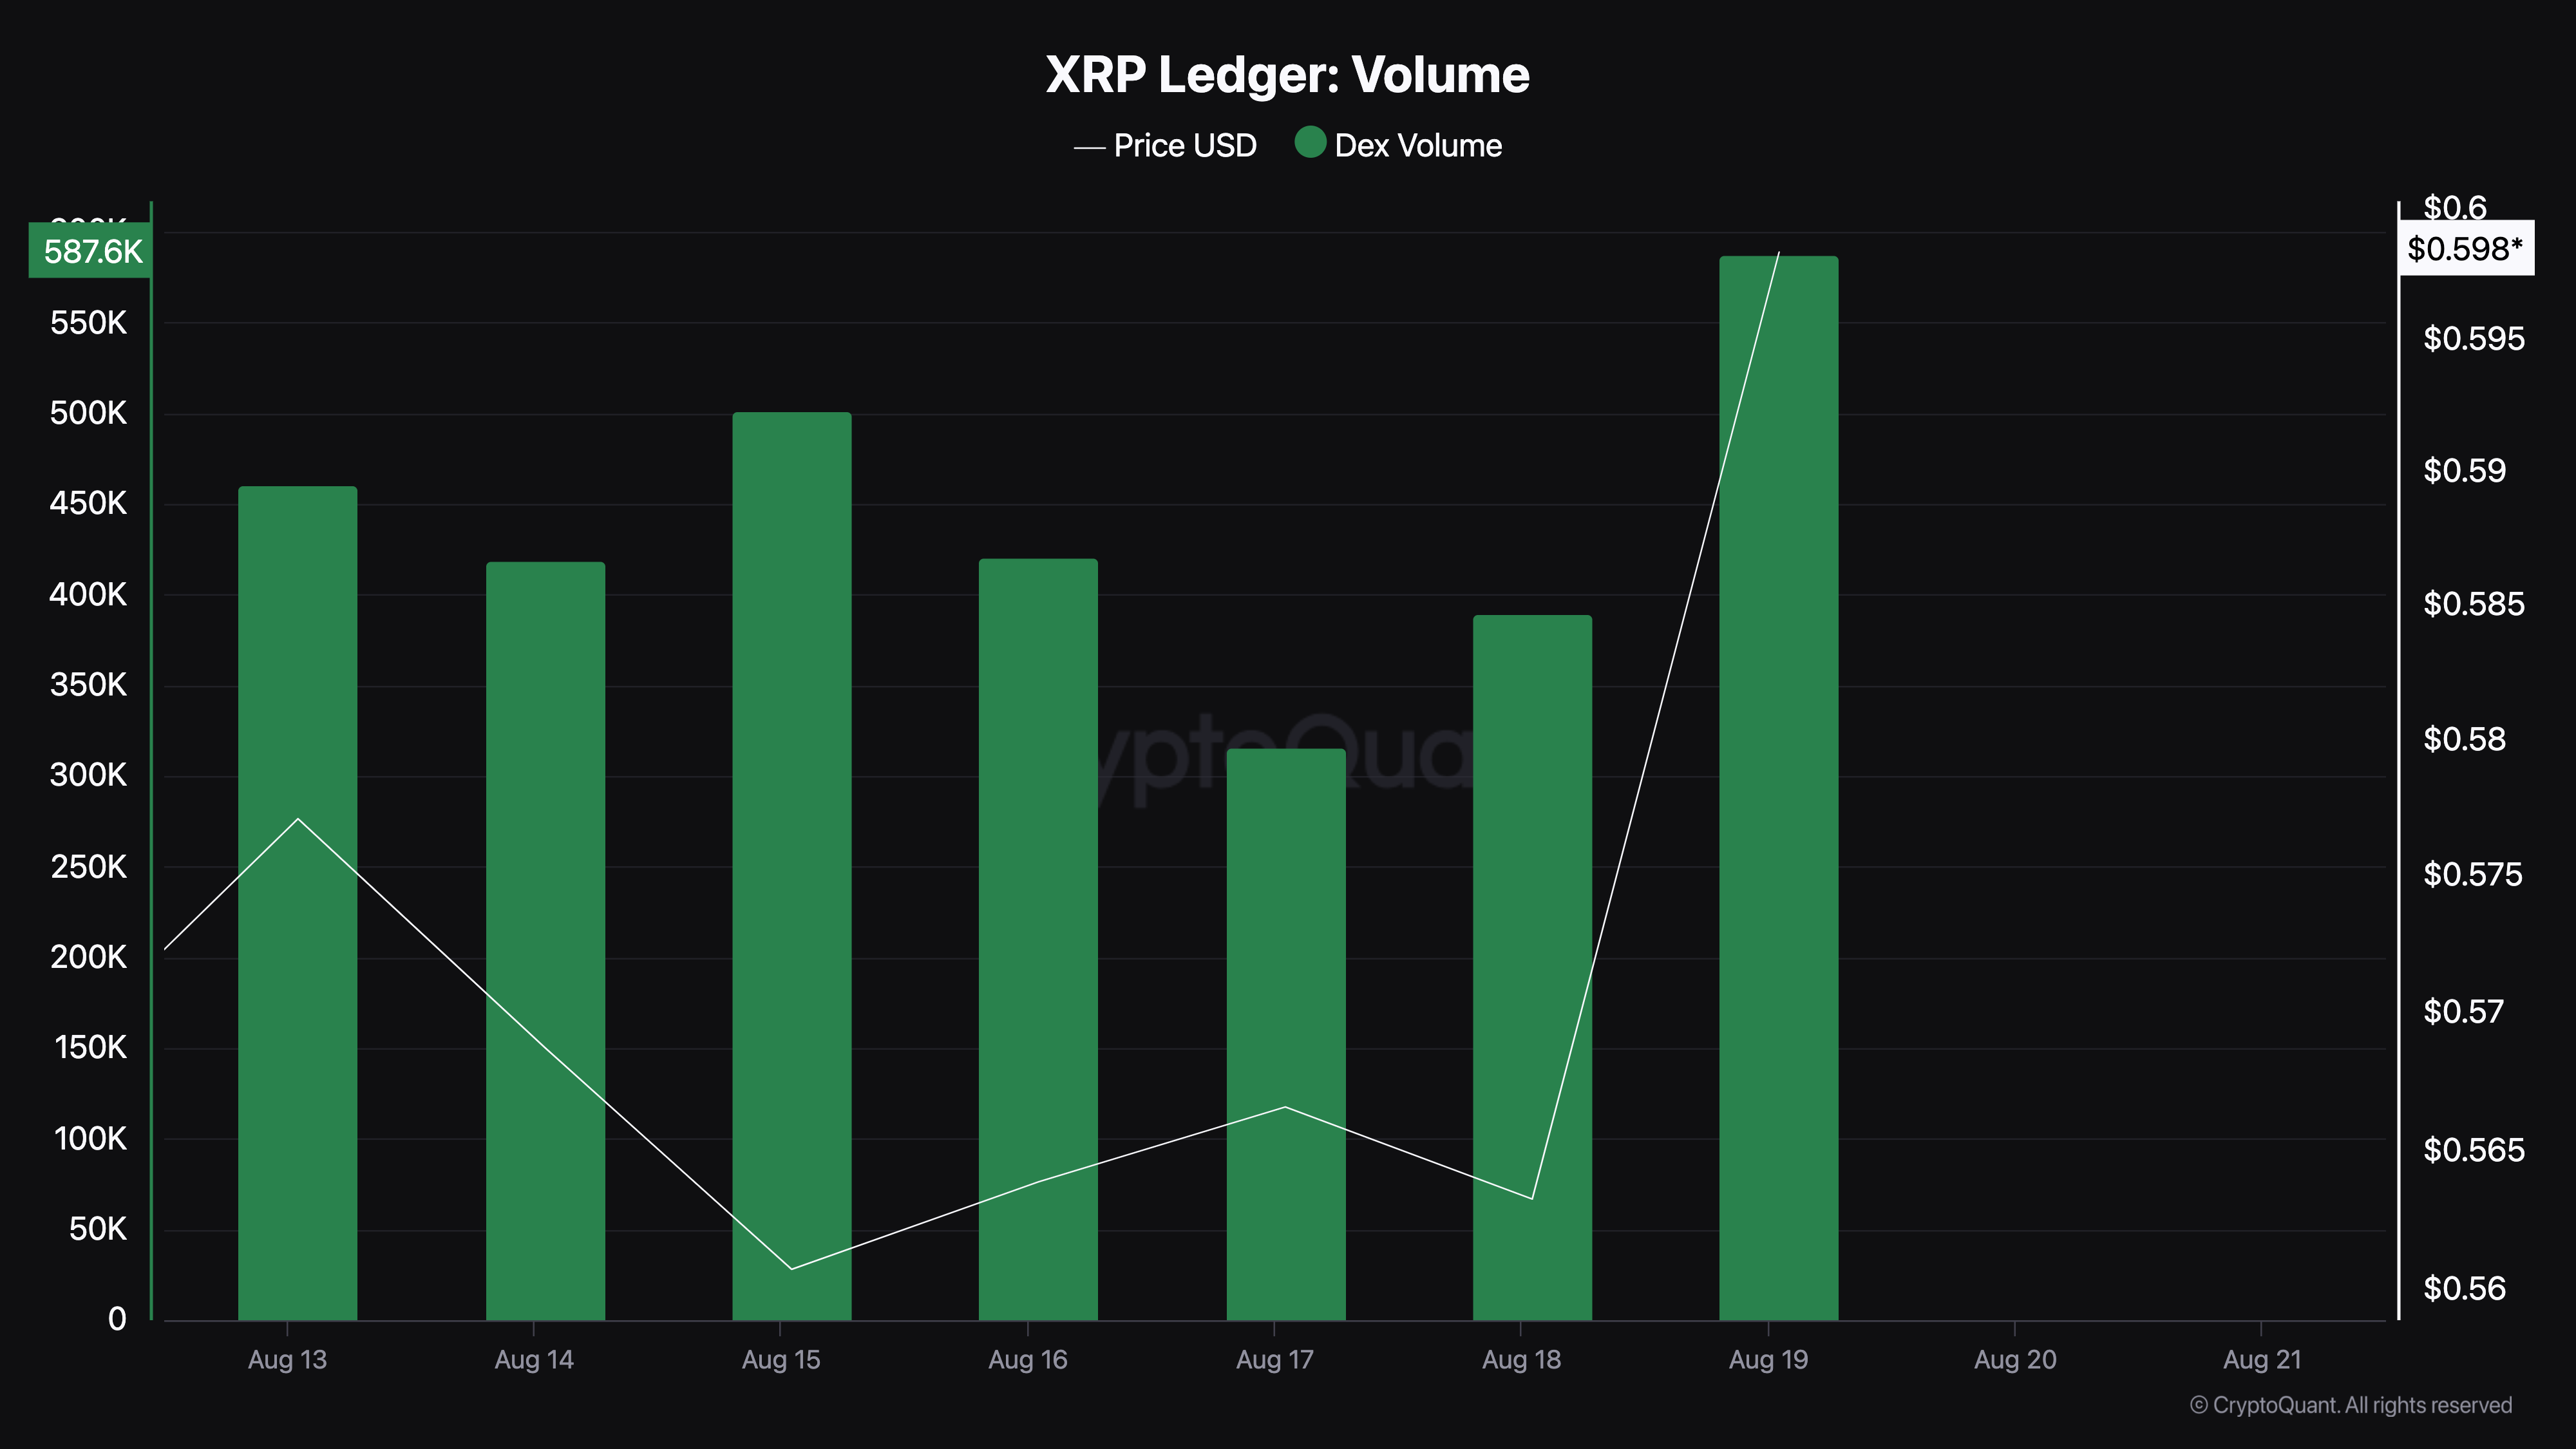
If the volume falls, there is a high chance that the price of the token involved may not be stable, possibly undergoing a downtrend. Therefore, the surging volume is a bullish sign for the token, and if the increase continues, so will XRP’s price.
XRP Price Prediction: This Crypto Wants $0.65 Again
Moving on, XRP’s price upswing may remain intact according to signals from the Parabolic Stop And Reverse (SAR) indicator. The Parabolic SAR is a technical indicator that works well in detecting trends and reversal.
For context, if the dotted lines of the indicator are above the price, the uptrend is weak, and a downturn could be next. However, for Ripple’s native token, the indicator is below the price, suggesting that the upswing may continue.
Apart from this, XRP price trades above the 20 (blue) and 50 (yellow) EMAs. This indicator, which stands for Exponential Moving Average, measures trend direction. Since the token’s price is above it, the trend is bullish.
Read more: Ripple (XRP) Price Prediction 2024/2025/2030
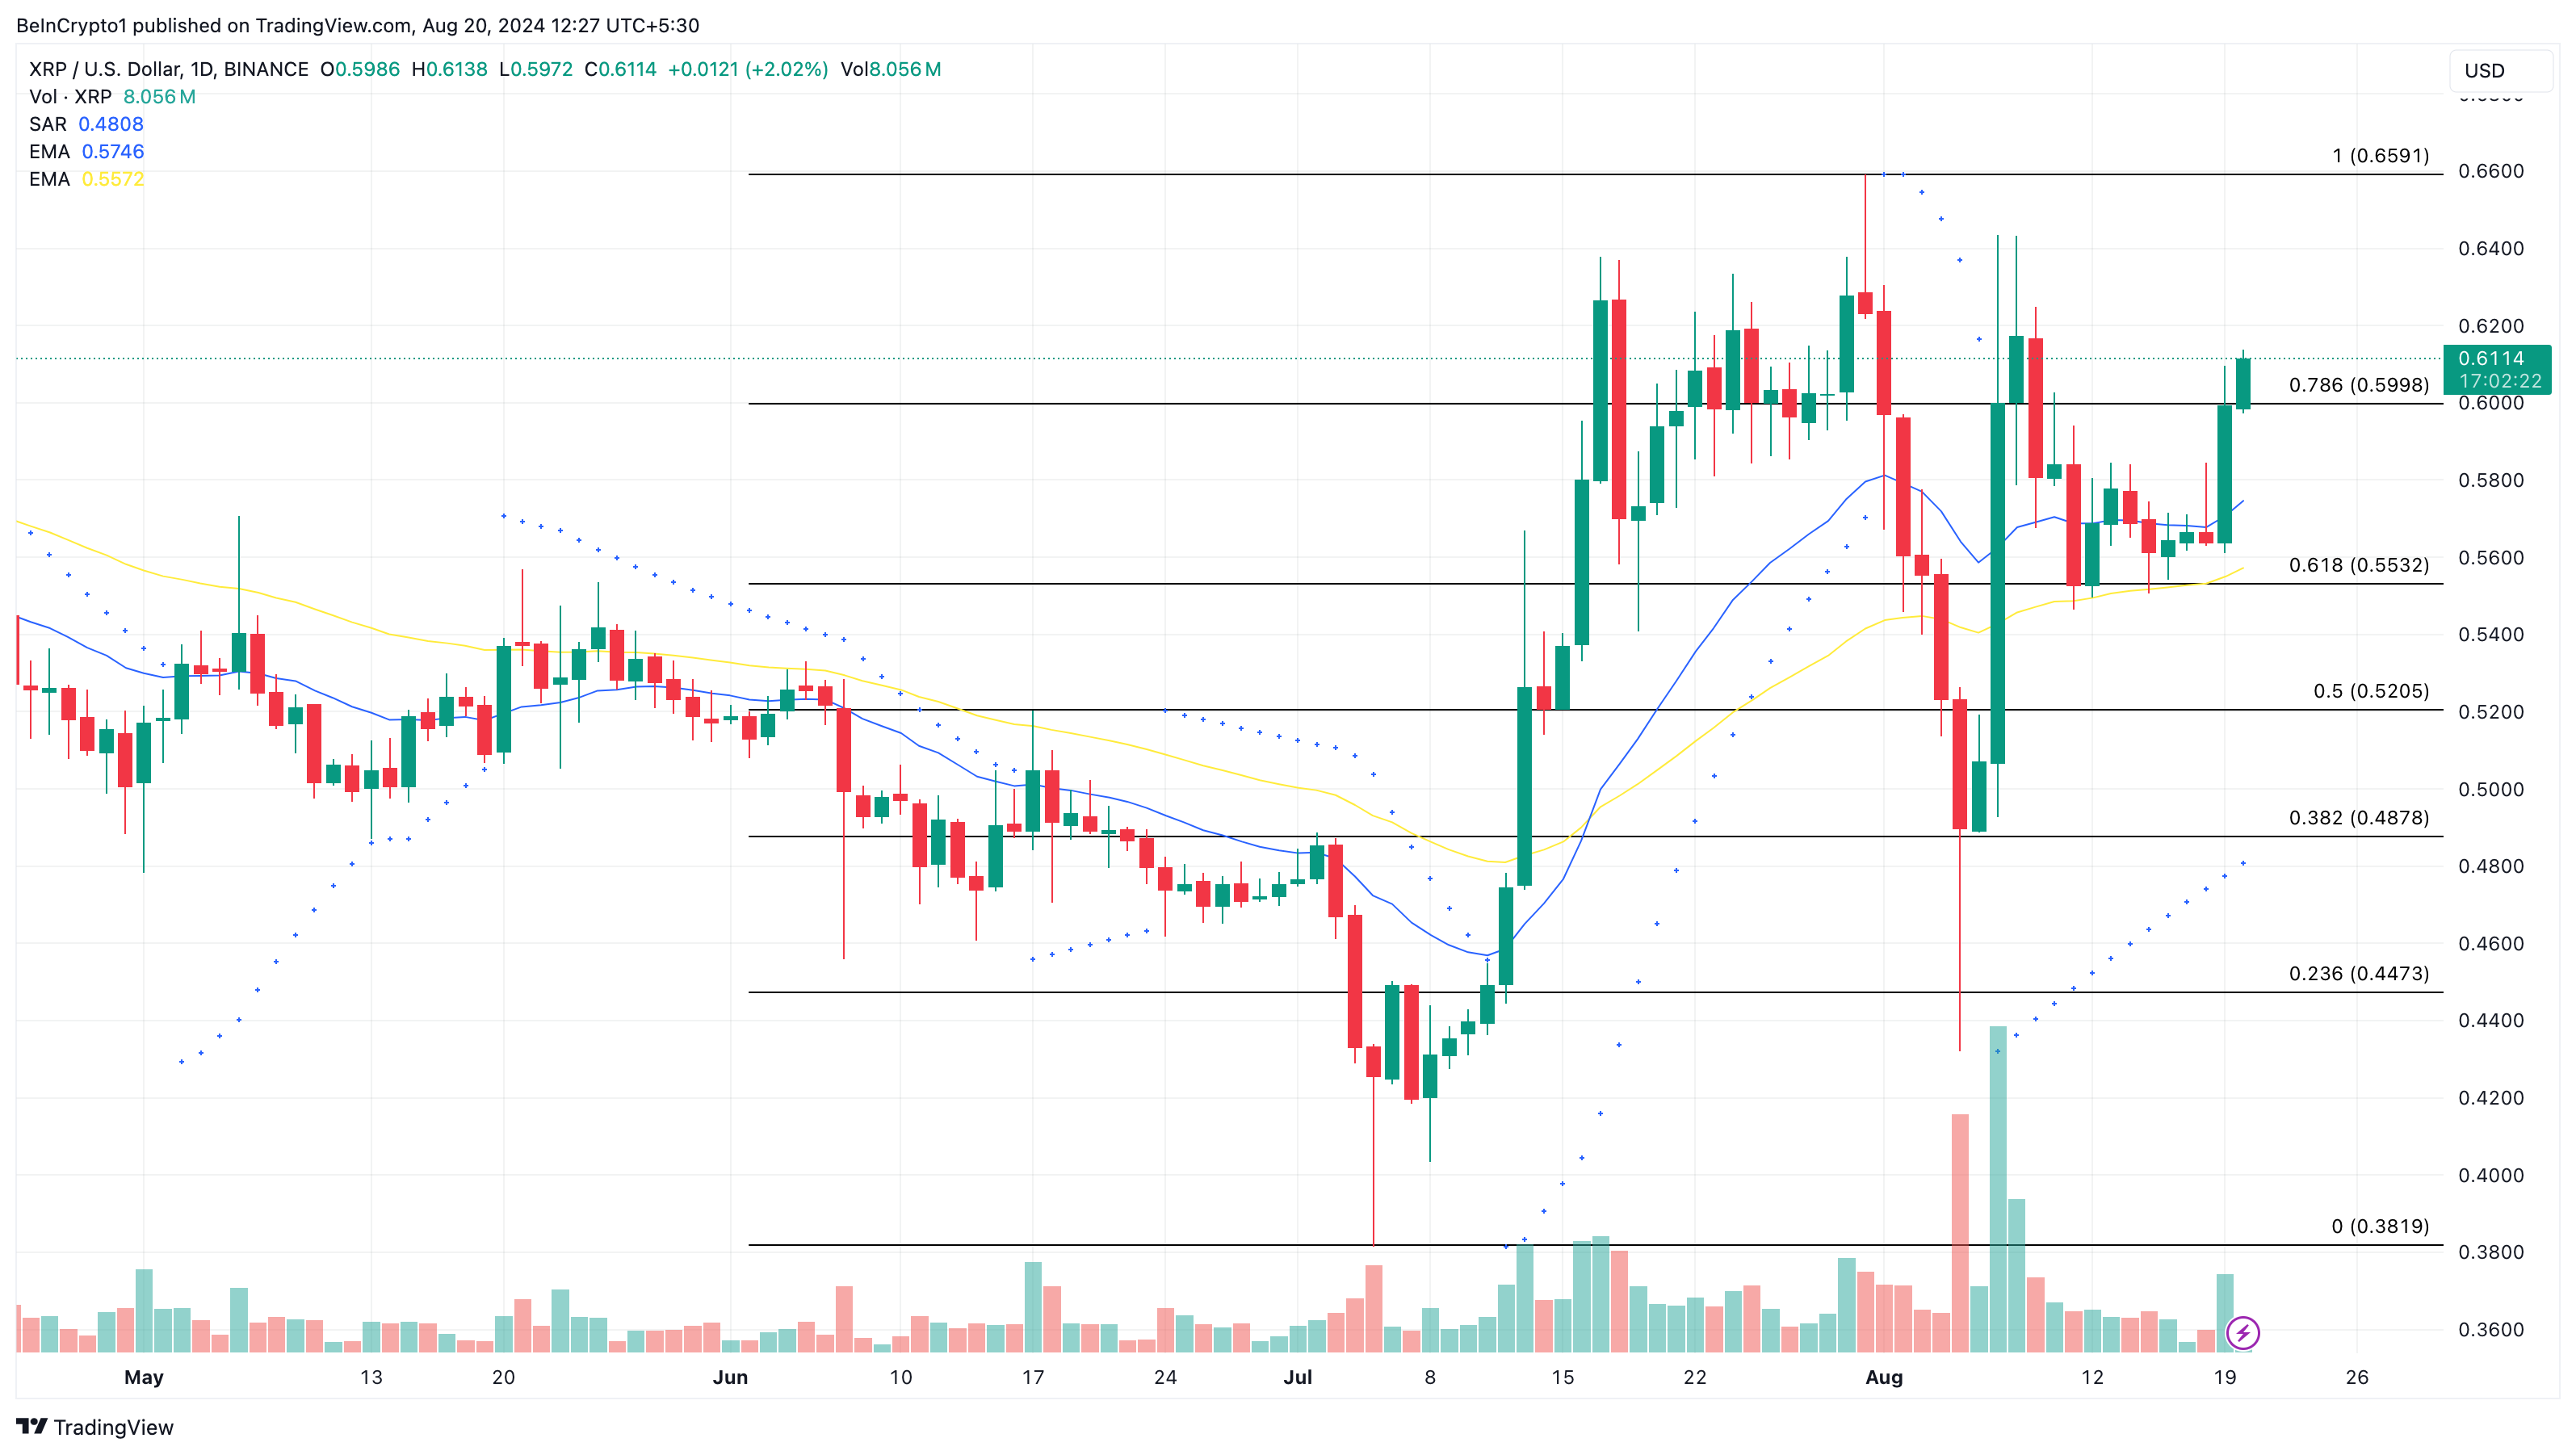
If it were below the indicators, then the trend would have been deemed bearish. Meanwhile, a look at the Fibonacci retracement indicators shows that if the rally continues, XRP’s price could hit $0.65.
However, if demand for the token drops or whales begin to transfer their assets to CEXes, this optimistic thesis might be invalidated. Should this be the case, the price could drop to $0.59. In a highly bearish scenario, XRP could slide to $0.55.
Disclaimer
In line with the Trust Project guidelines, this price analysis article is for informational purposes only and should not be considered financial or investment advice. BeInCrypto is committed to accurate, unbiased reporting, but market conditions are subject to change without notice. Always conduct your own research and consult with a professional before making any financial decisions. Please note that our Terms and Conditions, Privacy Policy, and Disclaimers have been updated.


Reason to trust
![]()
Strict editorial policy that focuses on accuracy, relevance, and impartiality
Created by industry experts and meticulously reviewed
The highest standards in reporting and publishing
Strict editorial policy that focuses on accuracy, relevance, and impartiality
Morbi pretium leo et nisl aliquam mollis. Quisque arcu lorem, ultricies quis pellentesque nec, ullamcorper eu odio.
Bitcoin price started a fresh increase above the $80,000 zone. BTC is now consolidating gains and might correct some to test the $80,500 zone.
- Bitcoin started a fresh increase above the $80,000 zone.
- The price is trading above $80,500 and the 100 hourly Simple moving average.
- There was a break above a key bearish trend line with resistance at $78,800 on the hourly chart of the BTC/USD pair (data feed from Kraken).
- The pair could start another increase if it clears the $83,500 zone.
Bitcoin Price Jumps Over 5%
Bitcoin price started a fresh increase from the $74,500 zone. BTC formed a base and gained pace for a move above the $78,500 and $80,000 resistance levels.
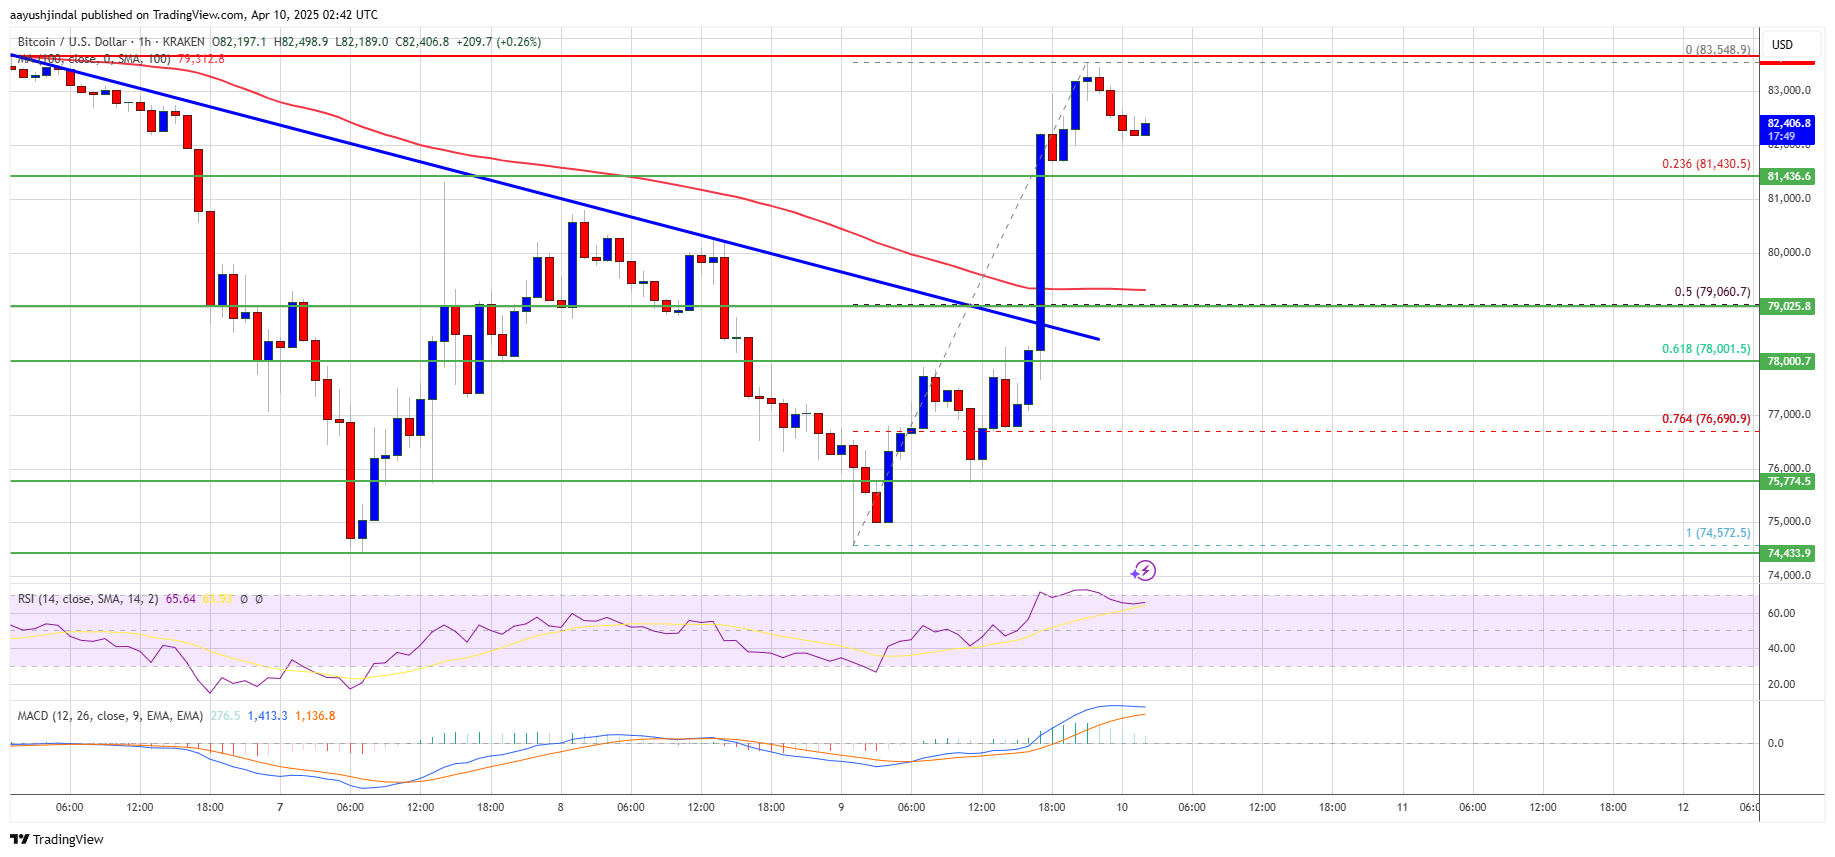
The bulls pumped the price above the $80,500 resistance. There was a break above a key bearish trend line with resistance at $78,800 on the hourly chart of the BTC/USD pair. The pair even cleared the $82,500 resistance zone. A high was formed at $83,548 and the price is now consolidating gains above the 23.6% Fib retracement level of the upward move from the $74,572 swing low to the $83,548 high.
Bitcoin price is now trading above $80,200 and the 100 hourly Simple moving average. On the upside, immediate resistance is near the $83,200 level. The first key resistance is near the $83,500 level.
The next key resistance could be $84,500. A close above the $84,500 resistance might send the price further higher. In the stated case, the price could rise and test the $85,800 resistance level. Any more gains might send the price toward the $88,000 level.
Are Dips Supported In BTC?
If Bitcoin fails to rise above the $83,500 resistance zone, it could start a downside correction. Immediate support on the downside is near the $81,400 level. The first major support is near the $80,500 level.
The next support is now near the $79,500 zone or the 50% Fib retracement level of the upward move from the $74,572 swing low to the $83,548 high. Any more losses might send the price toward the $78,000 support in the near term. The main support sits at $75,000.
Technical indicators:
Hourly MACD – The MACD is now gaining pace in the bullish zone.
Hourly RSI (Relative Strength Index) – The RSI for BTC/USD is now above the 50 level.
Major Support Levels – $81,400, followed by $80,500.
Major Resistance Levels – $83,500 and $84,500.

Bitget (BGB), Cronos (CRO), and 1INCH are three of the top exchange tokens to watch in April 2025. BGB is down 4% this week after a massive rally in late 2024, while CRO has dropped nearly 10% amid broader market weakness tied to the tariff war.
1INCH has also fallen over 5%, impacted by Ethereum’s continued decline. Despite the pullbacks, each token has key catalysts ahead that could drive a reversal—or deepen the correction.
Bitget (BGB)
BGB token has drawn significant attention in recent months, rallying 434% between December 1 and December 27, 2024.
However, after reaching that peak, momentum began to cool, and the token is now down 12% over the last seven days. This pullback comes as traders reassess the token’s near-term potential following its explosive run.
Despite that correction, Bitget Token continues to be one of the biggest exchange tokens in the market, with a market cap of $4.8 billion.

In Q1 2025, Bitget burned 30 million BGB tokens, following a much larger 800 million burn in late 2024—cutting total supply by 40% in a move aimed at boosting long-term value through deflation. BGB has also expanded its utility, now supporting multi-chain gas fees and real-world payments, pushing its use cases beyond the Bitget ecosystem.
If the current correction reverses, Bitget Token could test resistance at $4.40, with a potential push to $4.69 if broken.
Conversely, if the selloff deepens, support around $3.72 could be tested, and a break below that would mark the token’s first drop beneath $3.70 since December 2024.
Cronos (CRO)
CRO, Crypto.com’s native token, is down nearly 22% over the past seven days, making it one of the worst performers among major exchange tokens this week.
The decline comes as broader crypto markets react sharply to the escalating tariff war, which has triggered a wave of risk-off sentiment across both traditional and digital assets.
Crypto.com had ambitious plans for 2025, including talk of a potential CRO ETF, but with market conditions deteriorating, the viability of these milestones remains uncertain.
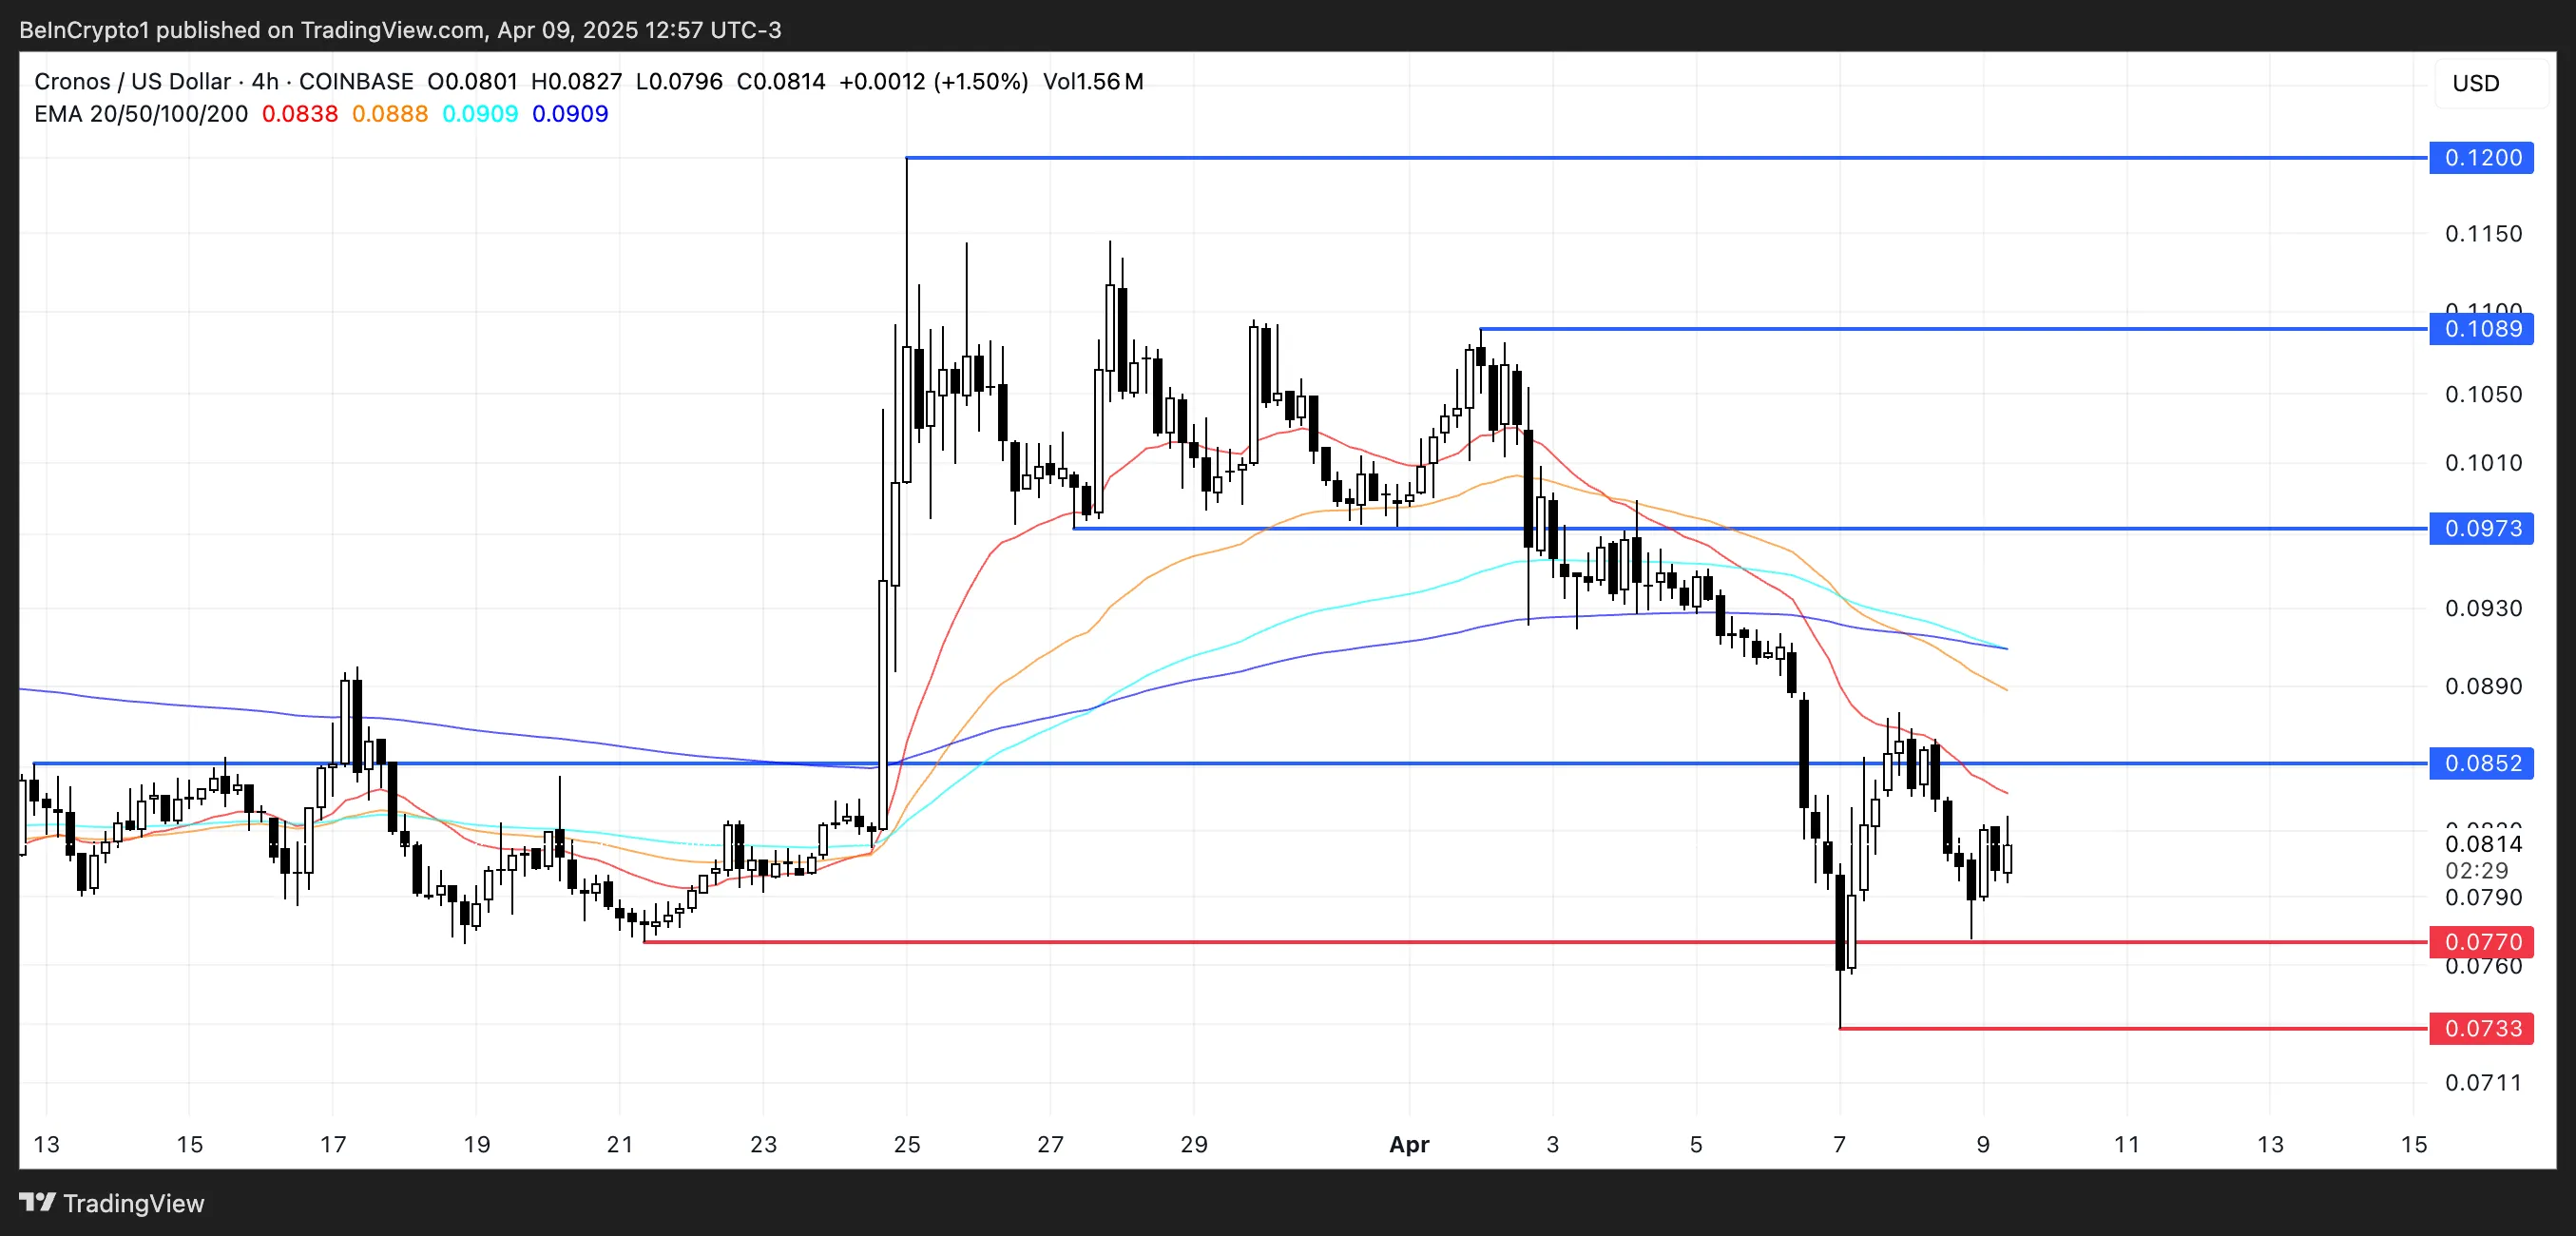
Technically, Cronos’ EMA lines have formed two death crosses in recent days—a strong bearish signal. If the downtrend persists, CRO could fall to test support at $0.077, and if that level breaks, drop further to $0.073.
However, if market sentiment rebounds—especially if boosted by Crypto.com’s partnership with Trump Media—CRO could recover sharply, making it one of the most relevant exchange tokens in the market.
Key upside targets include $0.085, followed by $0.097, $0.108, and potentially $0.12 if bullish momentum strengthens.
1INCH
1INCH remains one of the most important DEX aggregators in the crypto space, even as it operates at a much smaller scale compared to rivals like Jupiter, which sees roughly five times more trading volume.
It also faces rising competition from newer players like CoWSwap, putting pressure on its dominance in the sector.
Despite its strong fundamentals and reputation, 1INCH has seen its token price drop more than 17% over the last seven days, bringing its market cap down to $221 million.

The ongoing downturn in the Ethereum ecosystem, with ETH now trading below $1,500 and at risk of dropping toward $1,000, has had a significant impact on aggregators like 1INCH.
If the correction deepens, 1INCH could test support near $0.148.
However, a rebound in Ethereum activity could quickly reverse the trend, potentially pushing 1INCH to retest resistance at $0.177 and, if broken, rally toward $0.198 and even $0.22.
Disclaimer
In line with the Trust Project guidelines, this price analysis article is for informational purposes only and should not be considered financial or investment advice. BeInCrypto is committed to accurate, unbiased reporting, but market conditions are subject to change without notice. Always conduct your own research and consult with a professional before making any financial decisions. Please note that our Terms and Conditions, Privacy Policy, and Disclaimers have been updated.

Solana (SOL) has recovered over 12% today after Trump announced a 90-day pause on tariffs. Despite the significant recovery, technical indicators continue flashing bearish warnings. Key indicators like the RSI, BBTrend, and EMA lines all point to weakening momentum and a lack of buyer conviction. While oversold conditions have started to stabilize, the broader structure still leans slightly in favor of sellers.
Solana RSI Shows The Lack Of Conviction Among Buyers
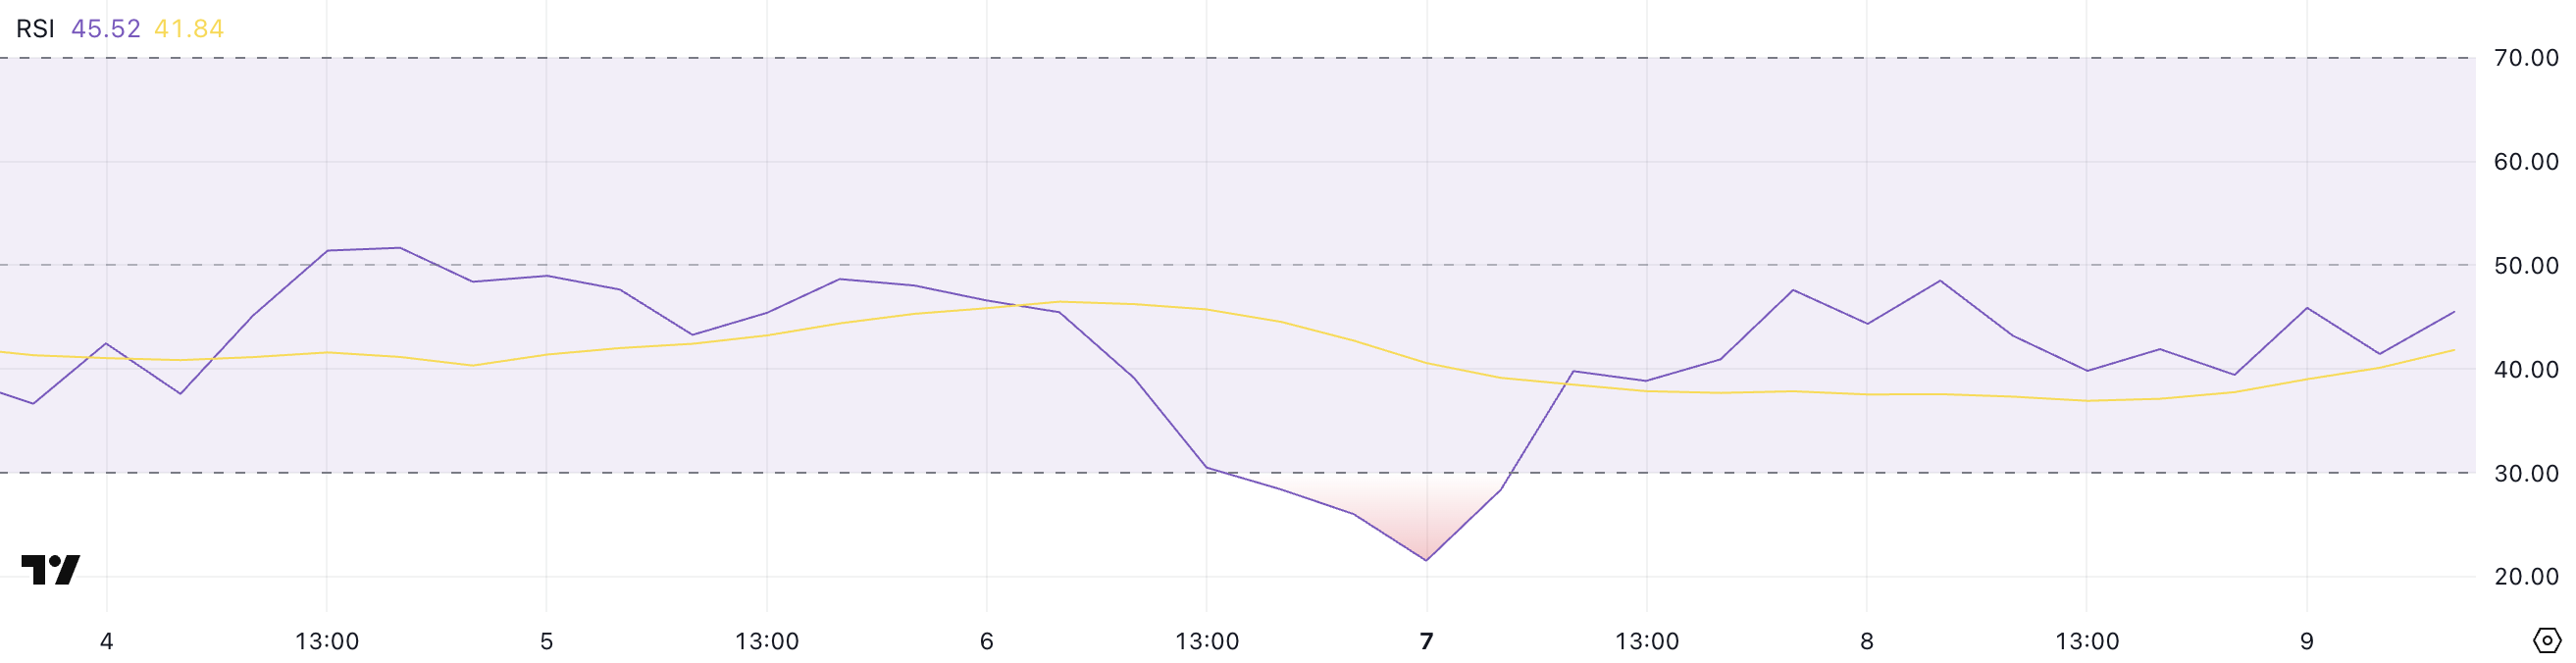
Solana’s Relative Strength Index (RSI) is currently sitting at 45.52, hovering in neutral territory but remaining below the midline of 50 for nearly two days.
This comes after the RSI briefly dipped to an oversold level of 21.53 two days ago, indicating that sellers had briefly dominated before demand began to stabilize.
The RSI’s slow climb back toward neutral suggests that while extreme selling pressure has eased, bullish momentum has not yet taken control.
The RSI is a momentum oscillator that measures the speed and magnitude of recent price movements. It typically ranges from 0 to 100.
Readings above 70 are generally interpreted as overbought, signaling the potential for a pullback, while readings below 30 suggest oversold conditions and potential for a rebound.
Solana’s RSI at 45.52 indicates that the asset is in a recovery phase but lacks conviction. If the RSI fails to cross above 50 soon, it could imply continued hesitation among buyers and the potential for sideways price action or even another leg lower.
SOL BBTrend Has Reached Its Lowest Levels In Almost A Month
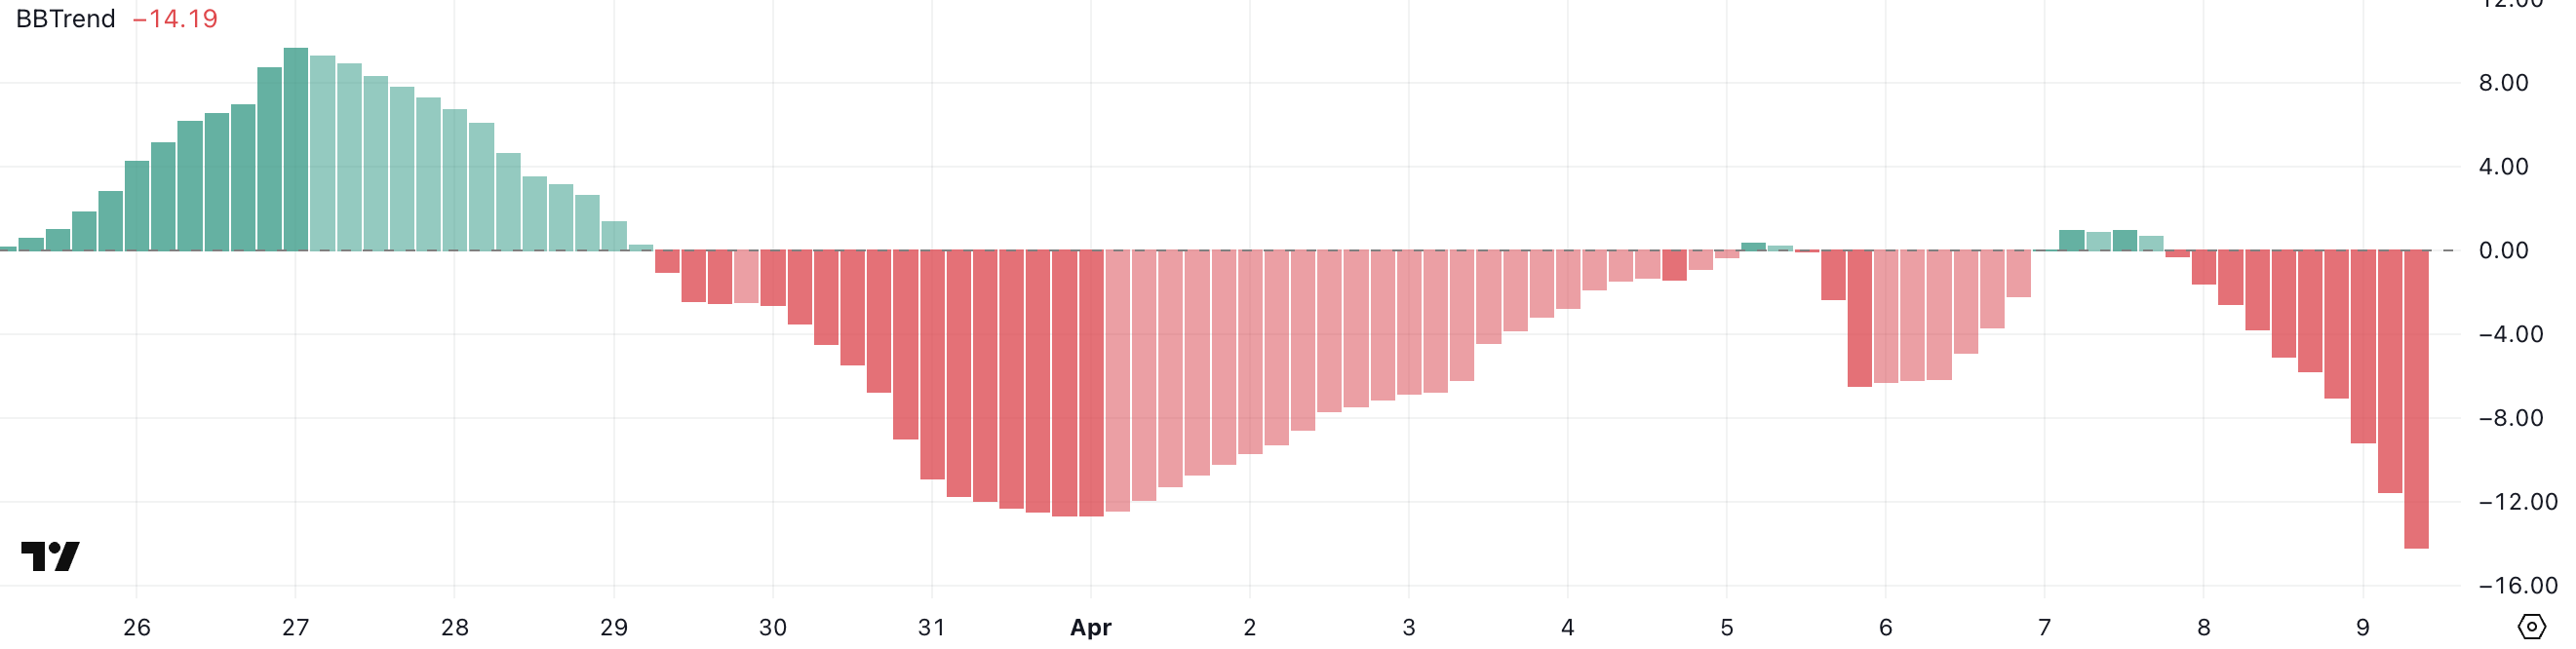
Solana’s BBTrend indicator is currently at -14.19, having turned negative since yesterday, and is at its lowest level since March 13—nearly a month ago.
This shift into deeper negative territory suggests that bearish momentum is building once again after a period of relative stability.
The return to these levels may indicate growing downside pressure, especially if follow-through selling continues in the short term.
The BBTrend (Bollinger Band Trend) is a volatility-based indicator that measures the strength and direction of a price trend using the distance between price and Bollinger Bands.
Positive BBTrend values generally reflect bullish momentum, while negative values signal bearish momentum. The deeper the reading into negative territory, the stronger the downward pressure is considered to be.
Solana’s BBTrend is now at -14.19, implying an intensifying bearish phase, which could mean further price declines unless sentiment or volume shifts quickly in favor of buyers.
Will Solana Dip Below $100 Again In April?
Solana’s EMA setup continues to reflect a strong bearish structure, with short-term moving averages remaining well below long-term ones.
This alignment confirms that downward momentum is still in control, keeping sellers in a dominant position.
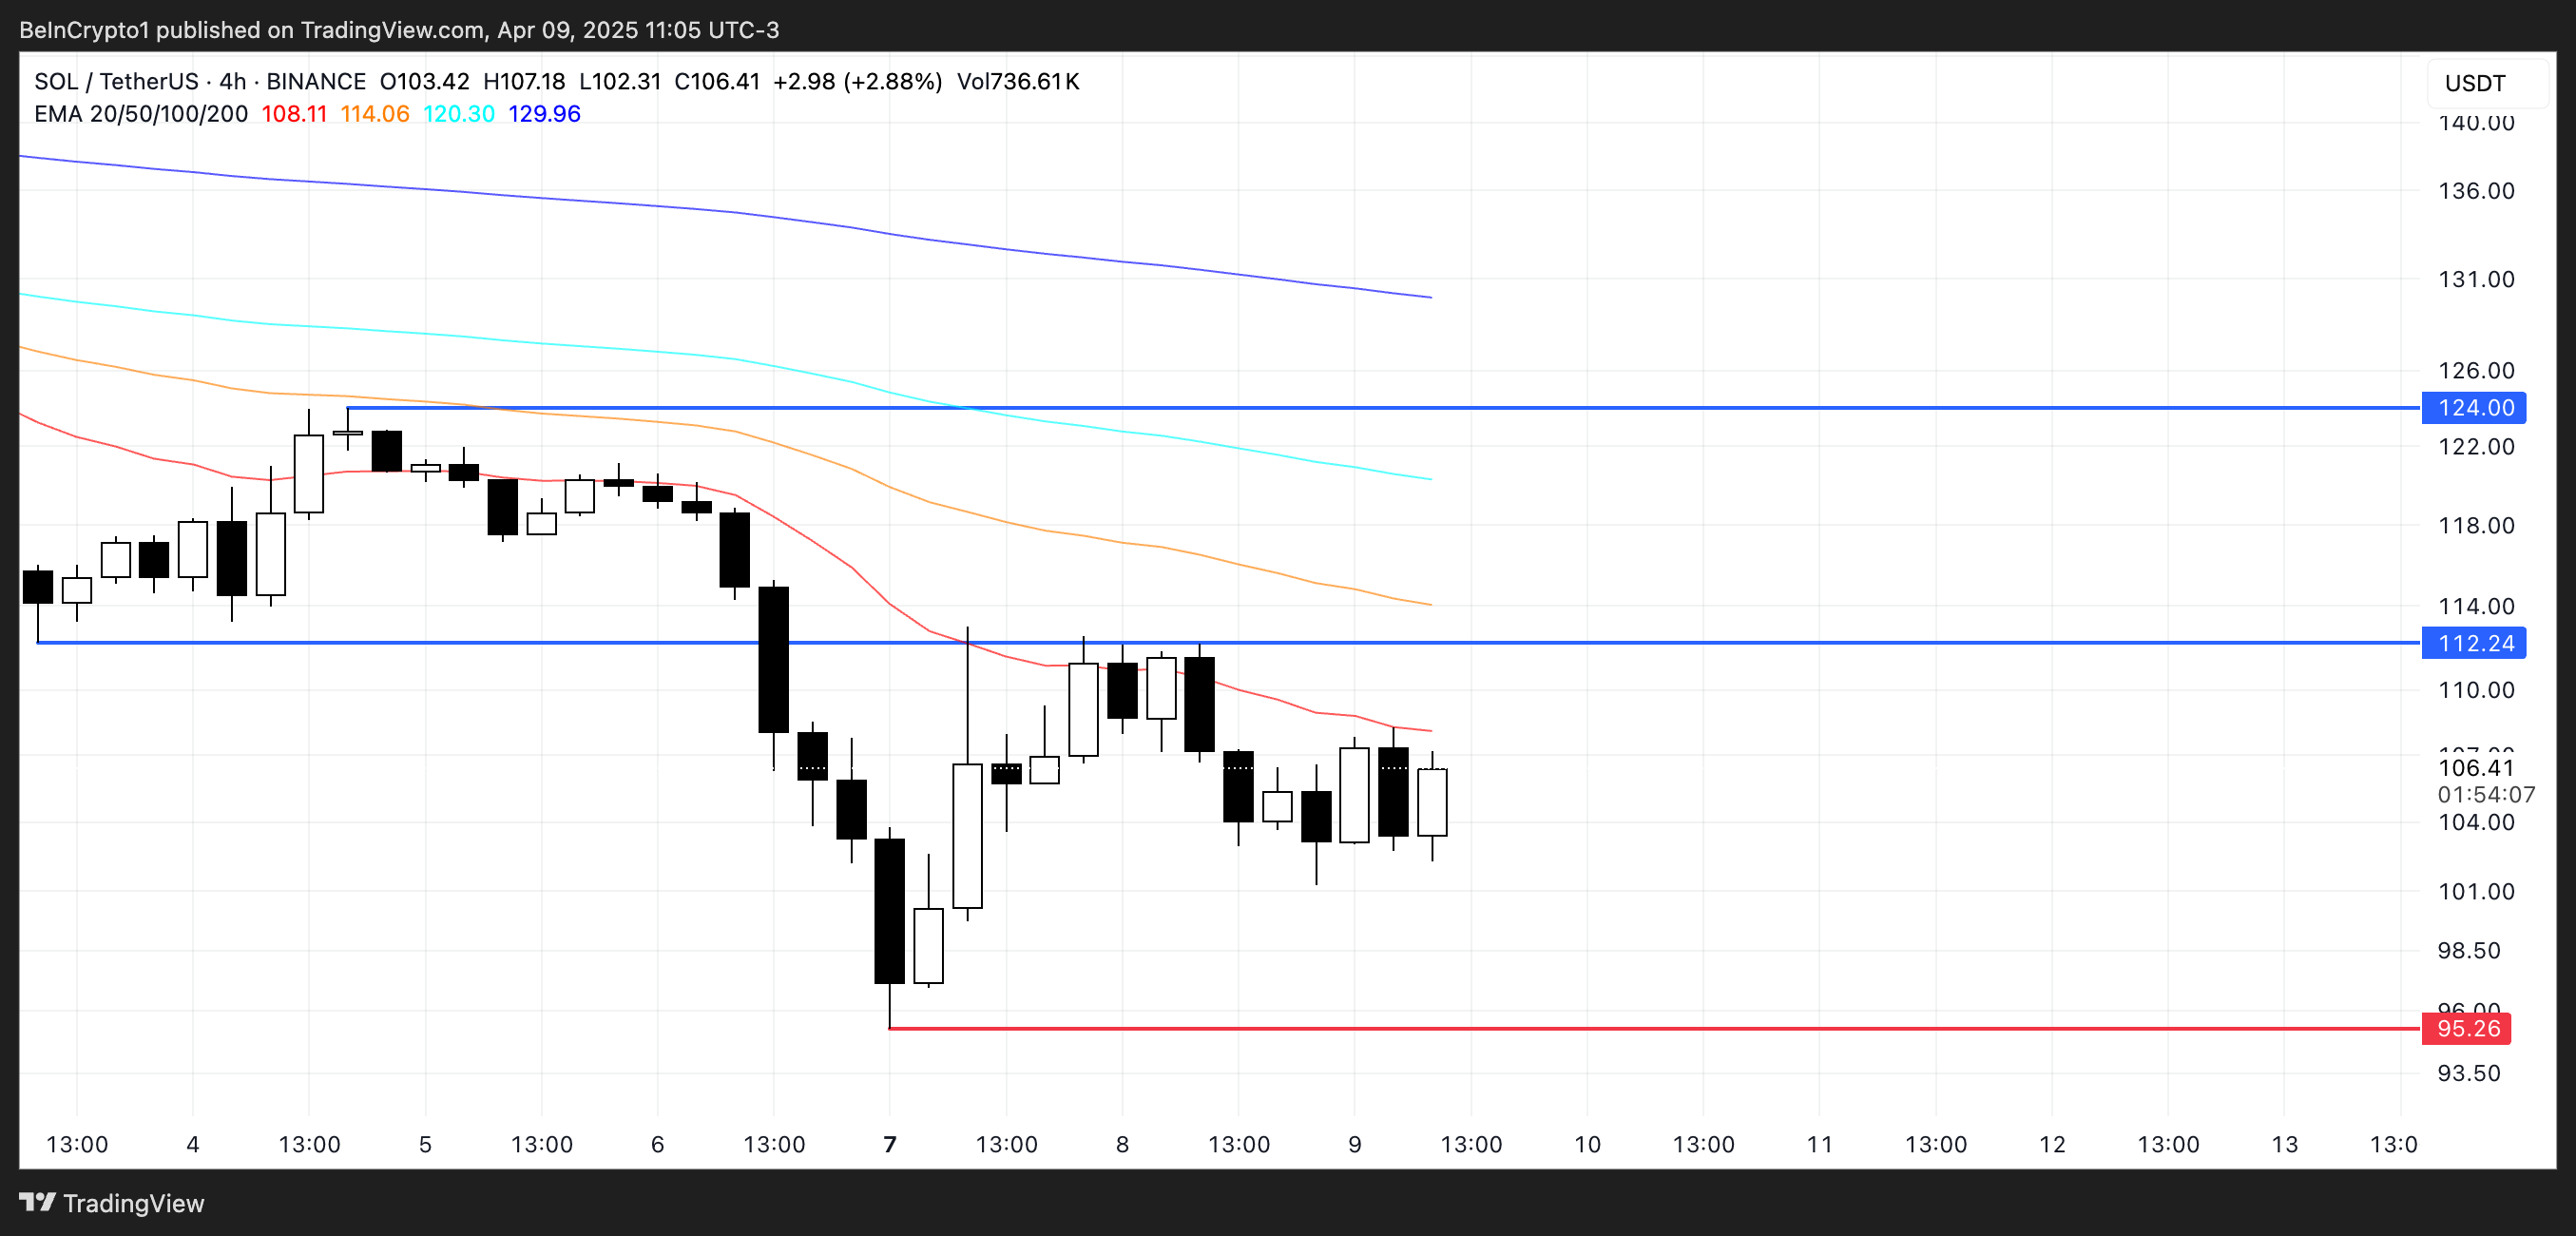
However, if Solana price manages to sustain the current strength and buying interest, it could test resistance at $120. A break above that level may open the path toward the next target at $134.
On the downside, if the current bearish trend persists, Solana could revisit support near $95, a level that has previously acted as a short-term floor.
Losing this level would be technically significant, potentially pushing SOL below $90—territory not seen since January 2024.
Disclaimer
In line with the Trust Project guidelines, this price analysis article is for informational purposes only and should not be considered financial or investment advice. BeInCrypto is committed to accurate, unbiased reporting, but market conditions are subject to change without notice. Always conduct your own research and consult with a professional before making any financial decisions. Please note that our Terms and Conditions, Privacy Policy, and Disclaimers have been updated.

Bitcoin Rallies After Trump Pauses Tariff—Crypto Markets Cheer the Move
Top 3 Exchange Tokens to Keep An Eye For April 2025

Argentina Opens LIBRA Investigation, Top Officials May Be Implicated

Solana (SOL) Drops 4% as Selling Pressure Intensifies

Paul Atkins Confirmed as SEC Chair, Crypto Rules to Ease
US Senate Confirms Pro-Crypto Paul Atkins As SEC Chair

2.52 Million Altcoins Are Ruining Crypto’s Future

Animoca Brands Valuation Tanks 75% In Two Years, Here’s Why

Crypto exchange BingX hacked for $43 million

Are The Big Players Losing Interest?

Hong Kong’s Securities Association Tips Authorities On Crypto Self-Regulation

Coinbase cbBTC Set to go Live on Solana
2.52 Million Altcoins Are Ruining Crypto’s Future
Animoca Brands Valuation Tanks 75% In Two Years, Here’s Why
Crypto exchange BingX hacked for $43 million
Are The Big Players Losing Interest?
Hong Kong’s Securities Association Tips Authorities On Crypto Self-Regulation
Coinbase cbBTC Set to go Live on Solana
-
 Bitcoin22 hours ago
How Trump’s Tariffs Threaten Bitcoin Mining in the US
-
 Altcoin21 hours ago
Shiba Inu Burn Rate Shoots Up 1500%, Can SHIB Price Recover After Bloodbath?
-

 Market19 hours ago
XRP Price Warning Signs Flash—Fresh Selloff May Be Around the Corner
-
 Altcoin18 hours ago
Binance To Delist These 7 Crypto Pairs Amid Market Turmoil, Are Prices At Risk?
-

 Market23 hours ago
Ethereum Price Hit Hard—10% Drop Sparks Selloff Fears
-
 Market22 hours ago
Fed Reverse Repo Facility Drains, Stealth Liquidity Injections Seen
-
 Market21 hours ago
Dogecoin (DOGE) at Risk of More Losses as Market Volatility Spikes
-
 Market20 hours ago
JasmyCoin Surge Defies “Dead Cat Bounce” Fears