
Market
Can the PEPE Meme Coin Rally Continue?

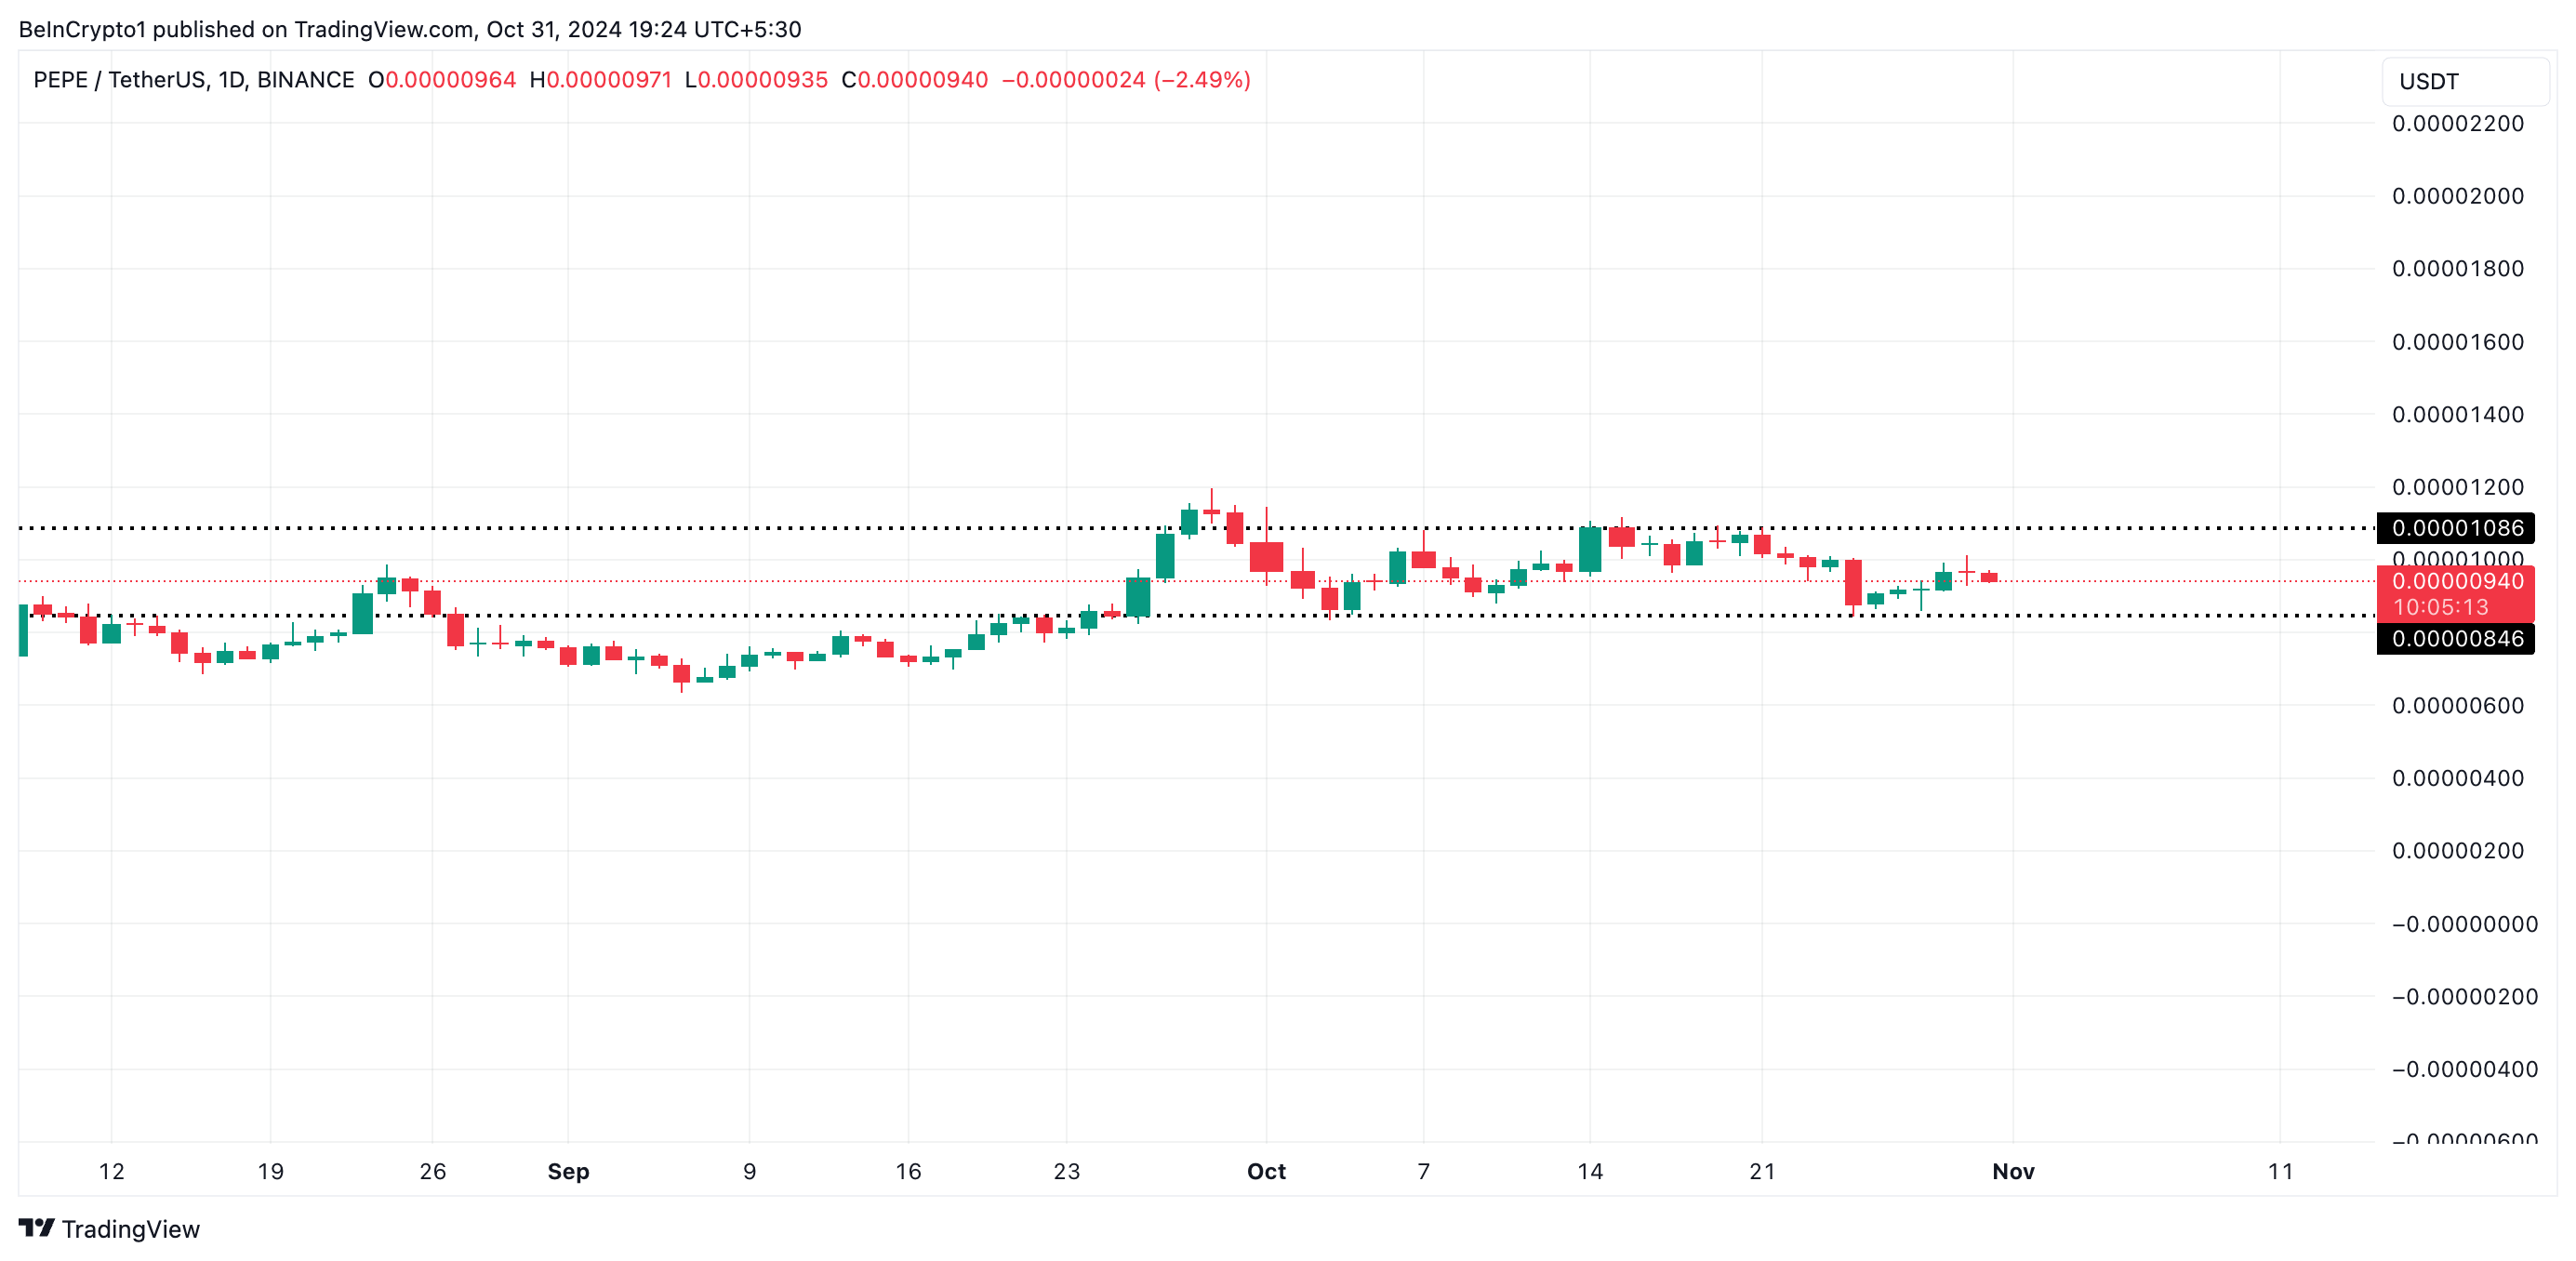
Pepe (PEPE), a popular meme coin, has been trading within a set range throughout October, encountering resistance at $0.000010 and finding support at $0.00000084.
With growing demand for meme coins, PEPE appears ready to break out of this range. Its price could potentially climb to a 60-day high of $0.000012.
Pepe Sees Spike in Demand
PEPE has traded within a horizontal channel since September 27. This channel is formed when an asset’s price moves within a range for some time. The upper line of this channel forms resistance, while the lower line represents support.
This sideways movement happens when a relative balance between buying and selling pressures prevents an asset’s price from trending strongly in either direction.
PEPE’s outlook is shifting, aligning with the recent surge in the broader meme coin market. Over the past week, activity in the meme coin sector has intensified, driving its market capitalization up by 19% to reach $63 billion — the highest level since June.
Read more: 5 Best Pepe (PEPE) Wallets for Beginners and Experienced Users
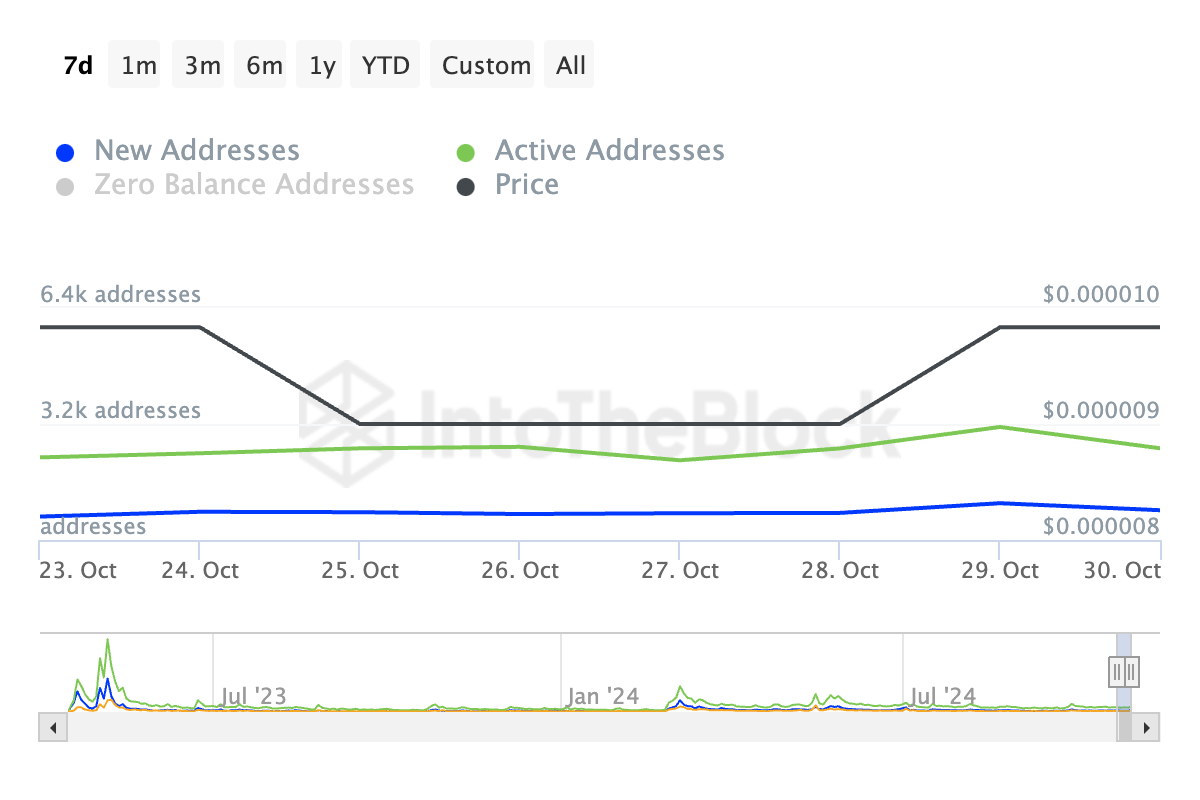
On-chain data highlights a sustained increase in demand fueling the PEPE meme coin rally. IntoTheBlock’s data shows a 27% spike in the daily count of new addresses that have traded the meme coin in the past seven days. Also, during the same period, the number of unique daily active addresses that have completed at least one transaction involving PEPE has increased by 11%.
When an asset’s price rises alongside an increase in daily active addresses (DAA) and new addresses, it often indicates growing network activity and user interest. A combined reading of PEPE’s rising price and active address count is a bullish signal that suggests a surge in interest in the meme coin.
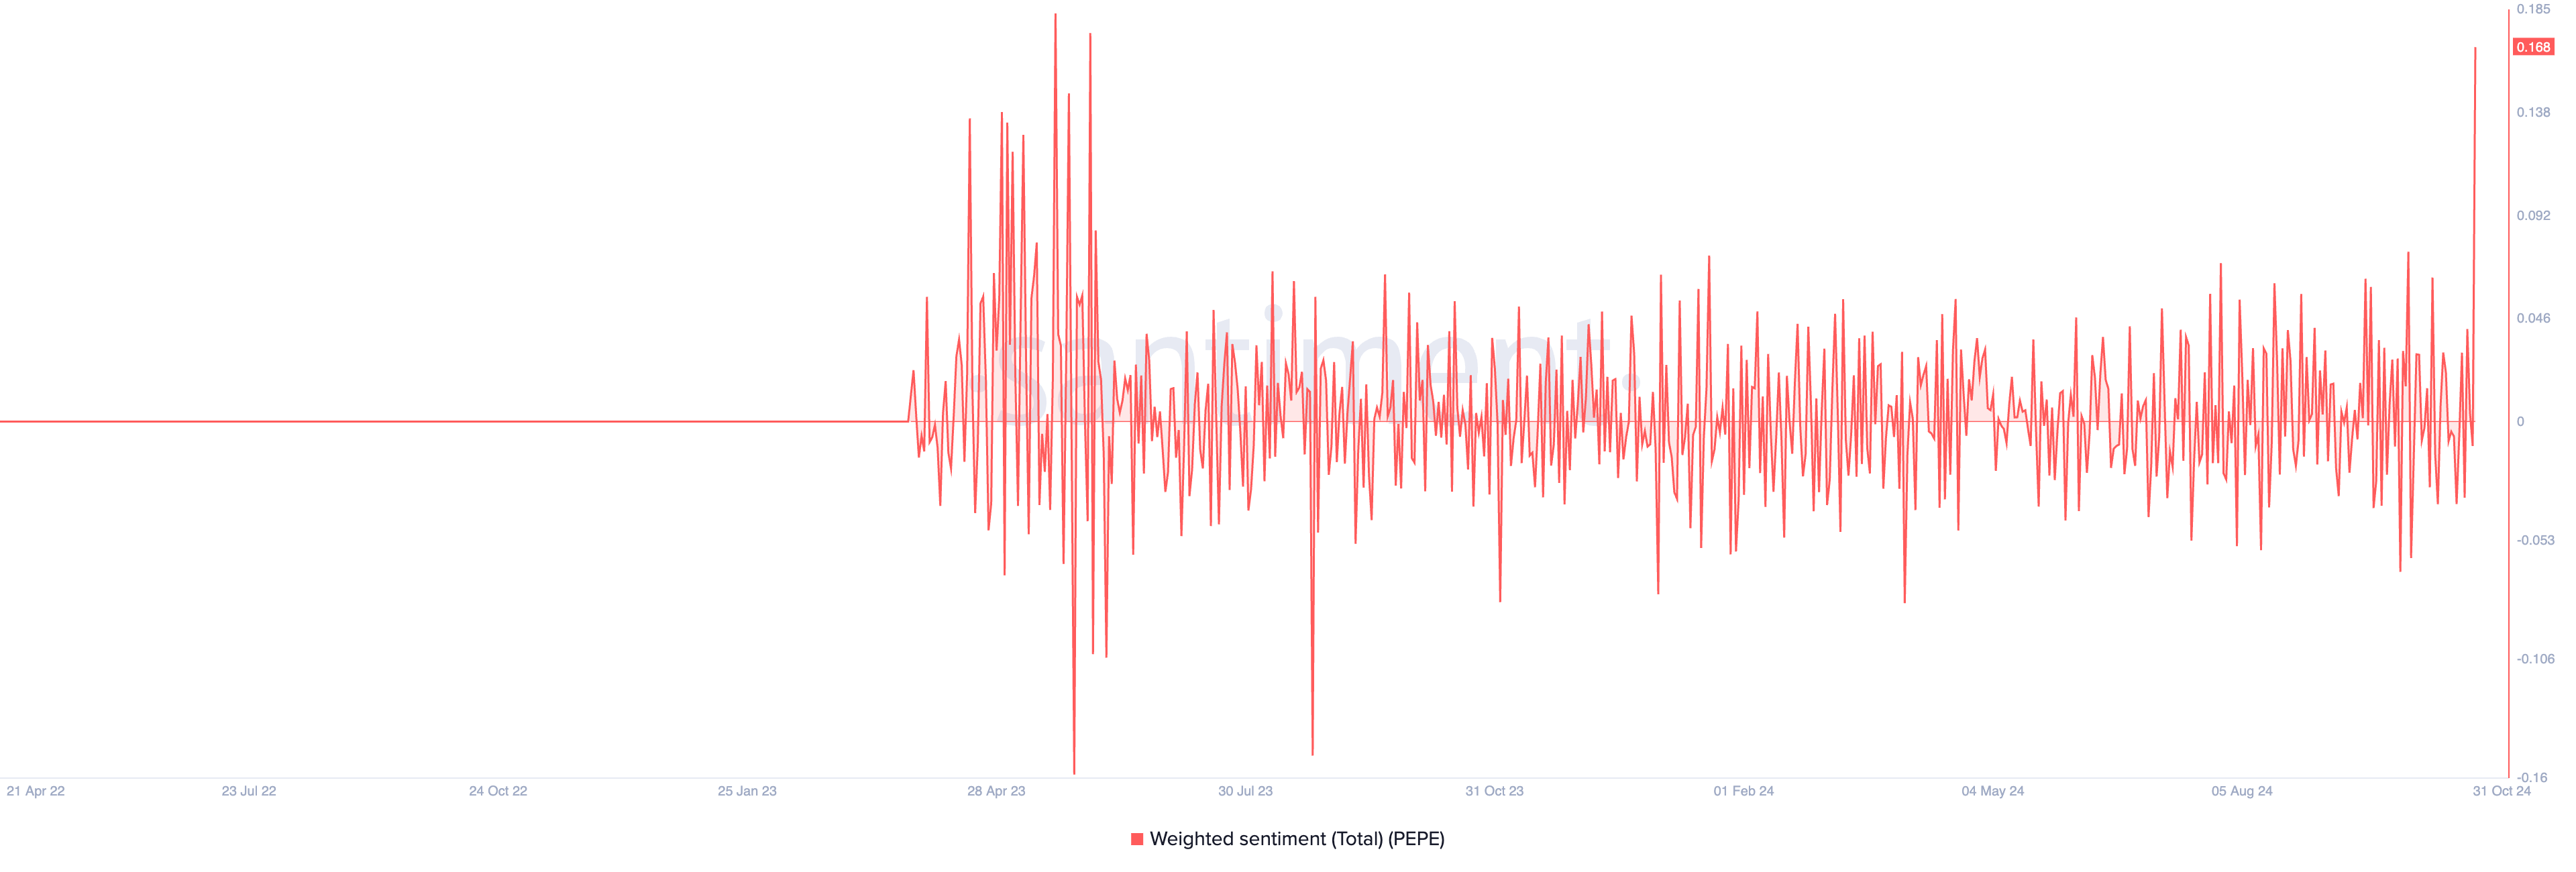
PEPE’s bullish outlook is further reinforced by its positive weighted sentiment, currently at 0.168 — its highest since May. Weighted sentiment measures the market’s overall mood, with values above zero indicating predominantly positive social media discussions. This positive sentiment suggests that market participants anticipate continued price growth.
PEPE Price Prediction: Where Meme Coin May Be Headed
At press time, PEPE trades at $0.0000094, edging closer to the upper boundary of its horizontal channel, a key resistance level. With rising demand for the meme coin, a breakout above this threshold could be imminent.
If it successfully turns the $0.000010 mark into support, it would set the stage for an uptrend toward its 60-day high of $0.000012, ensuring the continuation of the PEPE meme coin rally.
Read more: Pepe (PEPE) Price Prediction 2024/2025/2030
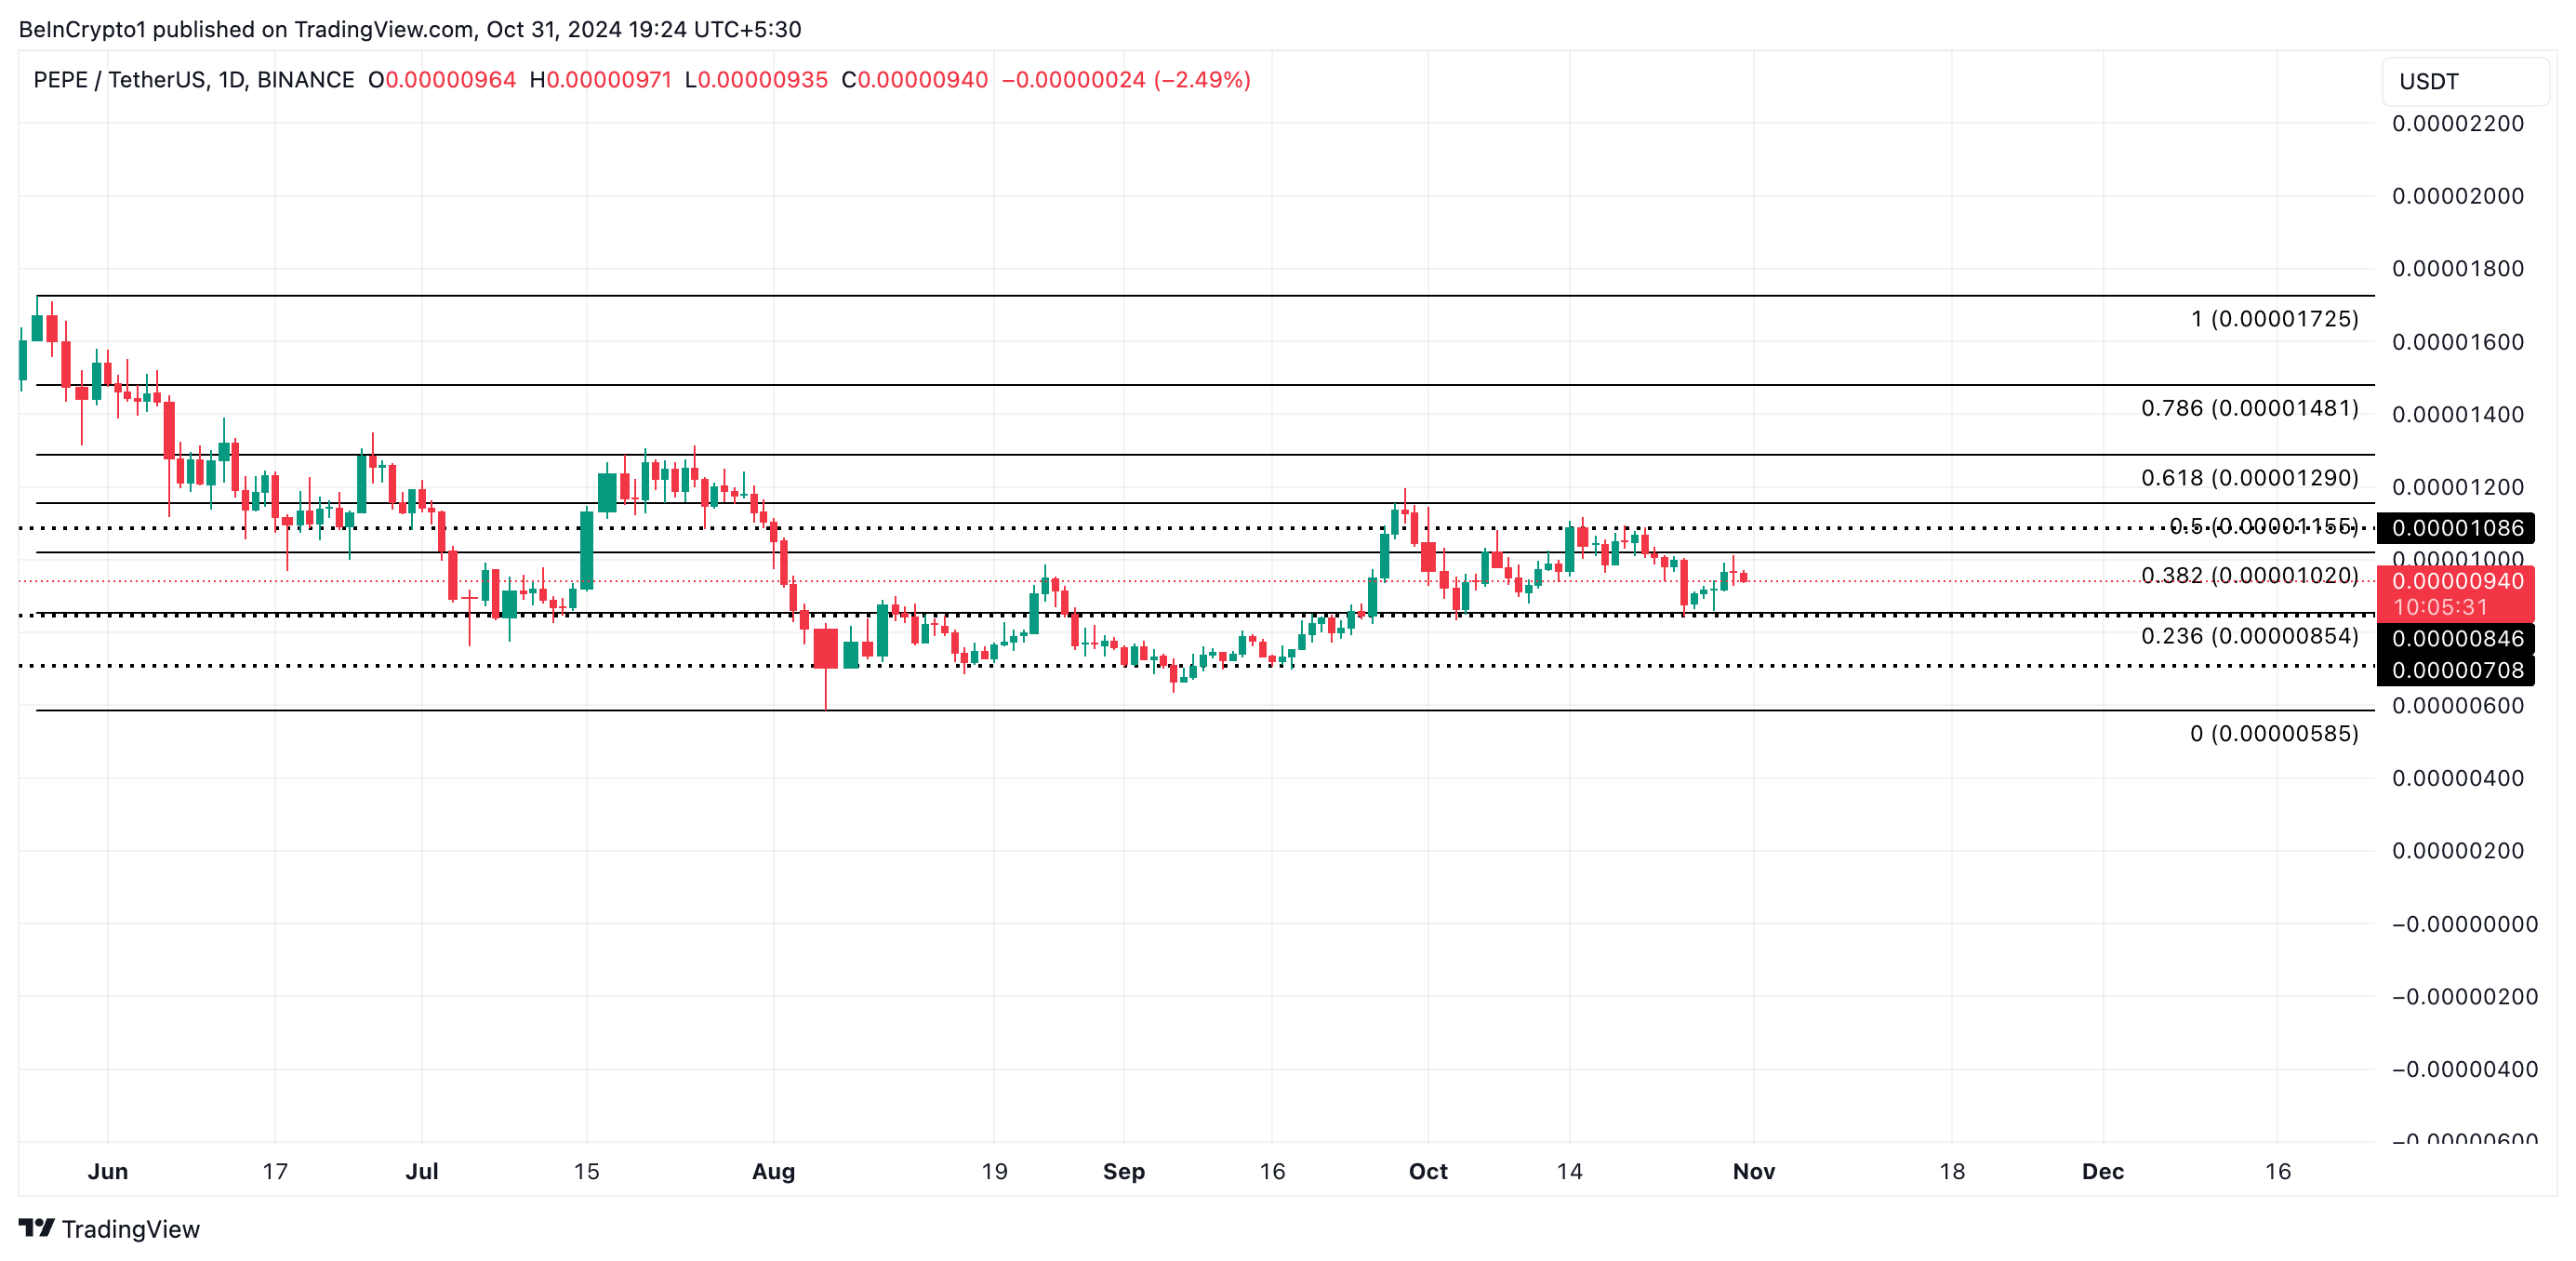
However, if buying momentum weakens, PEPE risks slipping back into its current range, potentially targeting the support at $0.0000084. Should the bulls fail to defend this level, PEPE could retrace further, eyeing the $0.0000070 mark.
Disclaimer
In line with the Trust Project guidelines, this price analysis article is for informational purposes only and should not be considered financial or investment advice. BeInCrypto is committed to accurate, unbiased reporting, but market conditions are subject to change without notice. Always conduct your own research and consult with a professional before making any financial decisions. Please note that our Terms and Conditions, Privacy Policy, and Disclaimers have been updated.


Solana plunged to a 12-month low of $95.23 on April 7, marking a sharp decline amid broader market turbulence.
However, as the market embarked on a recovery this week, SOL has witnessed a rebound, with its price climbing as demand surges.
SOL Rebounds 17%, Eyes Further Gains
Since SOL began its current rally, its value has soared by 17%. At press time, the altcoin trades at $124.58, resting atop an ascending trend line.
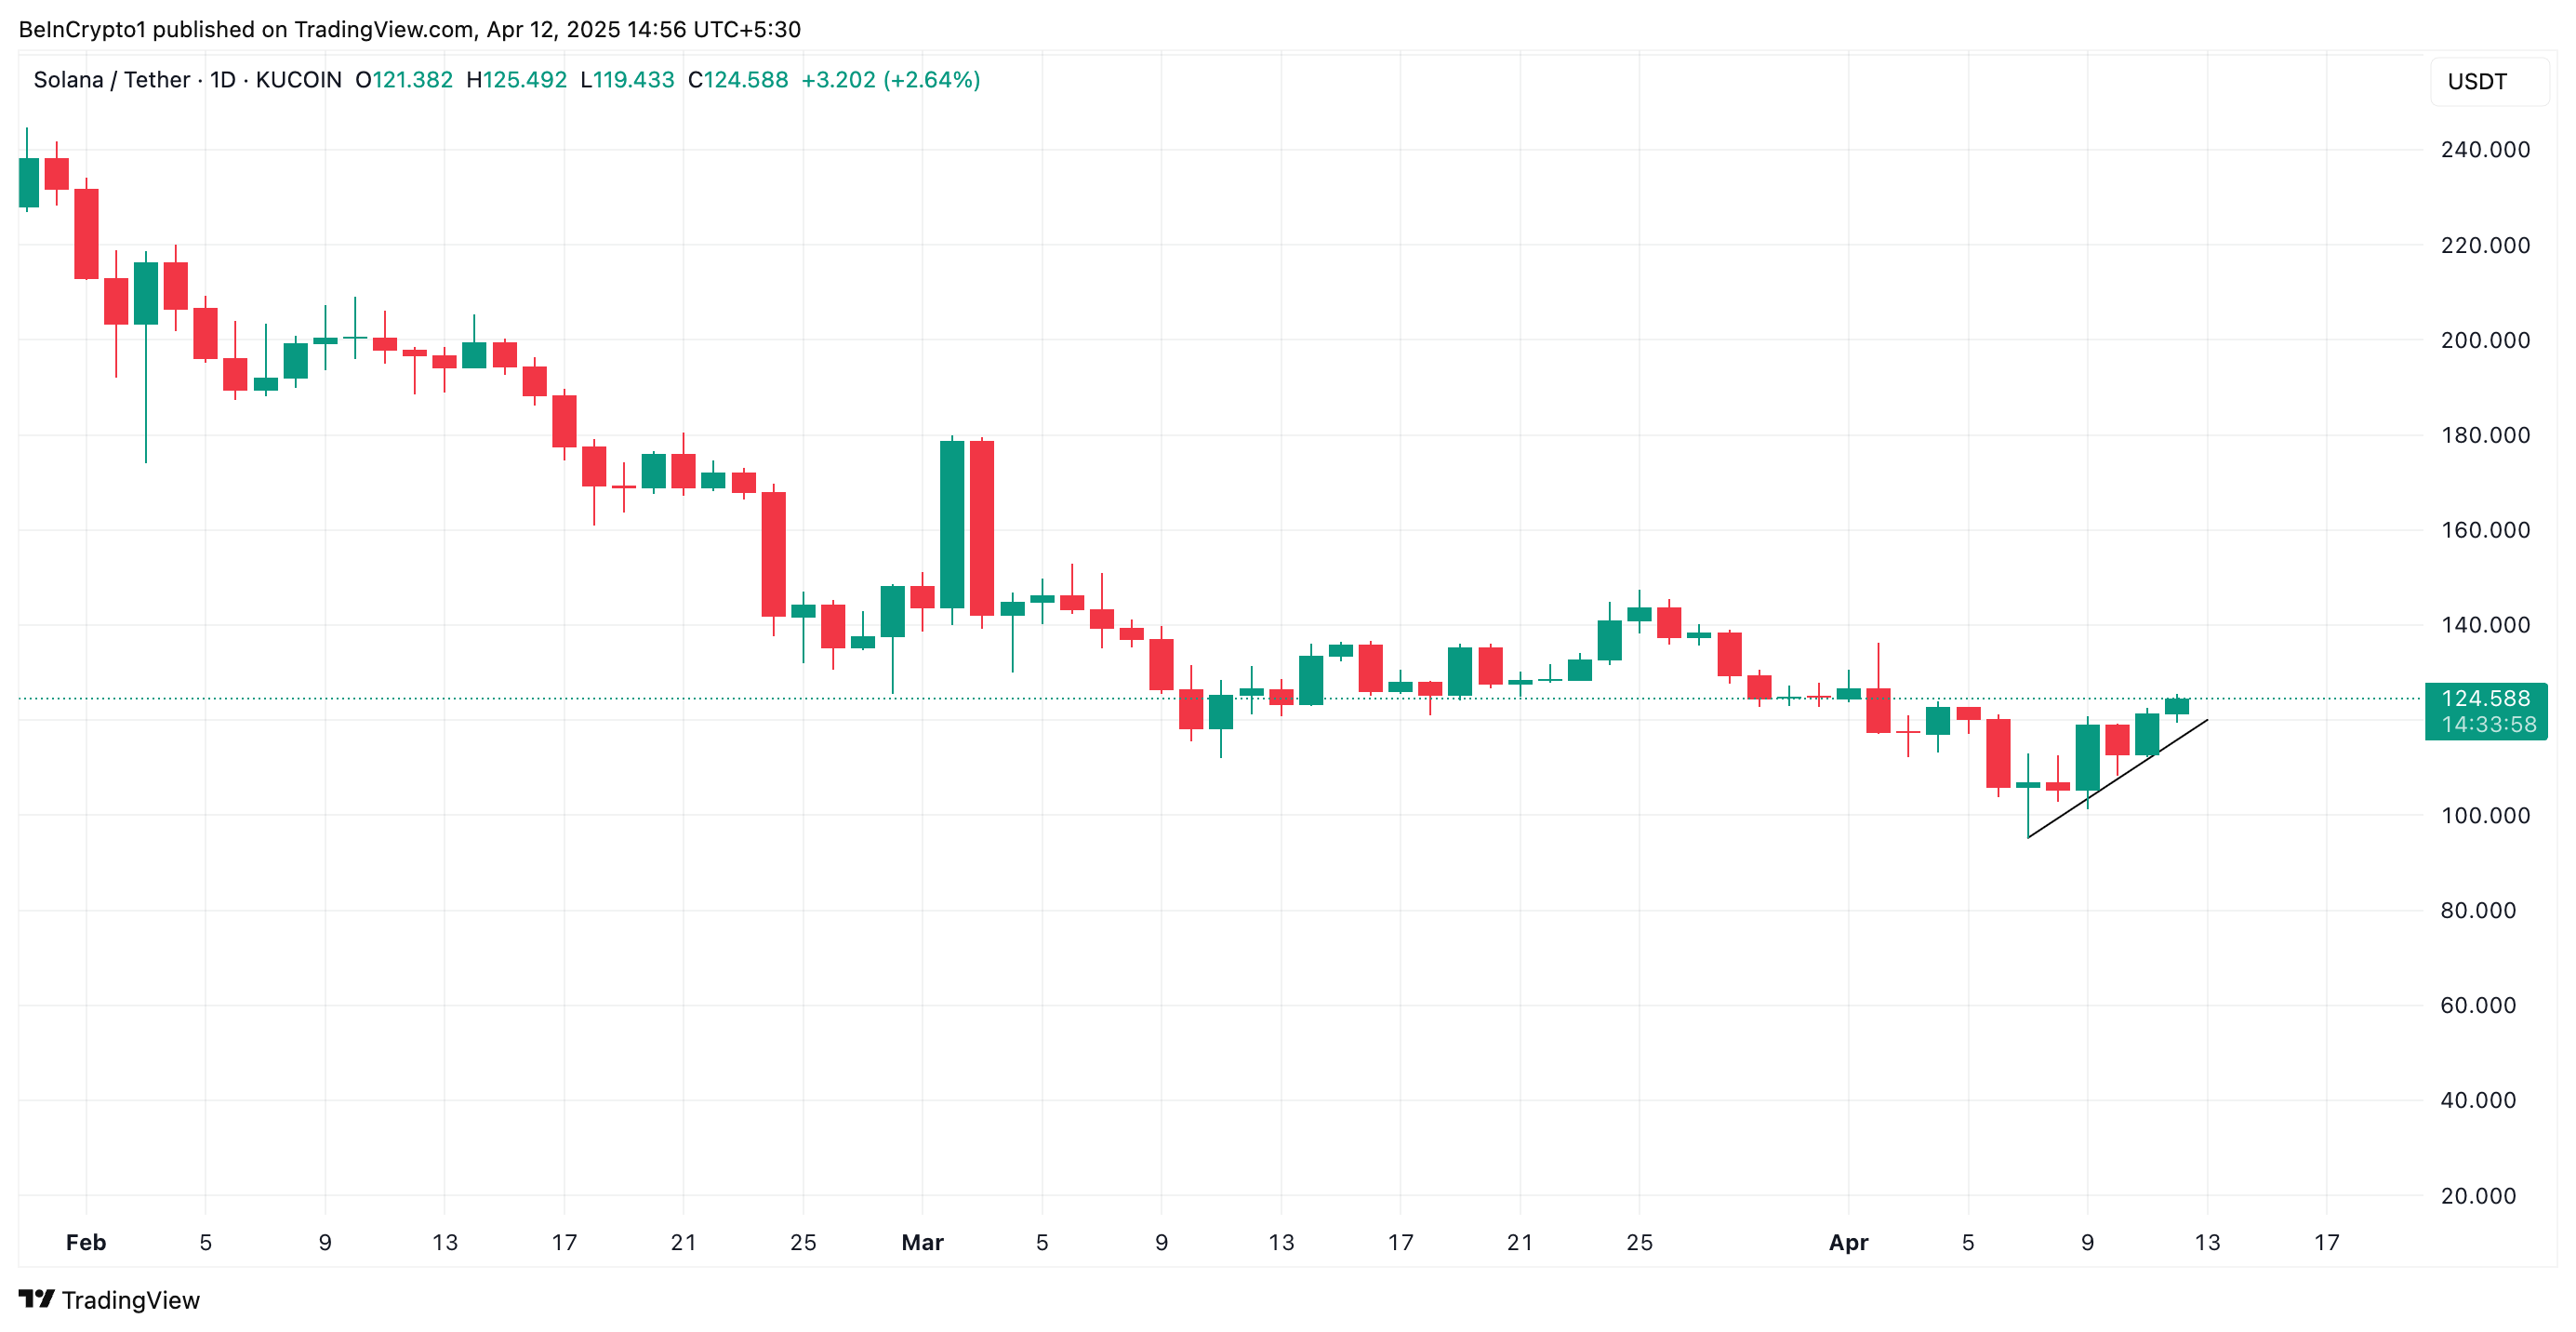
This pattern emerges when the price of an asset consistently makes higher lows over a period of time. It represents an uptrend, indicating that SOL demand is gradually increasing, driving its prices higher. It suggests that the coin buyers are willing to pay more, and it serves as a support level during price corrections.
SOL’s recovery is further supported by its rising Relative Strength Index (RSI), indicating increasing buying interest. This momentum indicator is at 49.58 at press time, poised to break above the 50-neutral line.
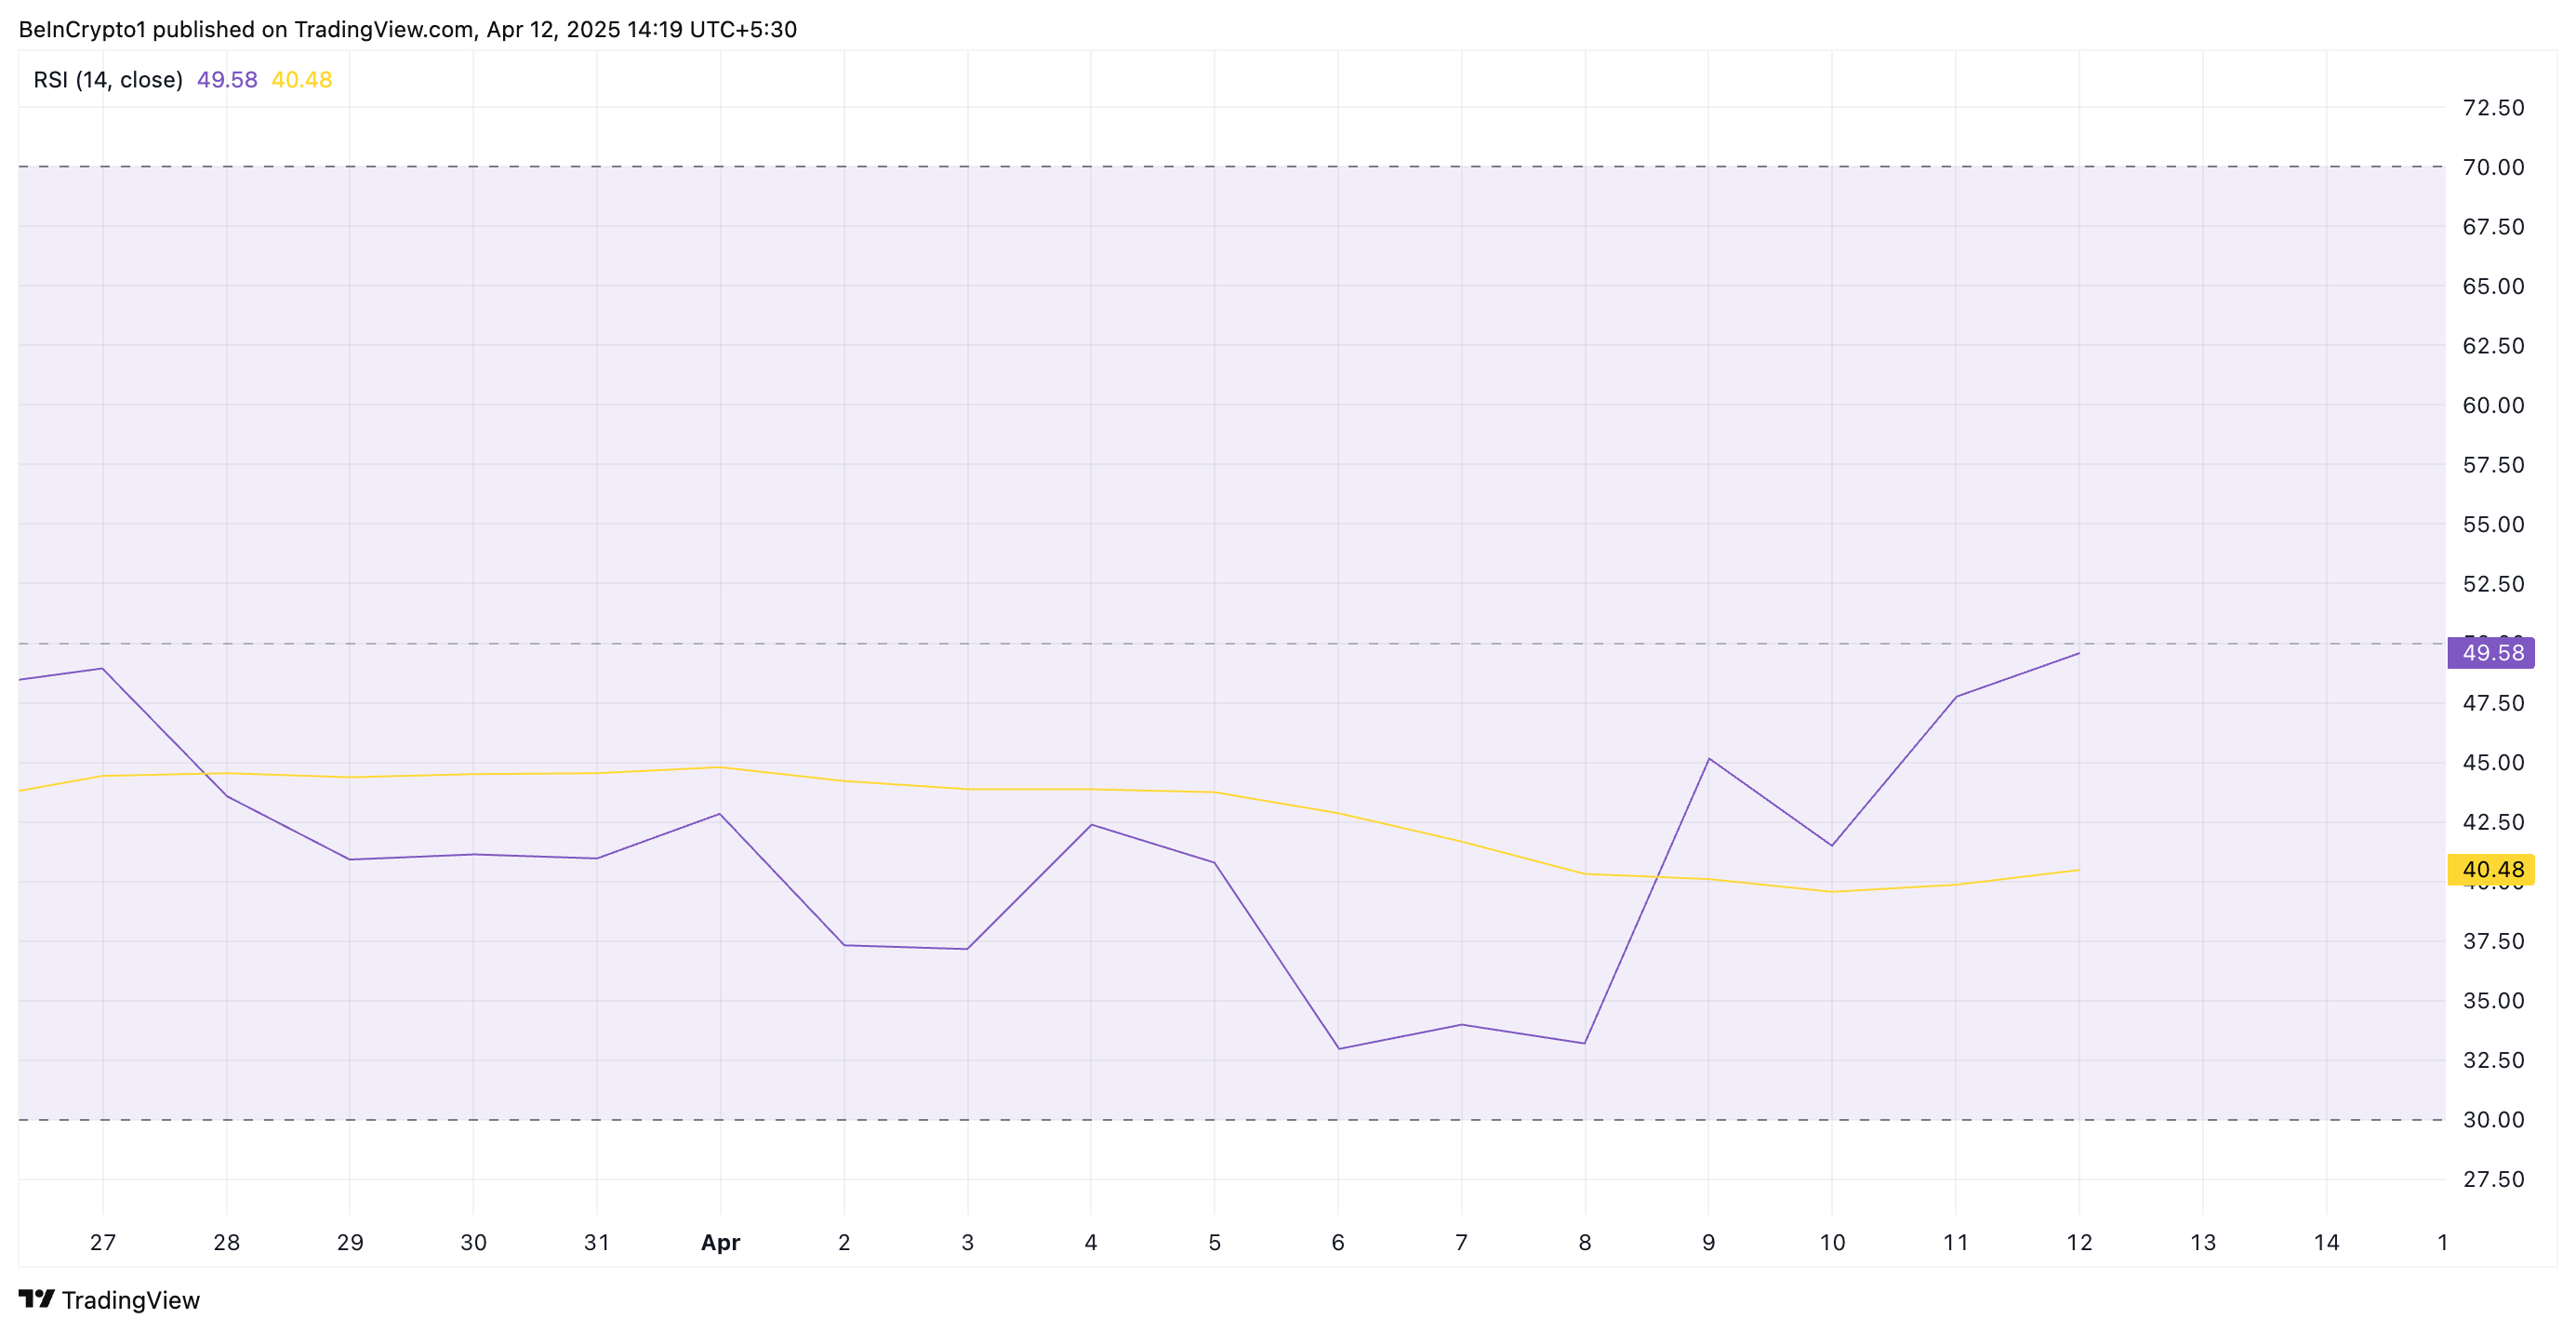
The RSI indicator measures an asset’s overbought and oversold market conditions. It ranges between 0 and 100. Values above 70 suggest that the asset is overbought and due for a price decline, while values under 30 indicate that the asset is oversold and may witness a rebound.
At 49.50 and climbing, SOL’s RSI signals a steady shift in momentum from bearish to bullish. A rise above 50 would confirm increasing buying pressure and a potential for a sustained upward price movement.
Solana Bulls Eye $138
SOL’s ascending trend line forms a solid support floor below its price at $120.74. If demand soars and the bullish presence with the SOL spot markets strengthens, the coin could continue its rally and climb to $138.41.
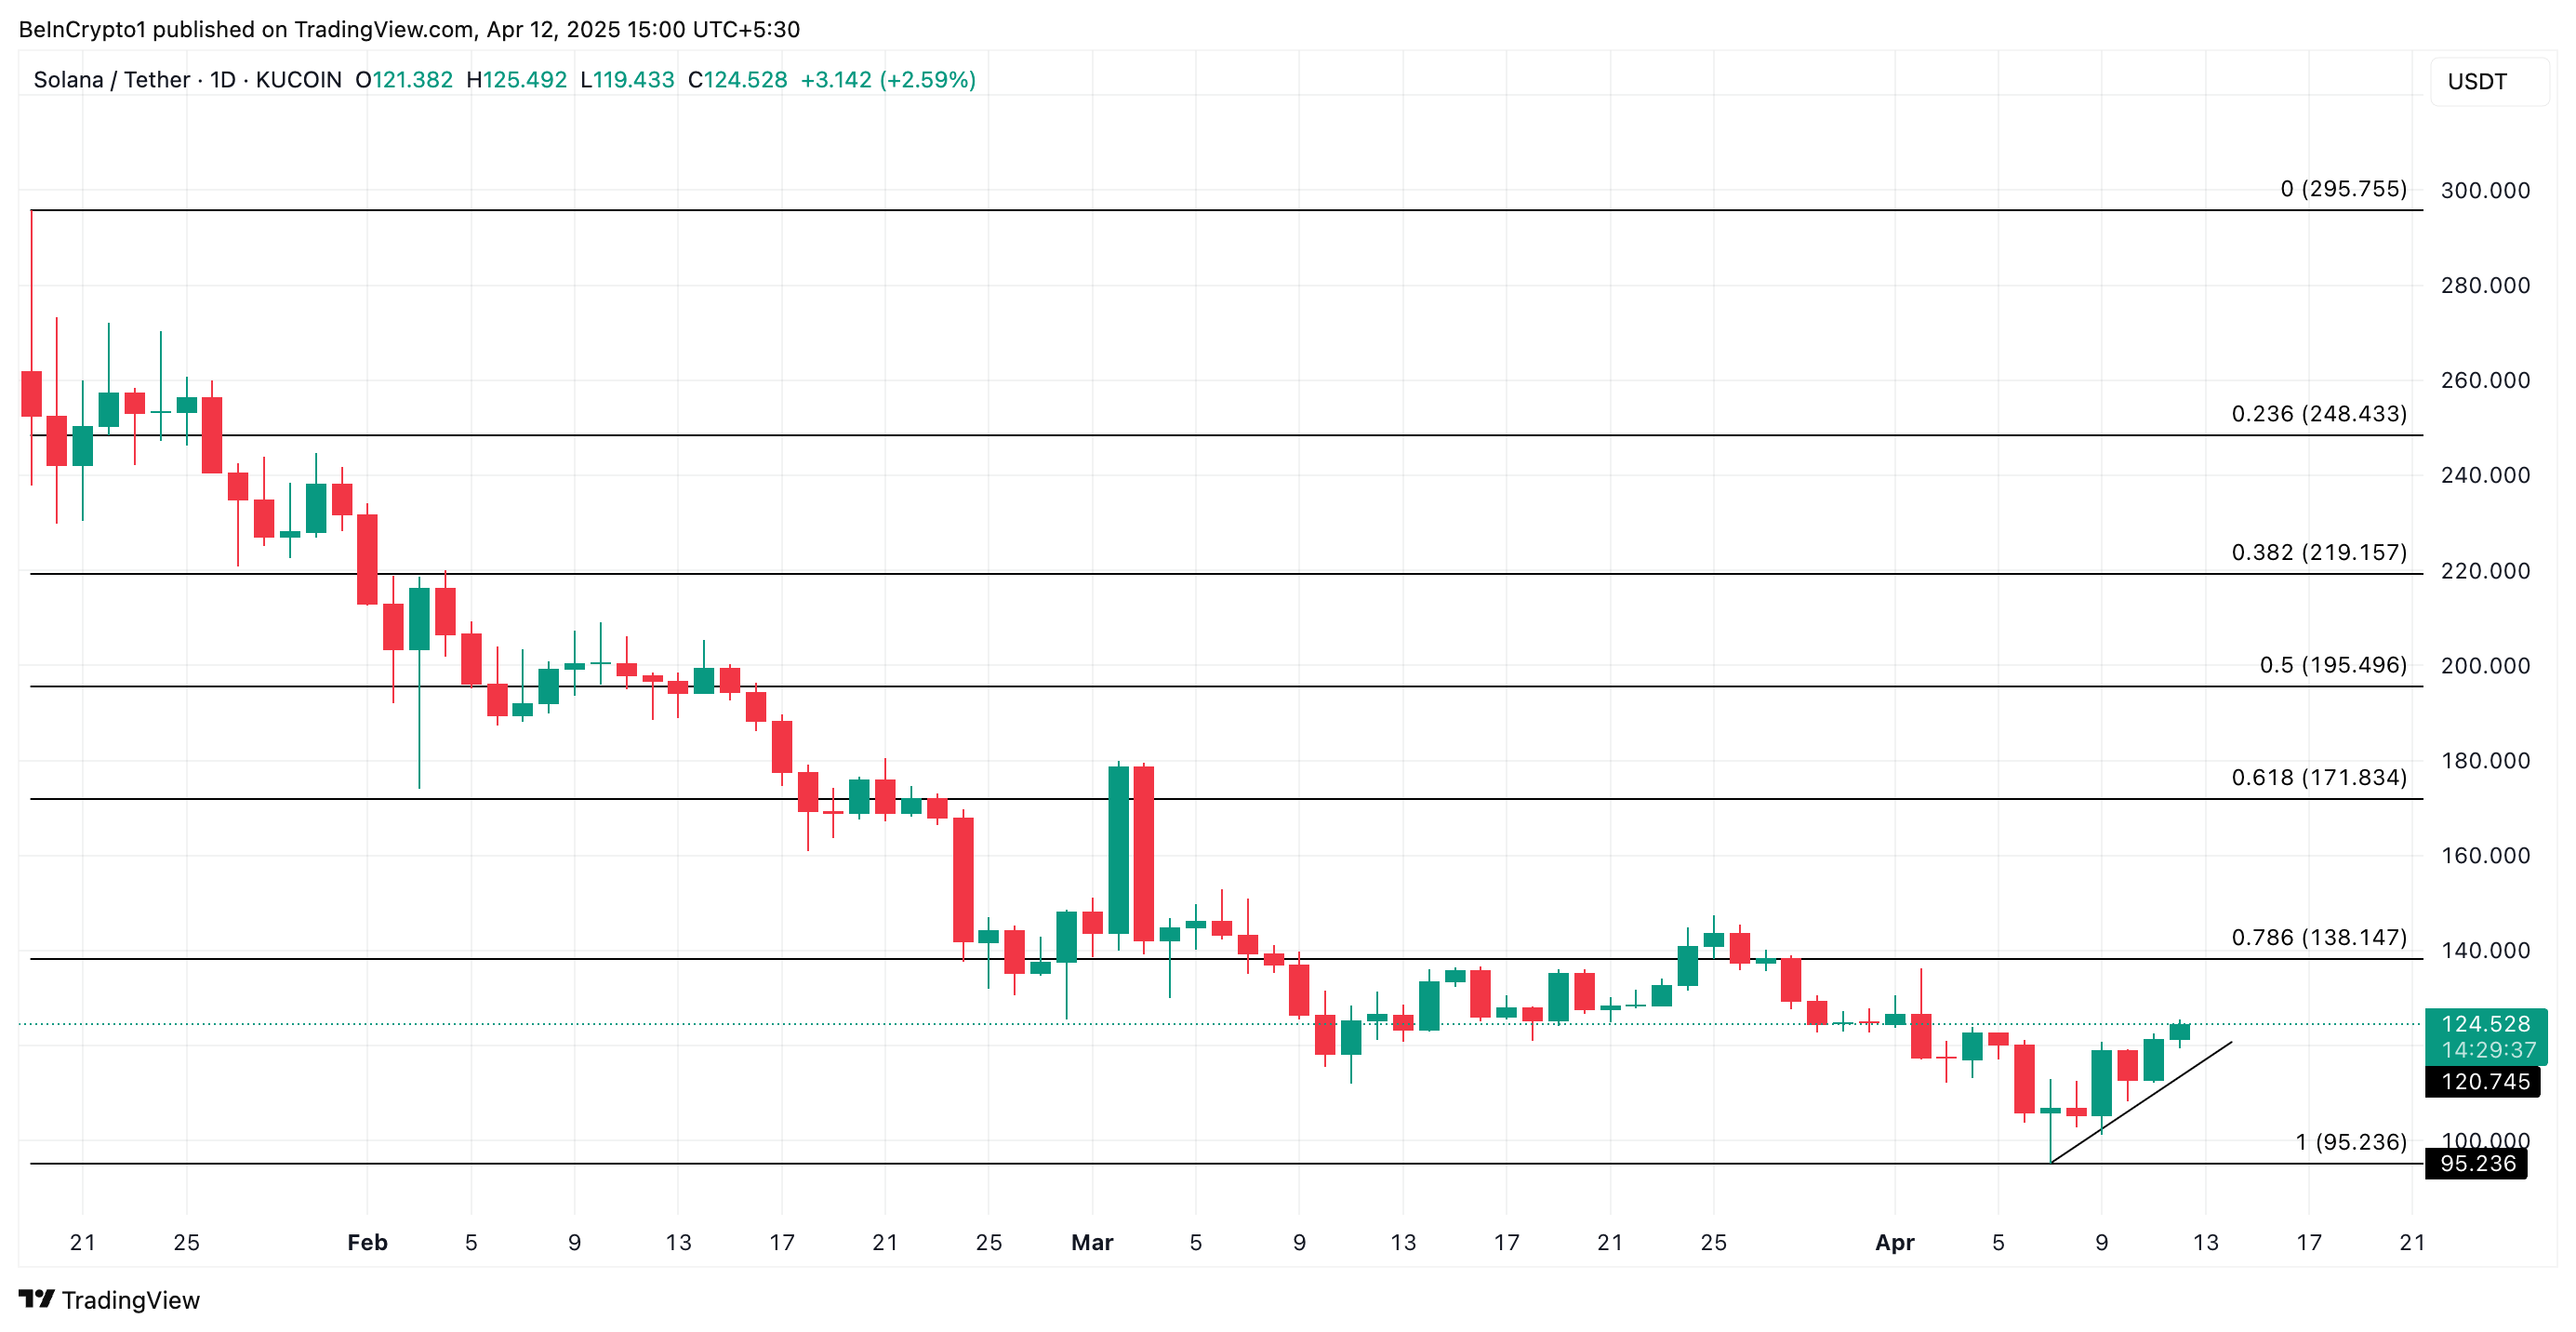
However, if profit-taking commences, the support at $120.74 would be breached, and the SOL’s price could revisit $95.23.
Disclaimer
In line with the Trust Project guidelines, this price analysis article is for informational purposes only and should not be considered financial or investment advice. BeInCrypto is committed to accurate, unbiased reporting, but market conditions are subject to change without notice. Always conduct your own research and consult with a professional before making any financial decisions. Please note that our Terms and Conditions, Privacy Policy, and Disclaimers have been updated.

Ripple’s long-running legal clash with the US Securities and Exchange Commission (SEC) appears to be nearing its final chapter.
However, a surprising detail has emerged from the ongoing settlement talks, which could see Ripple pay its reduced $50 million penalty using its native token, XRP.
Ripple Could Use XRP Token to Pay SEC Fine
On April 11, Ripple CEO Brad Garlinghouse appeared on FOX Business. At the interview, he revealed that the idea of paying the penalty in XRP was floated during settlement discussions.
“The SEC is going to end up with $50 million and the US government gets $50 million and we talked about making that available in XRP,” Garlinghouse stated.
The ongoing negotiations follow Ripple’s and the SEC’s decision to drop their appeals, bringing the multi-year legal battle closer to closure.
“We’re moving past the SEC’s war on crypto and entering the next phase of the market – true institutional flows integrating with decentralized finance,” Garlinghouse added in a post on X.
Judge Analisa Torres originally set the fine at $125 million in 2024, linking it to Ripple’s unregistered XRP sales to institutional investors. Ripple complied by placing the funds in an interest-bearing account, but the appeals process delayed any further action.
With those appeals now abandoned, Ripple is expected to pay a reduced fine of $50 million.
A recent joint court filing confirms that both sides have reached a preliminary agreement. They are now seeking final approval from the SEC’s commissioners.
Once internal reviews are complete, the parties plan to request a formal ruling from the district court.
“There is good cause for the parties’ joint request that this Court put these appeals in abeyance. The parties have reached an agreement-in-principle, subject to Commission approval, to resolve the underlying case, the Commission’s appeal, and Ripple’s cross-appeal. The parties require additional time to obtain Commission approval for this agreement-in-principle, and if approved by the Commission, to seek an indicative ruling from the district court,” the filing stated.
If the commission votes in favor, this case could conclude one of the most closely watched regulatory battles in crypto history. More importantly, the use of XRP for the settlement could mark a significant shift in the SEC’s approach to digital assets.
This turnaround would represent a major regulatory shift and could trigger further bullish momentum for the token.
Since Donald Trump’s election victory in November 2024, investor confidence in XRP has grown sharply, pushing the token’s value up by more than 300%.
At the same time, institutional interest continues to rise, as seen in the wave of spot exchange-traded fund applications tied to the token
Market analysts have linked this performance to the friendlier political climate. They also point to the potential reclassification of XRP as a commodity as a key factor driving the asset’s rise.
Disclaimer
In adherence to the Trust Project guidelines, BeInCrypto is committed to unbiased, transparent reporting. This news article aims to provide accurate, timely information. However, readers are advised to verify facts independently and consult with a professional before making any decisions based on this content. Please note that our Terms and Conditions, Privacy Policy, and Disclaimers have been updated.

Ethereum ETFs have closed yet another week in the red, recording net outflows amid continued investor hesitation.
Notably, there has been no single week of net inflows since the end of February, highlighting waning institutional interest in ETH-related products.
Ethereum ETFs Face Steady Outflows
Ethereum-backed ETFs have recorded their seventh consecutive week of net outflows, highlighting sustained institutional hesitance toward the asset.
This week alone, net outflows from spot ETH ETFs totaled $82.47 million, marking a 39% surge from the $49 million recorded in outflows the previous week.
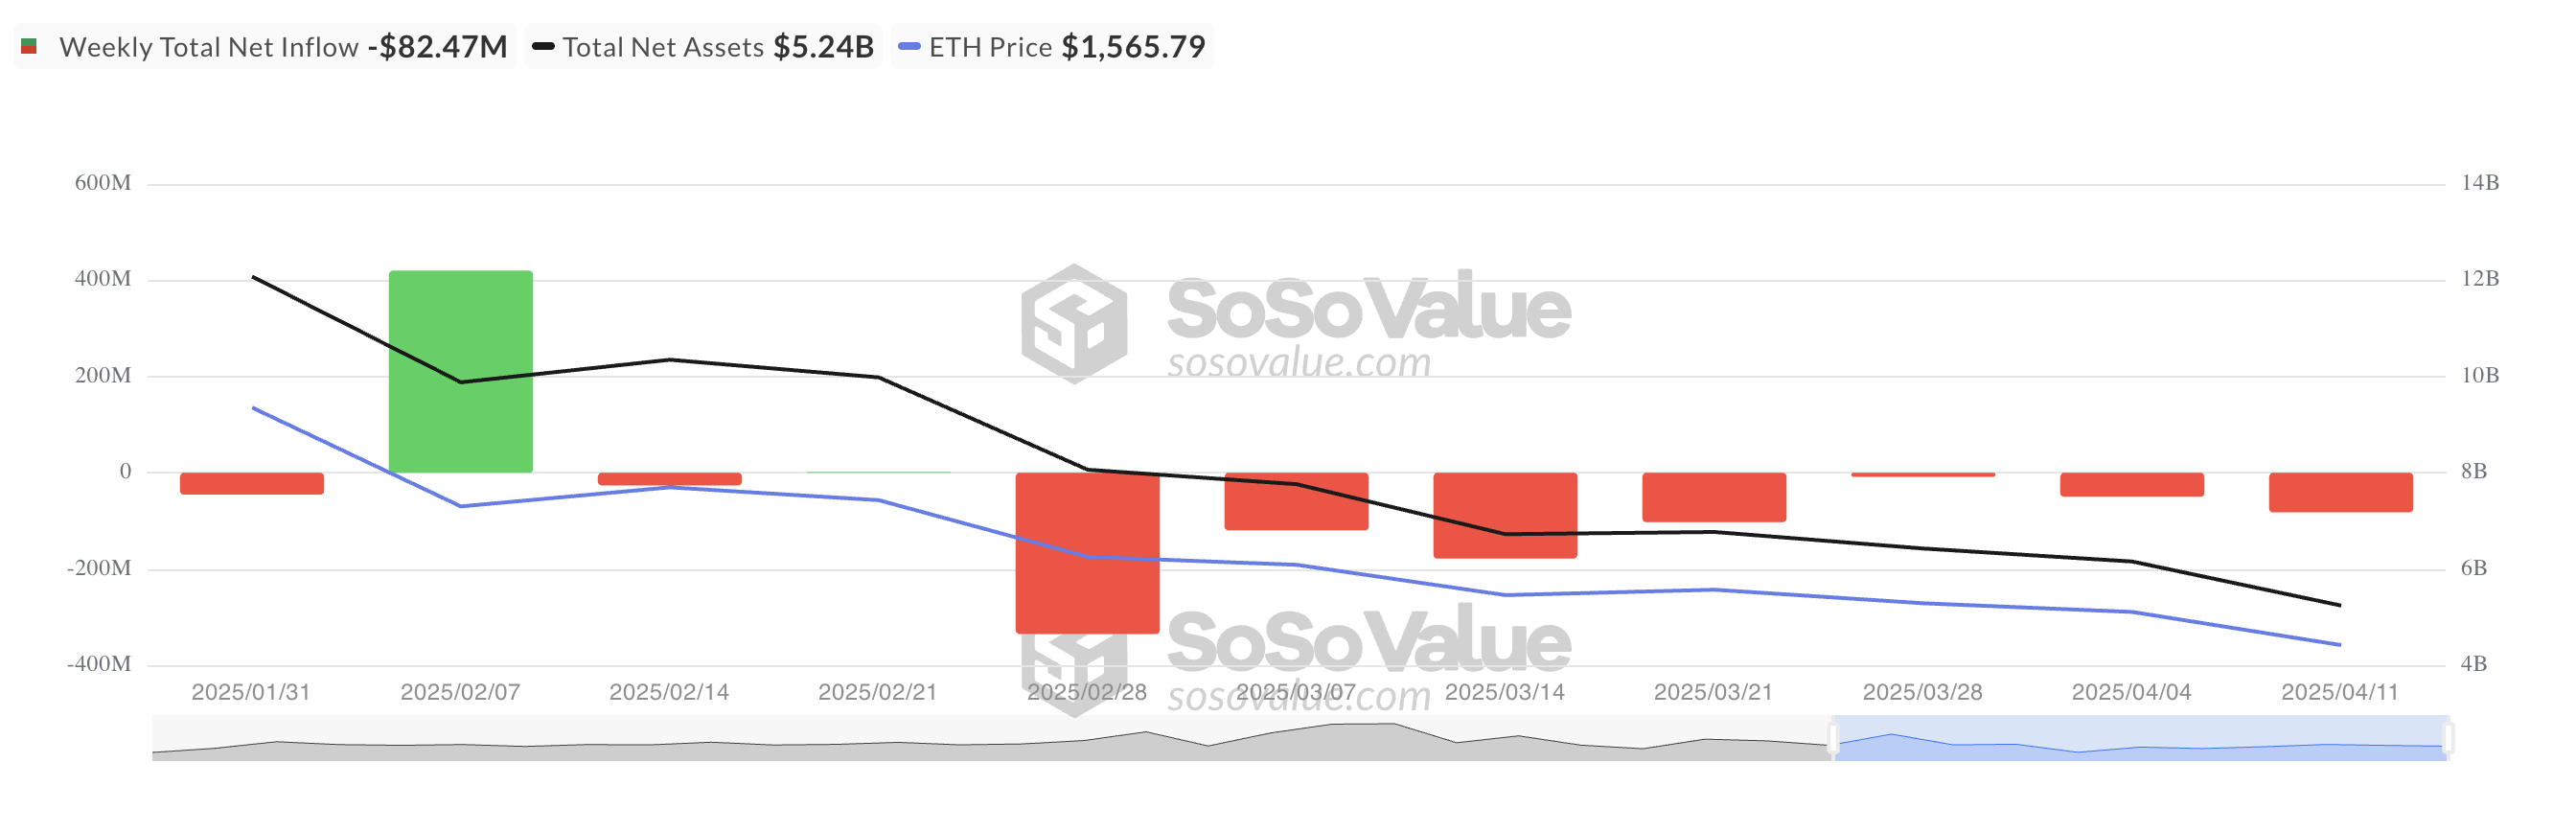
With the steady decline in institutional presence in the ETH market, the selling pressure on the coin has soared.
Over the past week, ETH’s price has declined by 11%. The steady outflows from the funds backed by the coin suggest that the downward momentum may persist, increasing the likelihood of a price drop below the $1,500 mark.
On the price chart, technical indicators remain bearish, confirming the mounting pressure from the selling side of the market. For example, at press time, readings from ETH’s Directional Movement Index (DMI) show its positive directional index (+DI) resting below the negative directional index (-DI).
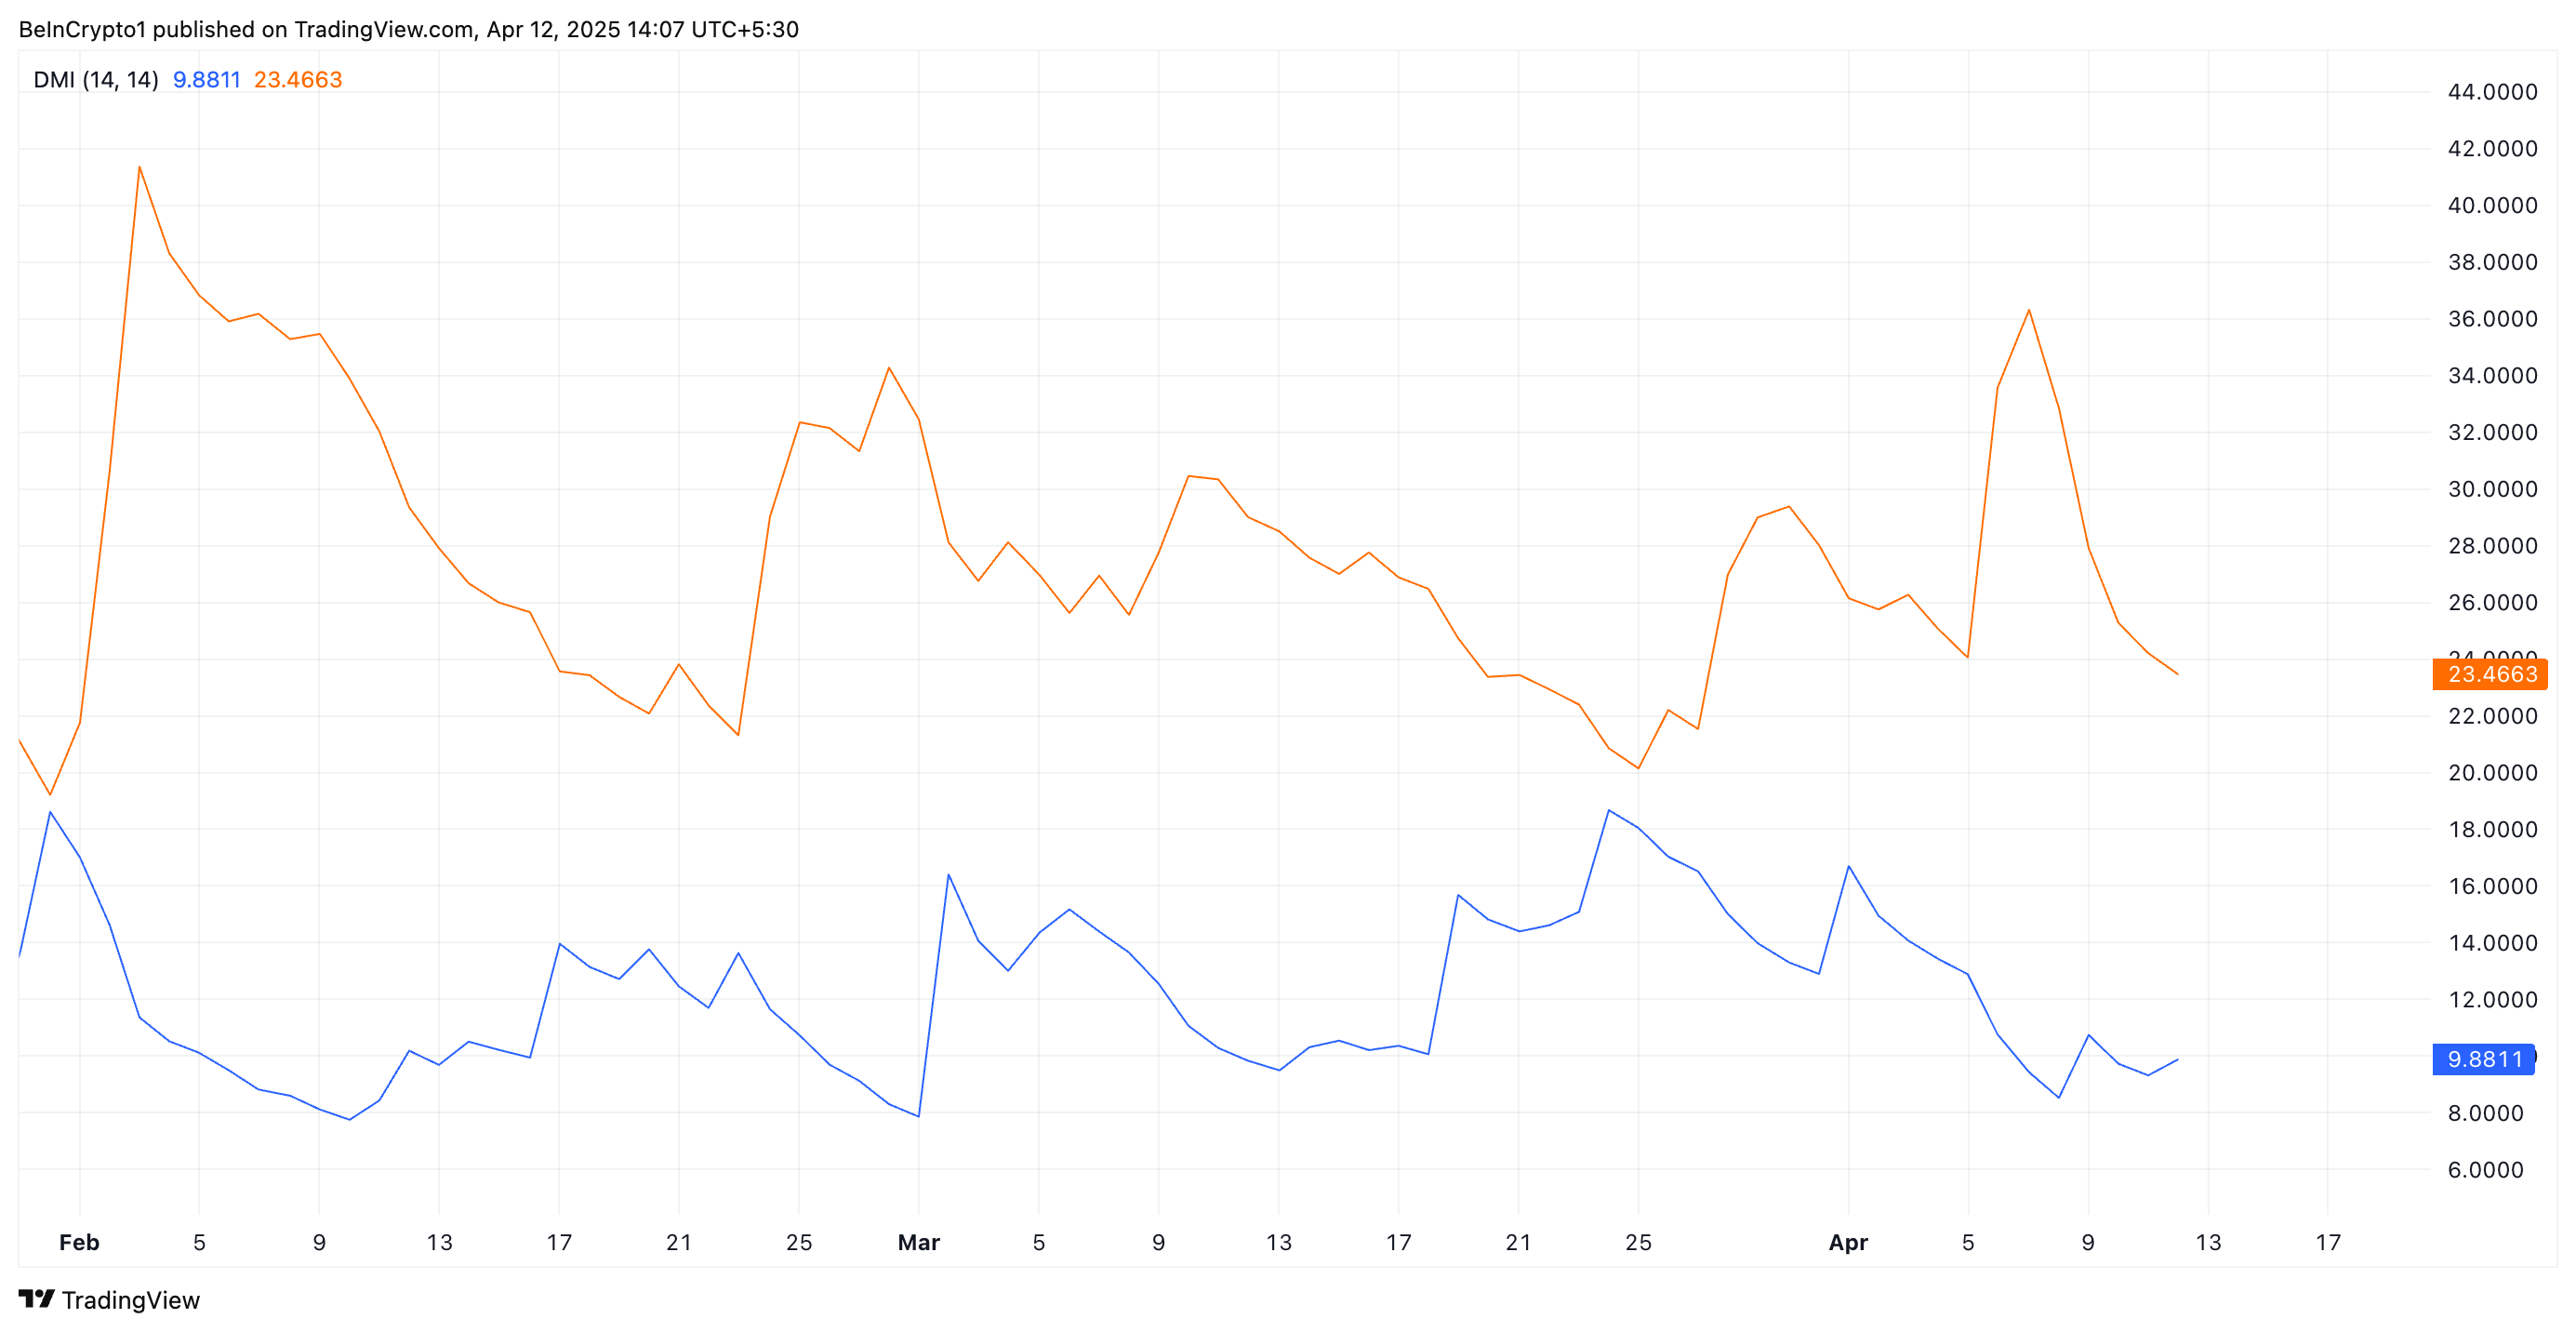
The DMI indicator measures the strength of an asset’s price trend. It consists of two lines: the +DI, which represents upward price movement, and the -DI, which represents downward price movement.
As with ETH, when the +DI rests below the -DI, the market is in a bearish trend, with downward price movement dominating the market sentiment.
Ethereum’s Price Could Drop Below $1,500
The lack of institutional capital could delay any significant rebound in ETH price, further dampening short-term prospects for recovery. If demand leans further, ETH could break out of its narrow range and follow a downward trend.
The altcoin could fall below $1,500 in this scenario to reach $1,395.
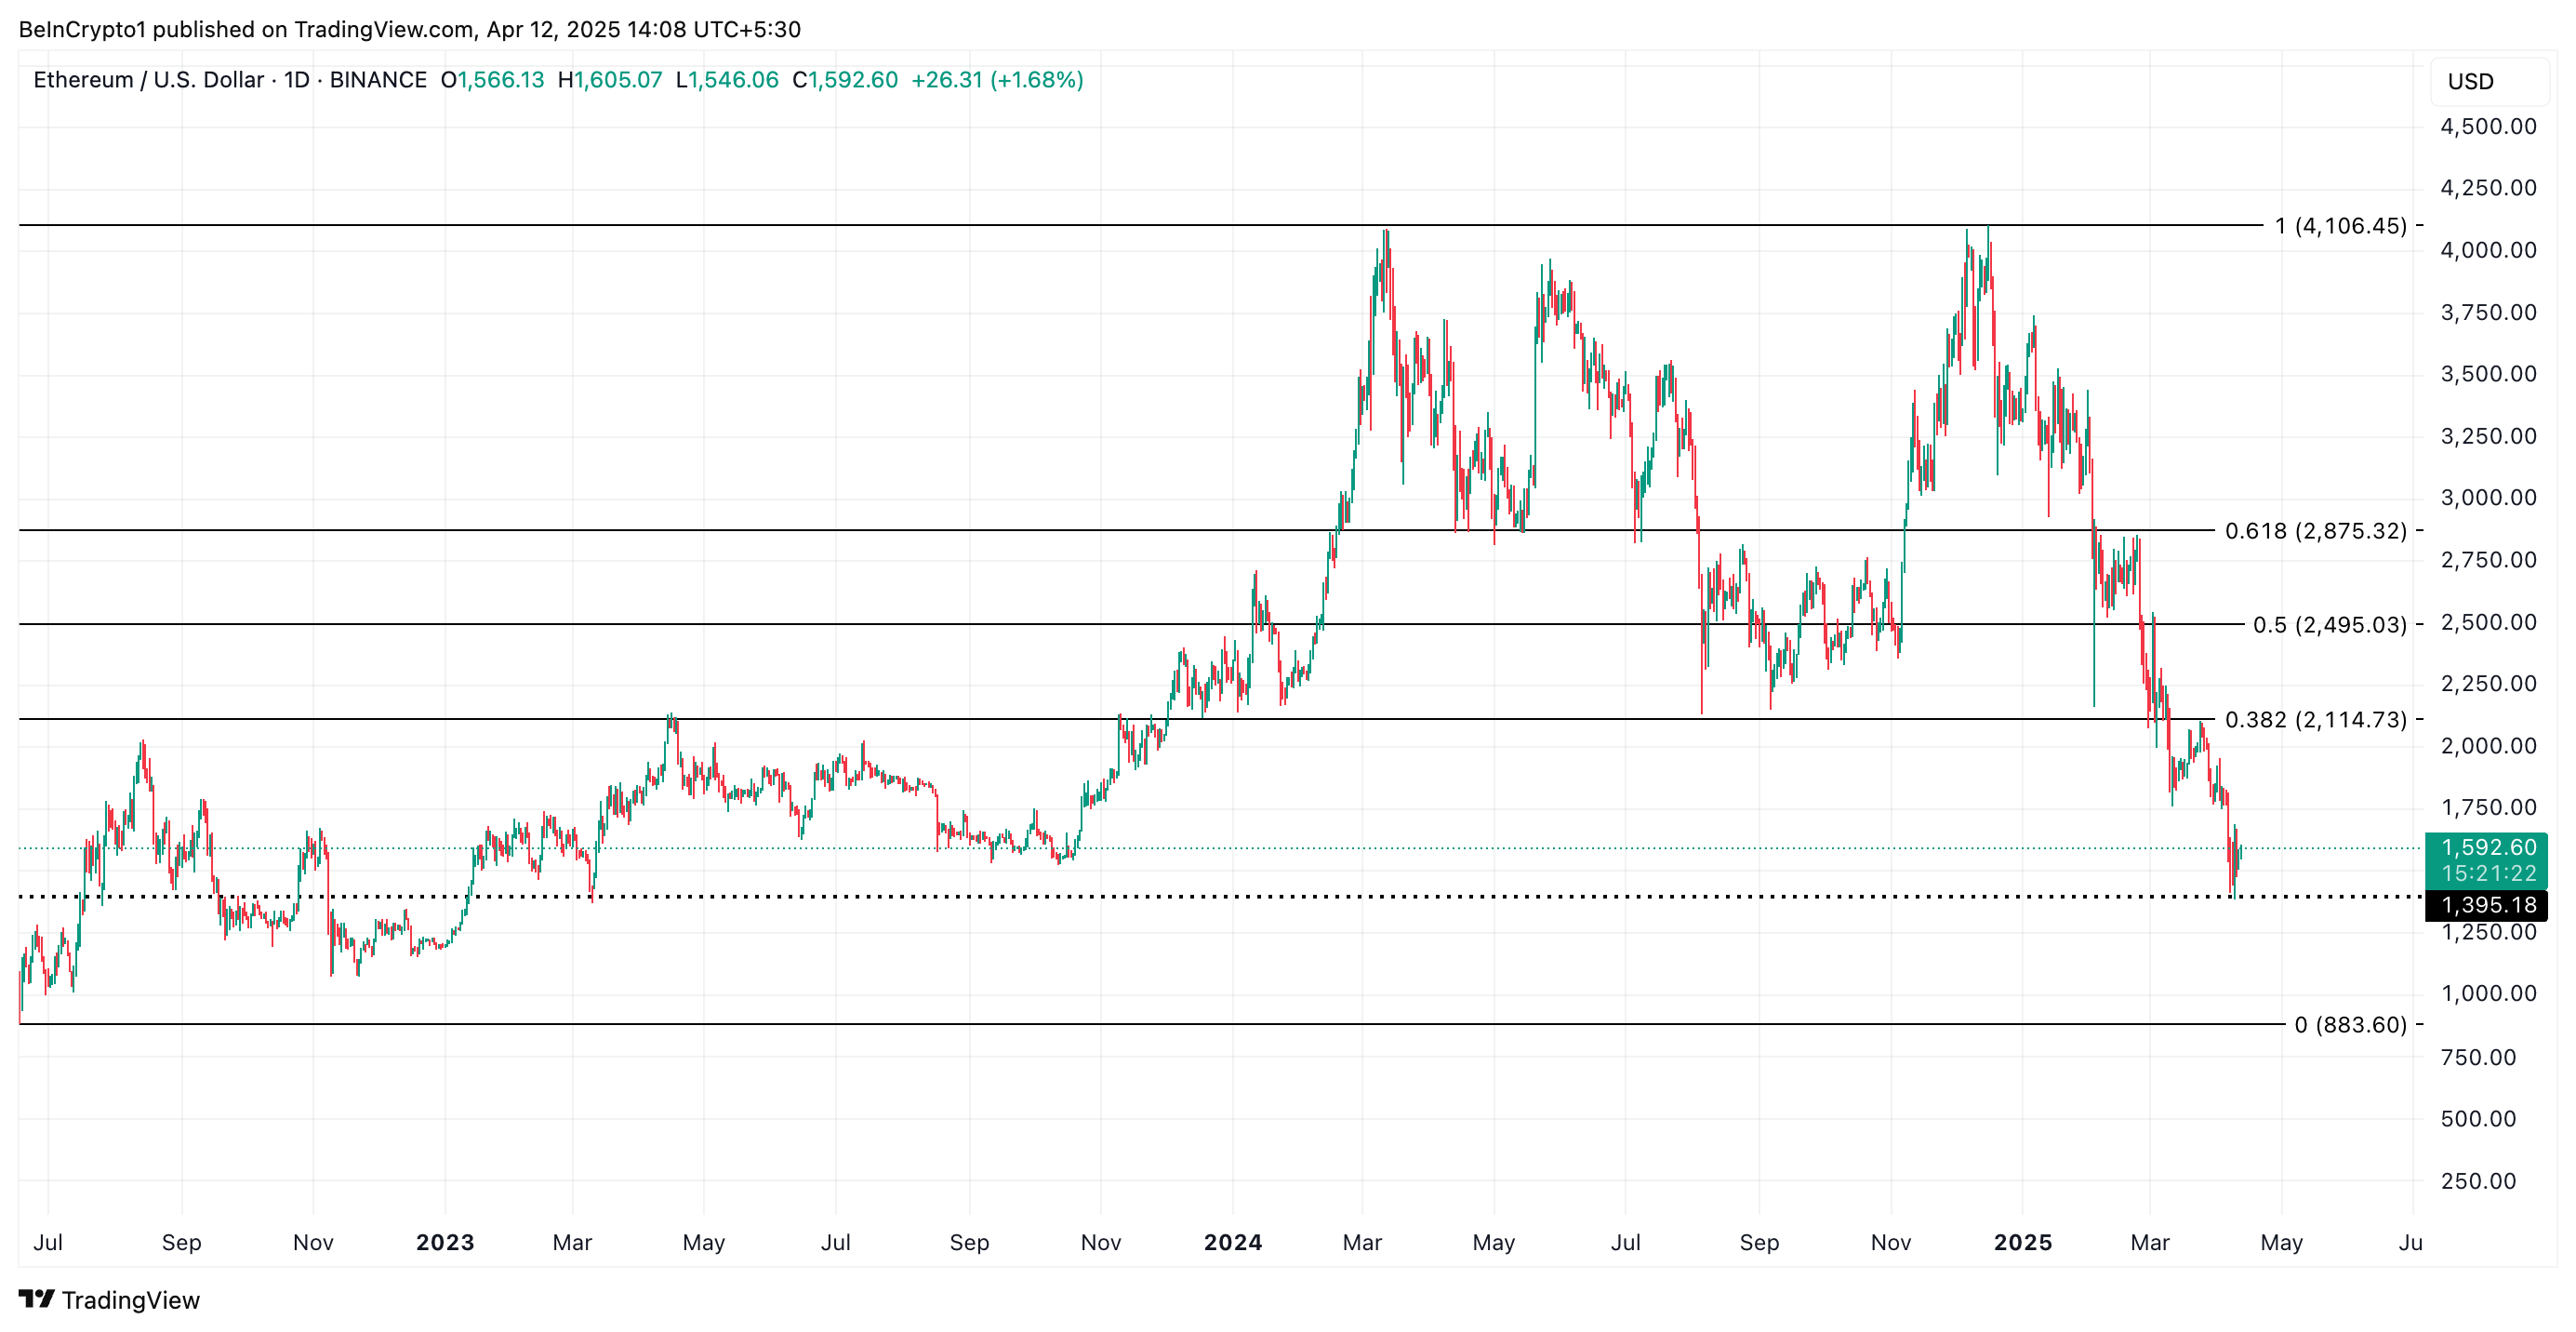
However, if ETH witnesses a positive shift in sentiment and demand spikes, its price could climb to $2,114.
Disclaimer
In line with the Trust Project guidelines, this price analysis article is for informational purposes only and should not be considered financial or investment advice. BeInCrypto is committed to accurate, unbiased reporting, but market conditions are subject to change without notice. Always conduct your own research and consult with a professional before making any financial decisions. Please note that our Terms and Conditions, Privacy Policy, and Disclaimers have been updated.

Bankless Cofounder David Hoffman Reveals Strategy To Improve Ethereum Price Performance

Solana Bulls Lead 17% Recovery, Targeting $138

Ripple May Settle SEC’s $50 Million Fine Using XRP

Bitcoin’s Impact Alarming, Says NY Atty. General—Congress Needs To Act

Ethereum ETFs See Seventh Consecutive Week of Net Outflows

SEC Signals Readiness to Rethink Crypto Trading Oversight

2.52 Million Altcoins Are Ruining Crypto’s Future

Animoca Brands Valuation Tanks 75% In Two Years, Here’s Why

Crypto exchange BingX hacked for $43 million

Are The Big Players Losing Interest?

Hong Kong’s Securities Association Tips Authorities On Crypto Self-Regulation

Coinbase cbBTC Set to go Live on Solana
2.52 Million Altcoins Are Ruining Crypto’s Future
Animoca Brands Valuation Tanks 75% In Two Years, Here’s Why
Crypto exchange BingX hacked for $43 million
Are The Big Players Losing Interest?
Hong Kong’s Securities Association Tips Authorities On Crypto Self-Regulation
Coinbase cbBTC Set to go Live on Solana
-

 Market23 hours ago
3 Altcoins to Watch for Binance Listing This April
-
 Market21 hours ago
Lawmakers Propose the PROOF Act to Avoid Another FTX Incident
-

 Market20 hours ago
This is Why The Federal Reserve Might Not Cutting Interest Rates
-

 Regulation24 hours ago
US Senators Reintroduce PROOF Act To Set Reserve Standards for Crypto Firms
-

 Altcoin21 hours ago
Solana Price Eyes Breakout to $200, SOL ETF Approval Timeline
-
 Altcoin8 hours ago
Shiba Inu Burn Rate Explodes 1000%, Can SHIB Price Hit $0.000015?
-
 Altcoin20 hours ago
Analyst Reveals XRP Price Can Hit $45 If It Follows This 2017 Pattern
-
 Market19 hours ago
XRP Price Flashes Symmetrical Triangle From 2017, A Repeat Could Send It as Flying To $30