
Market
Can Shiba Inu (SHIB) Make It Across the “Wedge?”

Shiba Inu (SHIB) is showing signs of breaking out of a falling wedge pattern. The leading meme coin has been trading within this pattern since March and is now attempting to break above it.
At press time, SHIB is trading at $0.000013, reflecting a 24% decline over the past month.
Shiba Inu Attempts Rally as Wedge Narrows
Since reaching a year-to-date high of $0.000035 on March 5, SHIB’s price has steadily declined, forming a falling wedge. This pattern develops when an asset’s price creates a series of lower highs and lower lows that converge, creating a wedge shape.
As the wedge narrows, buying pressure is gradually increasing relative to selling pressure. This is evident in SHIB’s current price, which is nearing the converging point of this pattern.
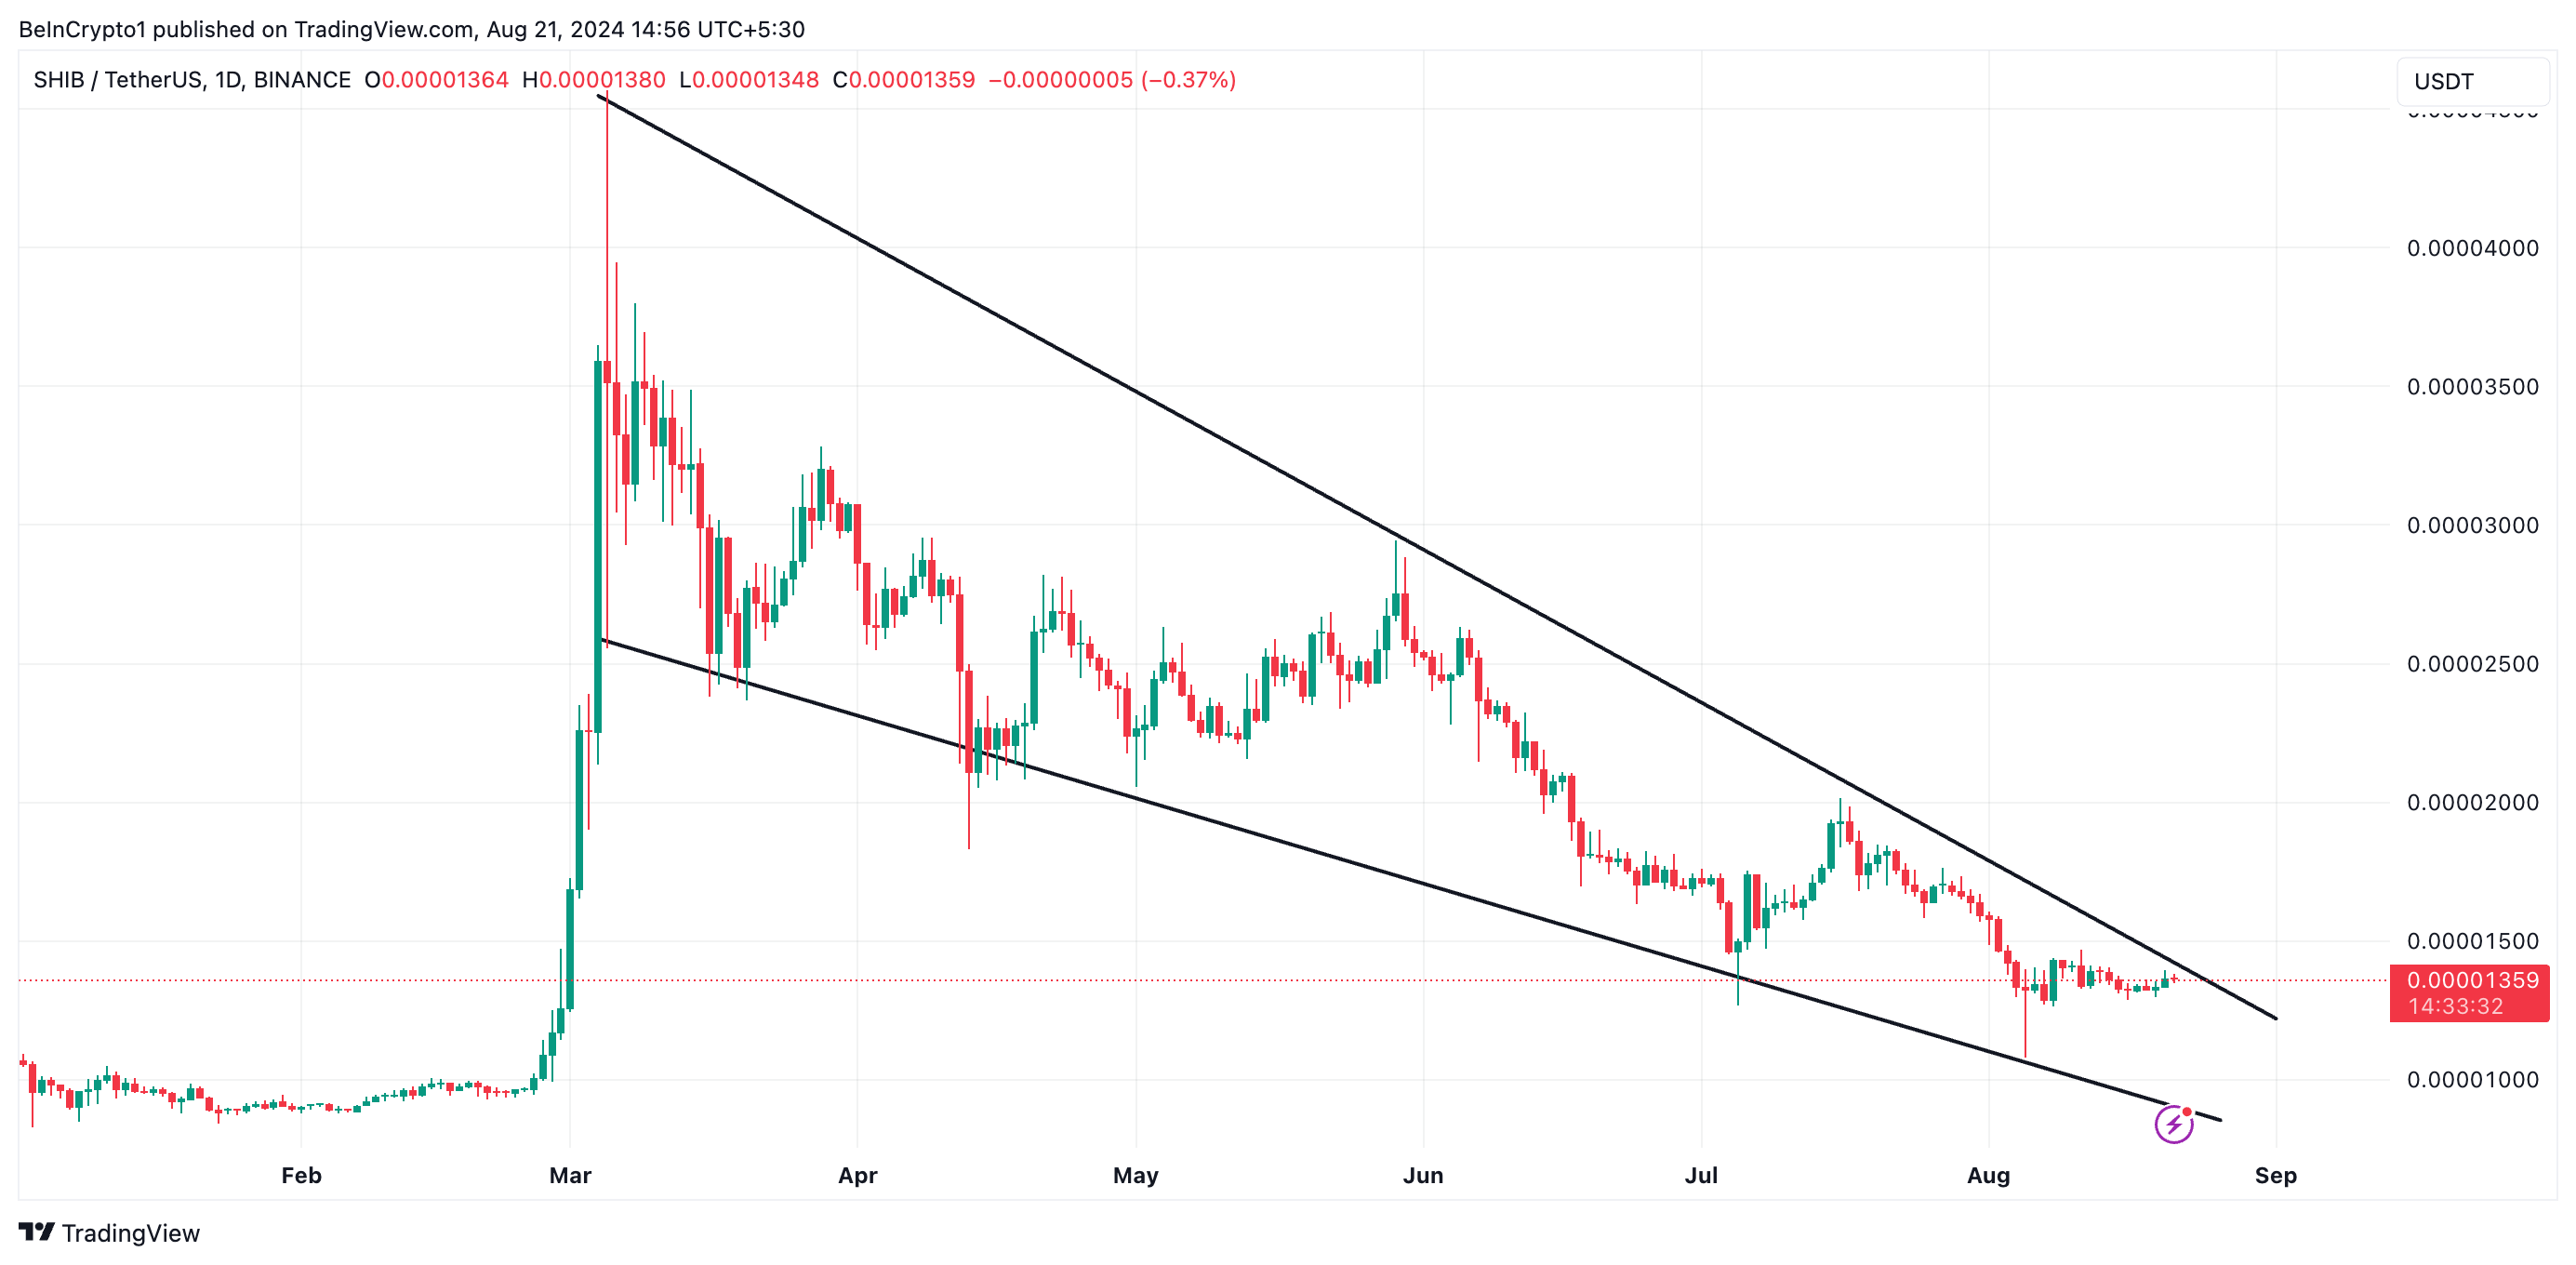
When an asset’s price breaks above this wedge, it signals a potential reversal from a downtrend to an uptrend, indicating that selling pressure is easing while buying interest grows.
SHIB’s rising Chaikin Money Flow (CMF) supports this increase in buying pressure. As of now, the indicator sits above the center line at 0.03, further confirming the bullish momentum.
Read more: How To Buy Shiba Inu (SHIB) and Everything You Need To Know
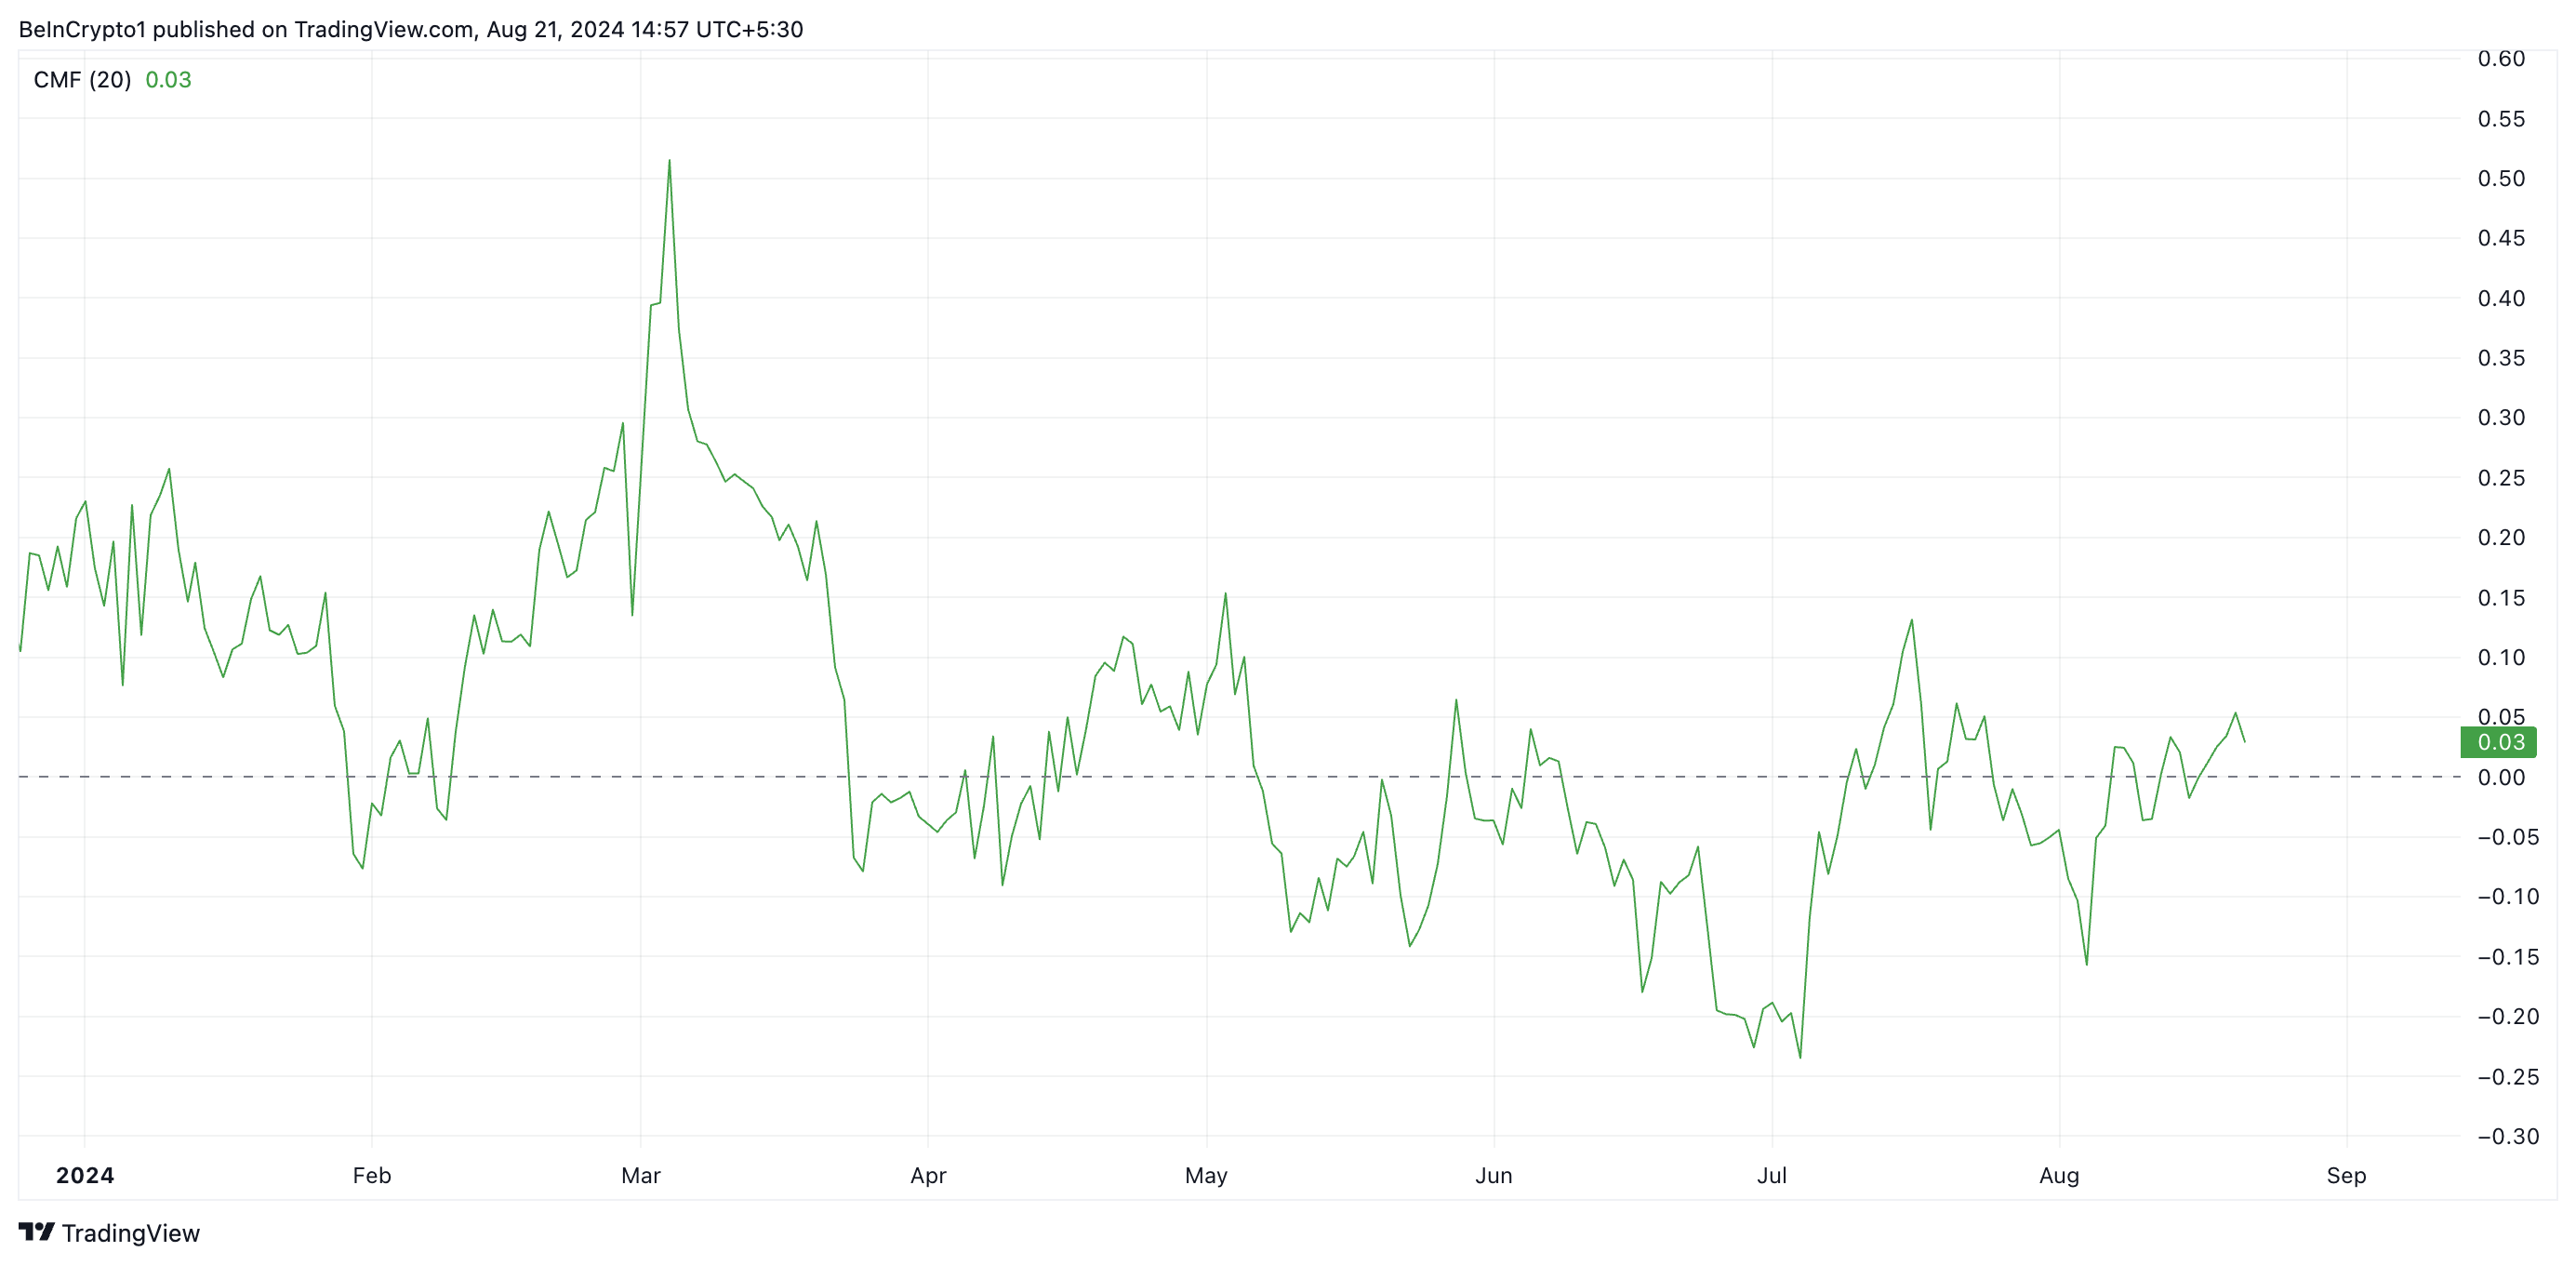
This indicator measures how money flows into and out of an asset — a positive CMF signals market growth as it signals liquidity inflow. At 0.03, SHIB’s CMF suggests that buying pressure exceeds selling activity, increasing the likelihood of its price break above the falling wedge.
SHIB Price Prediction: The Bulls Are Working
The meme coin is enjoying a bullish bias from market participants, as indicated by its Parabolic Stop and Reverse (SAR) setup. Currently, the SAR dots are positioned below SHIB’s price.
The Parabolic SAR indicator tracks an asset’s price direction and identifies potential reversal points. When its dots rest under the asset’s price, it signals that the asset’s price has been rising and that the growth may continue in the short term.
Read more: Shiba Inu (SHIB) Price Prediction 2024/2025/2030
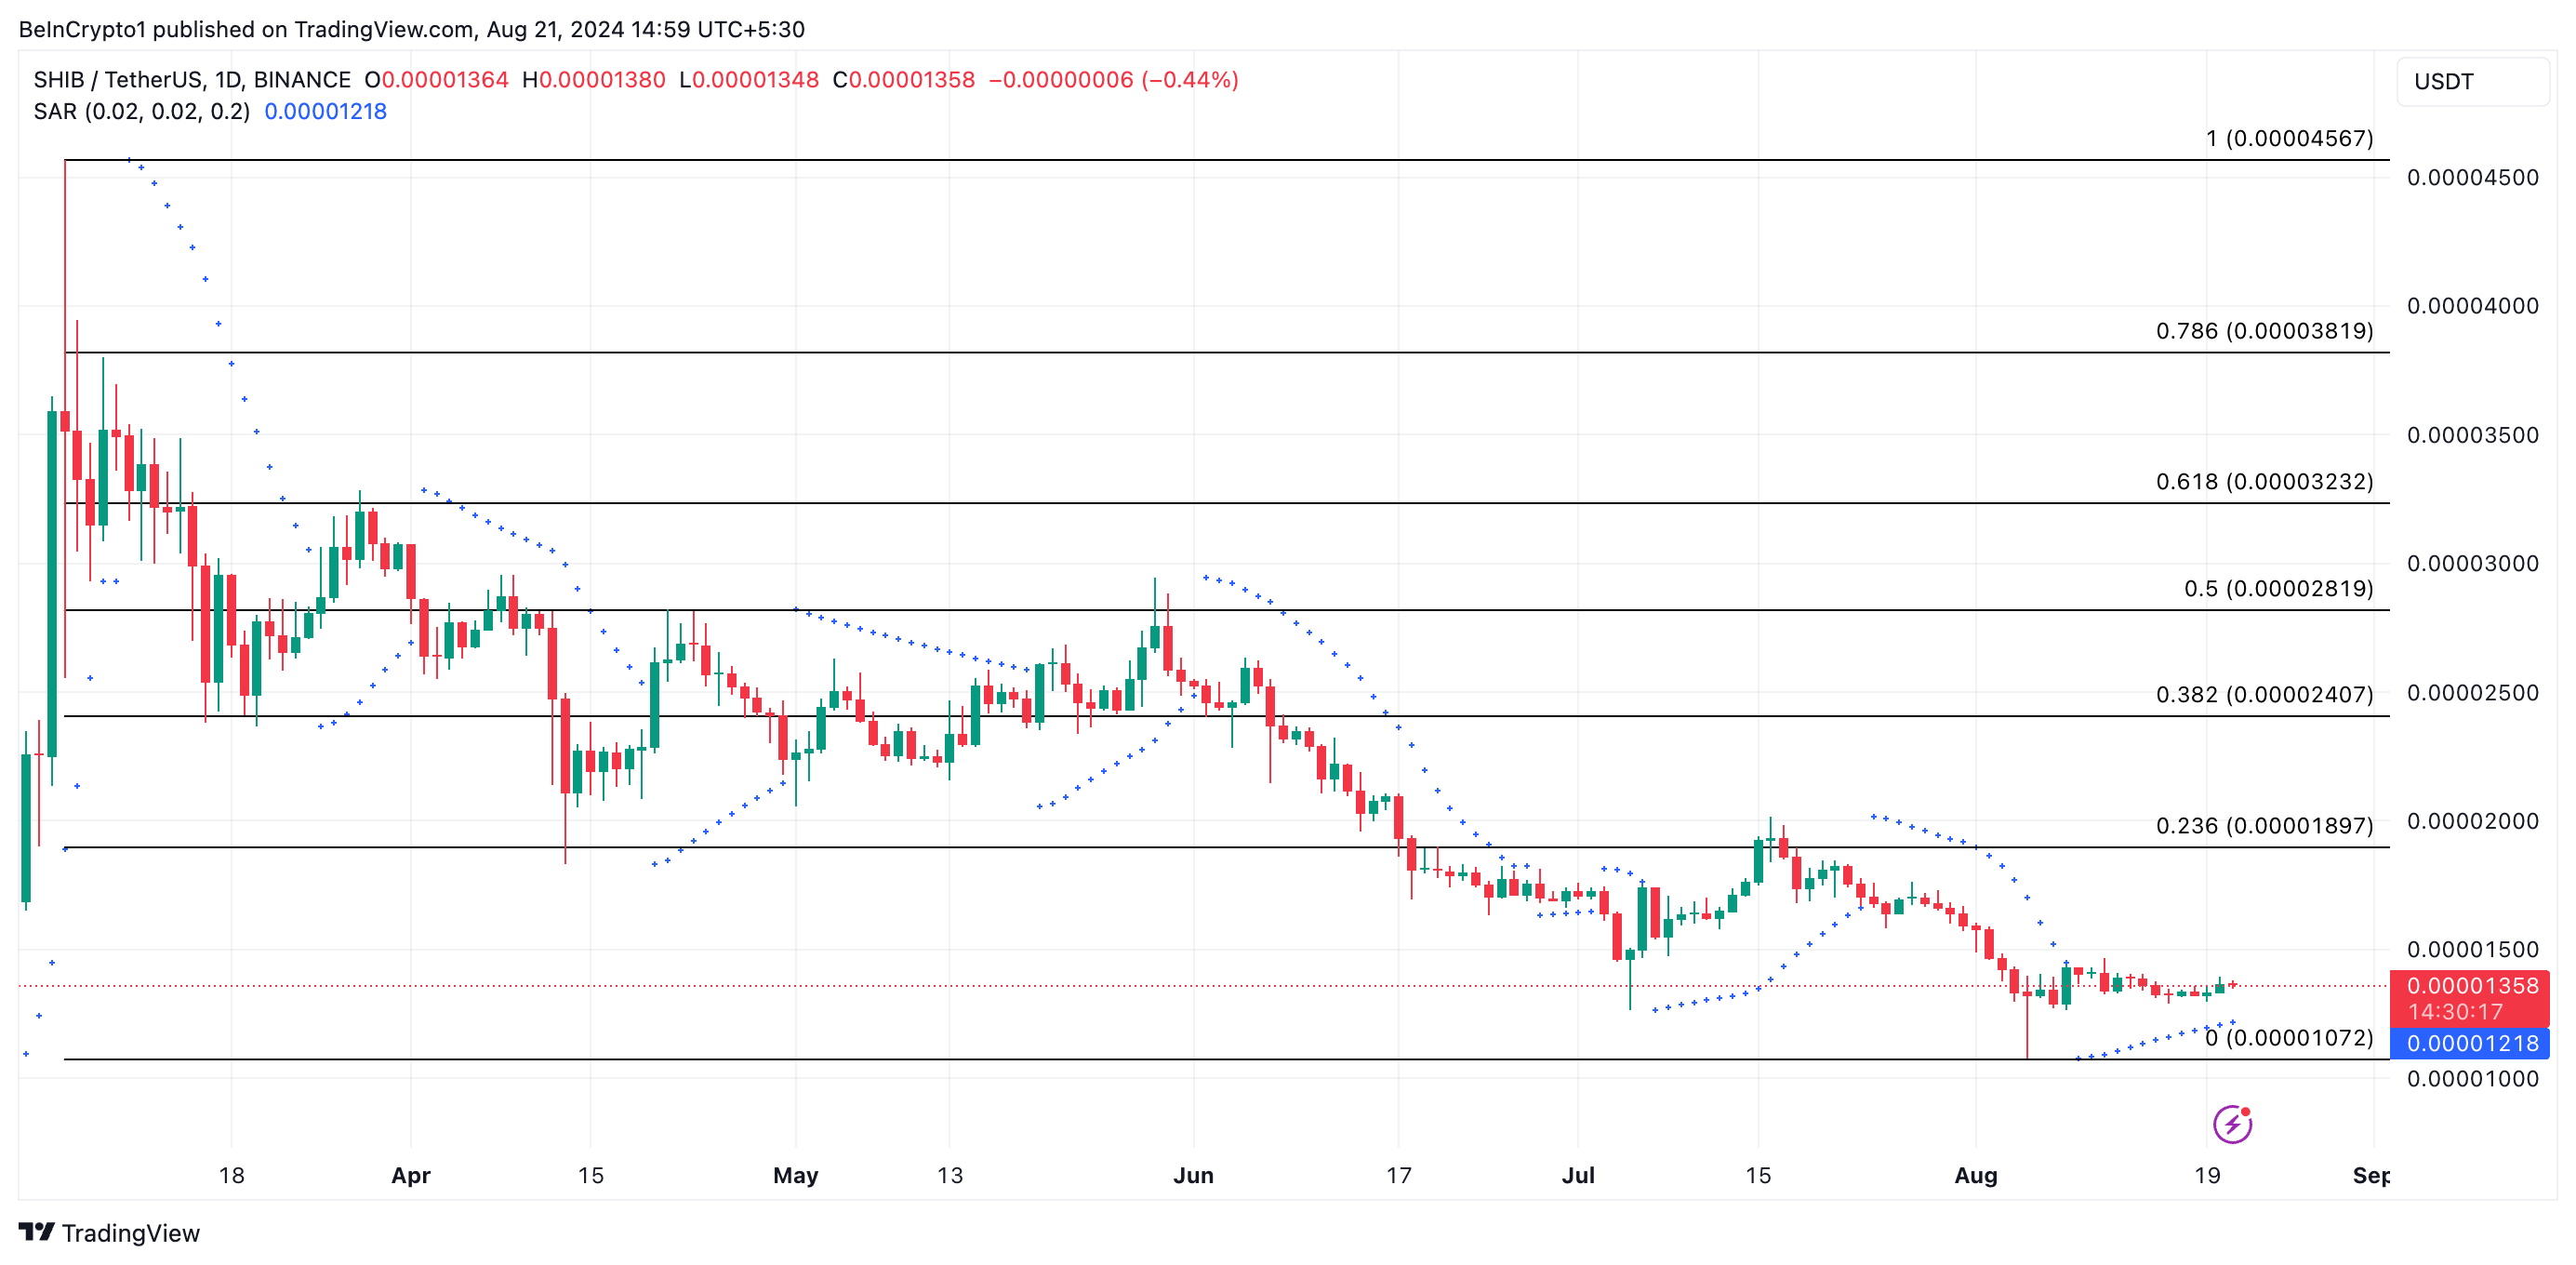
If buying pressure persists, SHIB will successfully break above its falling wedge. Following a successful retest of the breakout line, its price will rally toward $0.000018 and above.
However, if selling pressure mounts, SHIB’s price may drop to $0.000010.
Disclaimer
In line with the Trust Project guidelines, this price analysis article is for informational purposes only and should not be considered financial or investment advice. BeInCrypto is committed to accurate, unbiased reporting, but market conditions are subject to change without notice. Always conduct your own research and consult with a professional before making any financial decisions. Please note that our Terms and Conditions, Privacy Policy, and Disclaimers have been updated.


Amid growing geopolitical tensions and a fragile global macroeconomic backdrop, analysts are sounding alarms that the Fed is quietly injecting liquidity into the financial system.
While the Federal Reserve (Fed) has not announced a pivot, the liquidity says otherwise. The consequences reverberate across asset classes, from Treasury yields to Bitcoin’s $500 billion drawdown.
Treasury Turmoil and the $6.5 Trillion Time Bomb
The renewed trade war narrative is at the center of the storm. Last week, Chinese Foreign Ministry spokesperson Lin Jian declared Beijing would “fight to the end” against Donald Trump’s proposed tariffs, which now reach up to 104% on some Chinese goods.
This rhetoric is fierce, echoing China’s signature “wolf warrior” stance. However, behind it, the pressure is mounting.
“The Chinese people do not provoke trouble, but we are not afraid of it,” Lin told reporters.
With exports slowing and capital flight concerns rising, Beijing’s position may soon become more about economic survival than ideological posturing.
Under the surface, a high-stakes game of financial brinkmanship is underway. Veteran analyst Peter Duan believes Trump’s tariff pressure is ultimately aimed at lowering 10-year Treasury yields, as the US faces a staggering $6.5 trillion in debt coming due in the months ahead.
“Trump forces tariff wars to lower the 10Y Treasury rate…China dumps US Treasuries to push yield up,” Duan wrote.
In dumping Treasuries, China has escalated economic tensions and triggered unintended consequences. These include spiking yields and draining demand from bond markets just as the US needs refinancing the most.
Reverse Repo Collapse, Fed Quietly Injecting Liquidity?
The Fed, boxed in by inflation and fiscal strain, appears to have responded with stealth rather than headlines.
The Fed’s Reverse Repo Facility (RRP) is the clearest evidence of a quiet liquidity flood. Once peaking above $2.5 trillion in 2022, RRP balances have plunged to just $148 billion, representing a 94% drawdown.
“This isn’t hopium. This is actual liquidity being unchained. While people are screaming about tariffs, inflation, and ghost-of-SVB trauma… the biggest stealth easing since 2020 has been underway,” wrote Oz, founder of The Markets Unplugged.

The implication is seismic, as declining RRP balances mean money is re-entering the system. This fuels risk asset rallies as it translates to QE without calling it QE.
However, RRP is nearly exhausted, prompting warnings from analysts.
“Decline in RRP adds liquidity to the market. There is not much left in the RRP account meaning that it can’t provide much liquidity. There will be a short relief rally but no new ATHs this year,” an options trader noted.
However, Oz challenges that while RRP being nearly drained means the end of the passive tailwind, it does not necessarily mean the end of the rally.
The Fed’s Dilemma: Inflate or Break?
The Conscious Trader, a popular analyst on X (Twitter), outlines the stakes. He says that if the Fed lets liquidity dry up further, cascading deleveraging could trigger a full-blown crisis.
“Either way, a pullback is coming. If markets break first, the sell-off sets the stage for QE. If QE starts first, Smart Money sweeps the lows before liquidity pumps risk assets higher,” he notes.
This means that the Fed, resuming QE formally, would risk inflaming inflation or fueling bubbles.
Since April 2, Bitcoin’s market cap has shed over $500 billion, falling below $75,000 before a modest recovery. Altcoins have fared worse, hit by a double whammy of falling liquidity and macro fear.
BeInCrypto reported that the odds of formal QE returning in 2025 are climbing, which could mark a turning point for digital assets.
Liquidity cycles have historically dictated crypto boom and bust phases. In 2020, QE fueled the “everything rally,” with Bitcoin and altcoins reaching historic highs. If covert QE turns overt, a repeat performance may be on deck.
“You don’t need a rate cut. You’ve got a liquidity surge already happening… The liquidity says: ‘Grab your helmet. You’re about to chase green candles into ATHs’,” Oz added.
This aligns with Hayes’ recent prediction that Bitcoin could reach $250,000 if the Fed shifts to quantitative easing. Yet, crypto markets may be staring down another winter if the Fed hesitates or global liquidity fractures.
The Fed may not be talking, but silence does not mean inaction. With reverse repo nearly dry, trade tensions rising, and Treasury markets in flux, stealth liquidity injections appear to be the first move in a broader game.
The general sentiment among analysts is that whether this ends in another bull run or something far worse depends on how long the Fed can keep this quiet.
Disclaimer
In adherence to the Trust Project guidelines, BeInCrypto is committed to unbiased, transparent reporting. This news article aims to provide accurate, timely information. However, readers are advised to verify facts independently and consult with a professional before making any decisions based on this content. Please note that our Terms and Conditions, Privacy Policy, and Disclaimers have been updated.

Reason to trust
![]()
Strict editorial policy that focuses on accuracy, relevance, and impartiality
Created by industry experts and meticulously reviewed
The highest standards in reporting and publishing
Strict editorial policy that focuses on accuracy, relevance, and impartiality
Morbi pretium leo et nisl aliquam mollis. Quisque arcu lorem, ultricies quis pellentesque nec, ullamcorper eu odio.
Ethereum price failed to recover above $1,620 and dropped below $1,500. ETH is now consolidating losses and might face resistance near the $1,520 zone.
- Ethereum failed to stay above the $1,600 and $1,550 levels.
- The price is trading below $1,550 and the 100-hourly Simple Moving Average.
- There is a connecting bearish trend line forming with resistance at $1,520 on the hourly chart of ETH/USD (data feed via Kraken).
- The pair remains at risk of more losses if it fails to clear the $1,410 resistance zone.
Ethereum Price Recovery Fades
Ethereum price failed to stay above the $1,620 support zone and extended losses, like Bitcoin. ETH declined heavily below the $1,550 and $1,520 levels.
The bears even pushed the price below the $1,450 level. A low was formed at $1,384 and the price recently corrected some losses. There was a move above the $1,410 level. The price climbed above the 23.6% Fib retracement level of the downward move from the $1,617 swing high to the $1,384 low.
However, the bears are active near the $1,450 zone. Ethereum price is now trading below $1,500 and the 100-hourly Simple Moving Average. On the upside, the price seems to be facing hurdles near the $1,475 level.
The next key resistance is near the $1,500 level or the 50% Fib retracement level of the downward move from the $1,617 swing high to the $1,384 low. The first major resistance is near the $1,520 level. There is also a connecting bearish trend line forming with resistance at $1,520 on the hourly chart of ETH/USD.

A clear move above the $1,520 resistance might send the price toward the $1,560 resistance. An upside break above the $1,560 resistance might call for more gains in the coming sessions. In the stated case, Ether could rise toward the $1,620 resistance zone or even $1,650 in the near term.
Another Decline In ETH?
If Ethereum fails to clear the $1,520 resistance, it could start another decline. Initial support on the downside is near the $1,410 level. The first major support sits near the $1,385 zone.
A clear move below the $1,385 support might push the price toward the $1,320 support. Any more losses might send the price toward the $1,240 support level in the near term. The next key support sits at $1,120.
Technical Indicators
Hourly MACD – The MACD for ETH/USD is gaining momentum in the bearish zone.
Hourly RSI – The RSI for ETH/USD is now below the 50 zone.
Major Support Level – $1,410
Major Resistance Level – $1,520

The crypto market is facing massive volatility today, and amid this noise, some meme coins are able to pick up pace on recovery. One such coin is said to have ties with Tesla founder and US Department of Government Efficiency (DOGE) head Elon Musk.
BeInCrypto has analyzed two other meme coins for investors to watch and note which direction they are taking.
Retard Finder Coin (RFC)
- Launch Date – March 2025
- Total Circulating Supply – 961.43 Million RFC
- Maximum Supply – 1 Billion RFC
- Fully Diluted Valuation (FDV) – $39.83 Million
RFC price surged by 141% over the past 24 hours, continuing its uptrend this week. The meme coin gained attention after Elon Musk’s interactions with its official X (formerly Twitter) page. This triggered a speculative surge in interest, helping RFC capitalize on the increased attention and rising market sentiment.
Musk’s indirect association with Retard Finder Coin has sparked speculation, although no direct evidence confirms his involvement. Despite this uncertainty, RFC’s price has risen to $0.040. If the speculation continues, the altcoin could see further gains, potentially reaching the $0.050 resistance level in the short term.
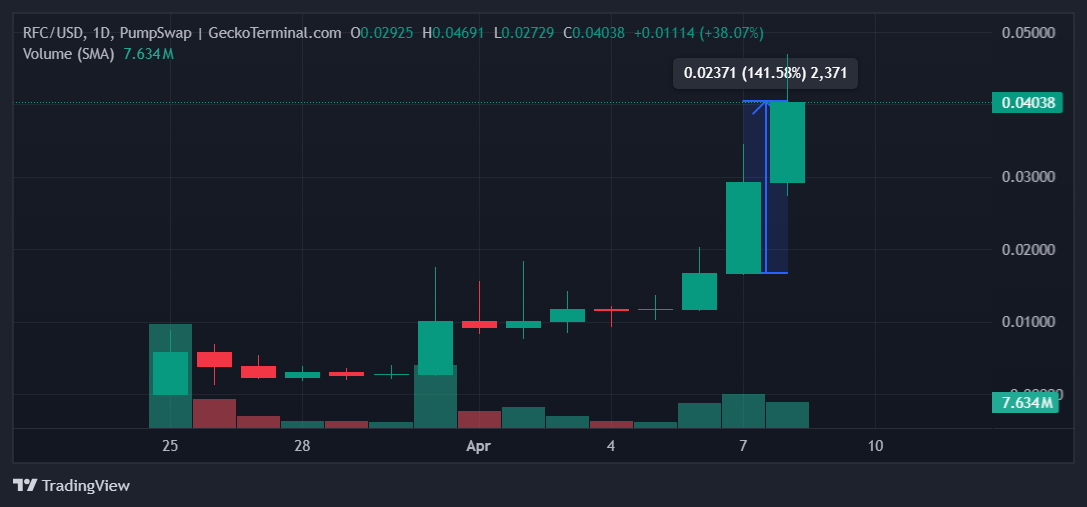
Despite its recent rise, RFC remains a meme coin with inherent volatility. The altcoin faces the risk of rapid selling by investors, which could lead to a quick price pullback. If this occurs, RFC might fall to $0.030 or even $0.020, making it crucial for investors to approach with caution.
Fartcoin (FARTCOIN)
- Launch Date – October 2024
- Total Circulating Supply – 999.99 Million FARTCOIN
- Maximum Supply – 1 Billion FARTCOIN
- Fully Diluted Valuation (FDV) – $588.26 Million
FARTCOIN saw a 32% rise in the last 24 hours, trading at $0.591. The meme coin is now nearing the resistance level of $0.600. If this momentum continues, FARTCOIN could break through this barrier and continue its upward movement, heading toward new highs in the coming sessions.
In the past, the $0.600 resistance has halted FARTCOIN’s rally, preventing further price gains. However, if the current bullish trend persists, FARTCOIN could overcome this barrier and rise toward $0.693. This level marks the next target for the altcoin, supported by positive market sentiment and strong investor interest.
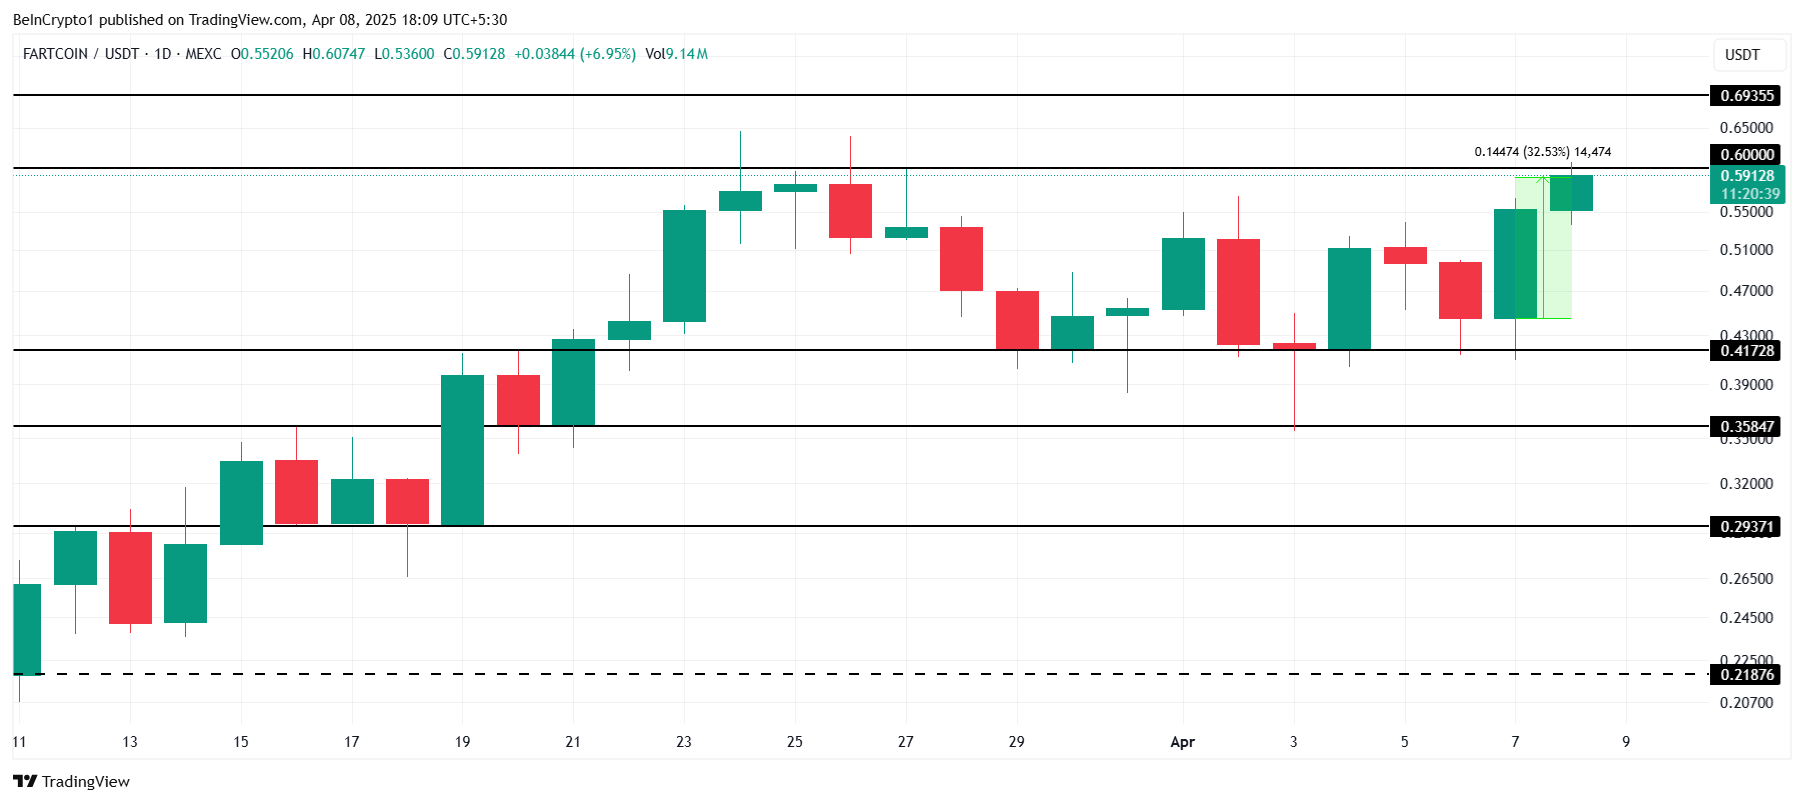
If the resistance level proves too strong, FARTCOIN may experience a pullback. A failure to breach $0.600 could lead to a decline back to $0.417 or even lower, erasing recent gains. This scenario would invalidate the bullish outlook and extend the downtrend if selling pressure intensifies.
Mog Coin (MOG)
- Launch Date – July 2023
- Total Circulating Supply – 390.5 Trillion MOG
- Maximum Supply – 420 Trillion MOG
- Fully Diluted Valuation (FDV) – $135.64 Million
MOG price surged by 25% in the last 24 hours, providing relief after a steep 50% decline during March’s end. This recovery signals the potential for further growth as the meme coin attempts to regain momentum and distance itself from recent losses. The recent rise could lead to more positive movements.
At the time of writing, MOG is trading at $0.000000346, just below the key resistance level of $0.000000370. If it breaches this level, MOG could gain enough momentum to push toward $0.000000433. This breakthrough would mark a significant recovery and extend its upward trend further in the coming days.
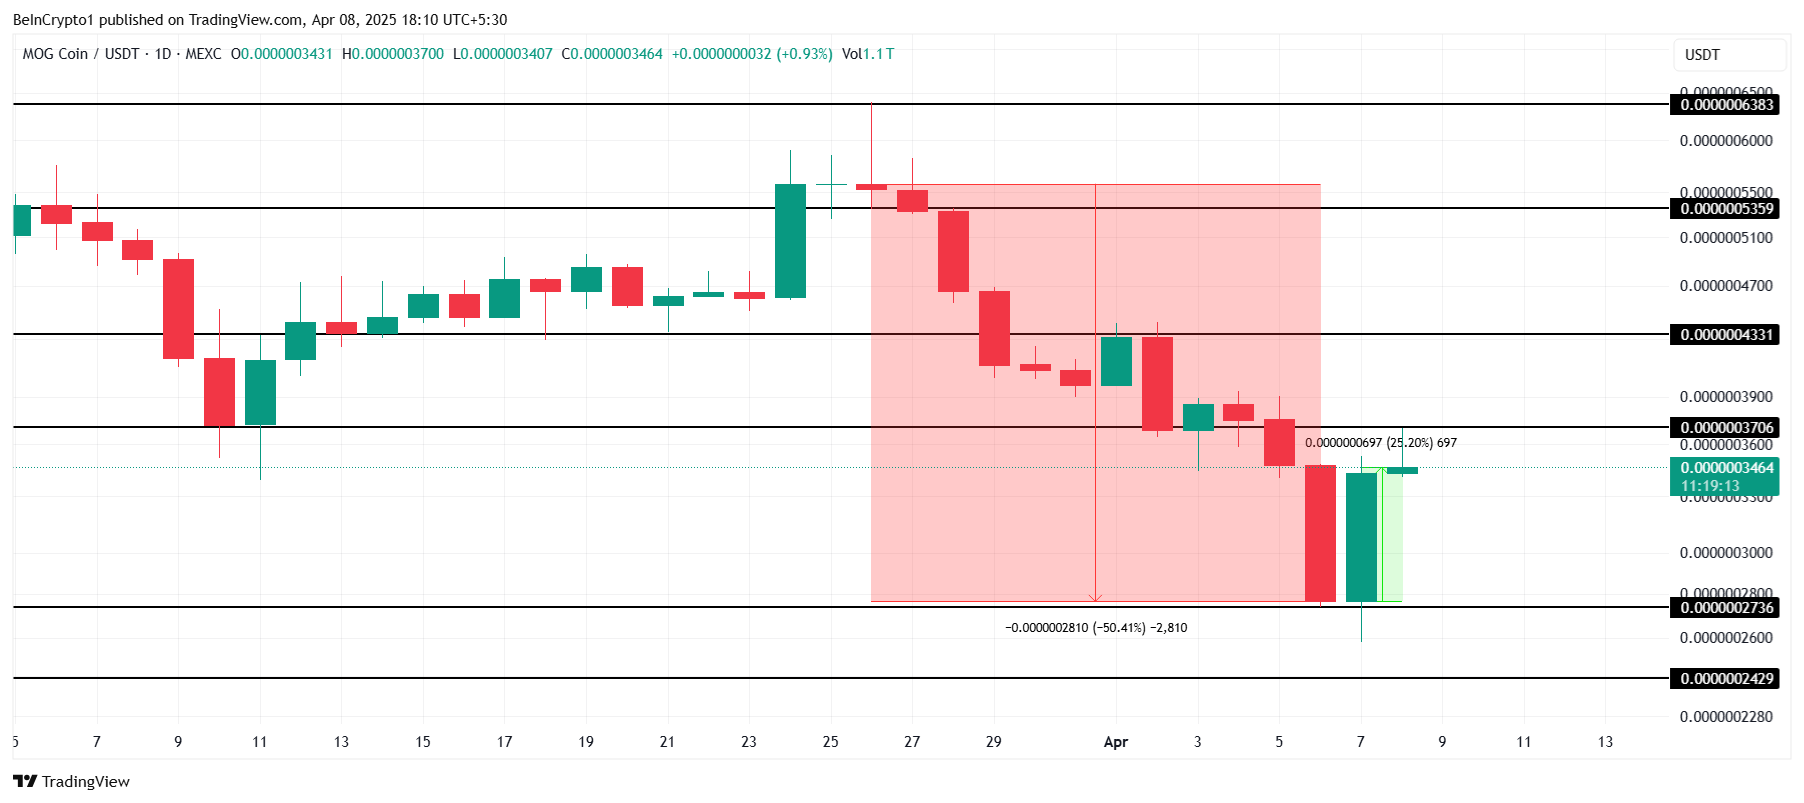
However, if MOG fails to breach $0.000000370, the altcoin may experience a decline. The next major support lies at $0.000000273, and if this level is tested, it could wipe out recent gains. In such a scenario, the bullish outlook would be invalidated, signaling a continued struggle for the meme coin.
Disclaimer
In line with the Trust Project guidelines, this price analysis article is for informational purposes only and should not be considered financial or investment advice. BeInCrypto is committed to accurate, unbiased reporting, but market conditions are subject to change without notice. Always conduct your own research and consult with a professional before making any financial decisions. Please note that our Terms and Conditions, Privacy Policy, and Disclaimers have been updated.

Shiba Inu Burn Rate Shoots Up 1500%, Can SHIB Price Recover After Bloodbath?

Fed Reverse Repo Facility Drains, Stealth Liquidity Injections Seen
How Trump’s Tariffs Threaten Bitcoin Mining in the US

Ethereum Price Hit Hard—10% Drop Sparks Selloff Fears
Analyst Reveals What Could Come Next

RFC, FARTCOIN, MOG Lead Gains

2.52 Million Altcoins Are Ruining Crypto’s Future

Animoca Brands Valuation Tanks 75% In Two Years, Here’s Why

Crypto exchange BingX hacked for $43 million

Are The Big Players Losing Interest?

Hong Kong’s Securities Association Tips Authorities On Crypto Self-Regulation

Coinbase cbBTC Set to go Live on Solana
2.52 Million Altcoins Are Ruining Crypto’s Future
Animoca Brands Valuation Tanks 75% In Two Years, Here’s Why
Crypto exchange BingX hacked for $43 million
Are The Big Players Losing Interest?
Hong Kong’s Securities Association Tips Authorities On Crypto Self-Regulation
Coinbase cbBTC Set to go Live on Solana
-
 Altcoin23 hours ago
John Deaton Highlights Ripple’s Journey from Legal Struggle To ETF Launches
-
 Altcoin22 hours ago
Bitcoin +6%, Ethereum +10% Amid Tariff Uncertainty; FARTCOIN Skyrockets +38%, Recovery or Bubble?
-

 Ethereum21 hours ago
Here’s Where Ethereum’s Last Line Of Defense Lies, According To On-Chain Data
-

 Market23 hours ago
Sui’s Community Passport & More This Week
-

 Market22 hours ago
Bitcoin Price Recovery In Play—But Major Hurdles Loom Large
-
 Altcoin21 hours ago
Why Curve Finance (CRV) Price Is Up 10% Despite Founder Dumping Heavily?
-
Ethereum23 hours ago
Ethereum MVRV Drops To Lowest Since December 2022: Bottom Signal?
-

 Bitcoin18 hours ago
Bitcoin Whale Activity Peaks Amid Market Uncertainty