Market
Bitcoin Stuck in Place as Tariffs and Charts Point Both Ways

Bitcoin (BTC) enters April on shaky footing. It is caught between fading bearish momentum and rising uncertainty ahead of Wednesday’s highly anticipated “Liberation Day” tariff announcement. Technical indicators like the DMI, Ichimoku Cloud, and EMA lines show mixed signals, with early signs of buyer strength emerging.
The market remains range-bound, with both downside tests and breakout rallies on the table depending on macro developments. With the JOLTS report due today and tariff clarity still pending, Bitcoin’s next major move could be just around the corner.
BTC DMI Shows Buyers Took Control, But Will It Last?
Bitcoin’s Directional Movement Index (DMI) is flashing potential signs of a momentum shift. The Average Directional Index (ADX), which measures the strength of a trend regardless of its direction, has dropped to 28.59 from 40.38 yesterday. That indicates that the current downtrend may be losing steam.
Typically, an ADX reading above 25 signals a strong trend, while values below that suggest a weakening or sideways market. Although 28.59 still shows moderate trend strength, the drop signals fading momentum.
Meanwhile, the +DI (positive directional indicator) has surged to 23.75 from 9.35, while the -DI (negative directional indicator) has fallen to 17.88 from 34.58—suggesting bullish pressure is beginning to build.

This crossover between the +DI and -DI could signal an early trend reversal, especially if confirmed by further price action and volume. However, it’s important to note that Bitcoin remains in a broader downtrend for now.
Market participants are also eyeing today’s JOLTS report, a key indicator of U.S. job openings. A stronger-than-expected report could lift the dollar and apply pressure to crypto markets. On the other hand, weaker data could increase expectations of rate cuts, potentially boosting Bitcoin and other risk assets.
With directional indicators shifting and macroeconomic data in play, Bitcoin’s next move could be heavily influenced by external catalysts. Recently, BlackRock CEO Larry Fink stated that Bitcoin could take the dollar’s role as the world reserve currency.
Bitcoin Ichimoku Cloud Shows The Bearish Trend Is Still Here
Bitcoin’s Ichimoku Cloud chart reveals a market still under bearish pressure, despite recent signs of short-term recovery. The price is currently testing the Kijun-sen (red line), which acts as a key resistance level.
While the Tenkan-sen (blue line) is starting to flatten and curl upward—often a sign of momentum shift—the fact that the price remains below the Kumo (cloud) indicates that the broader trend is still bearish.
The cloud ahead is red and descending, suggesting continued downward pressure in the near term.
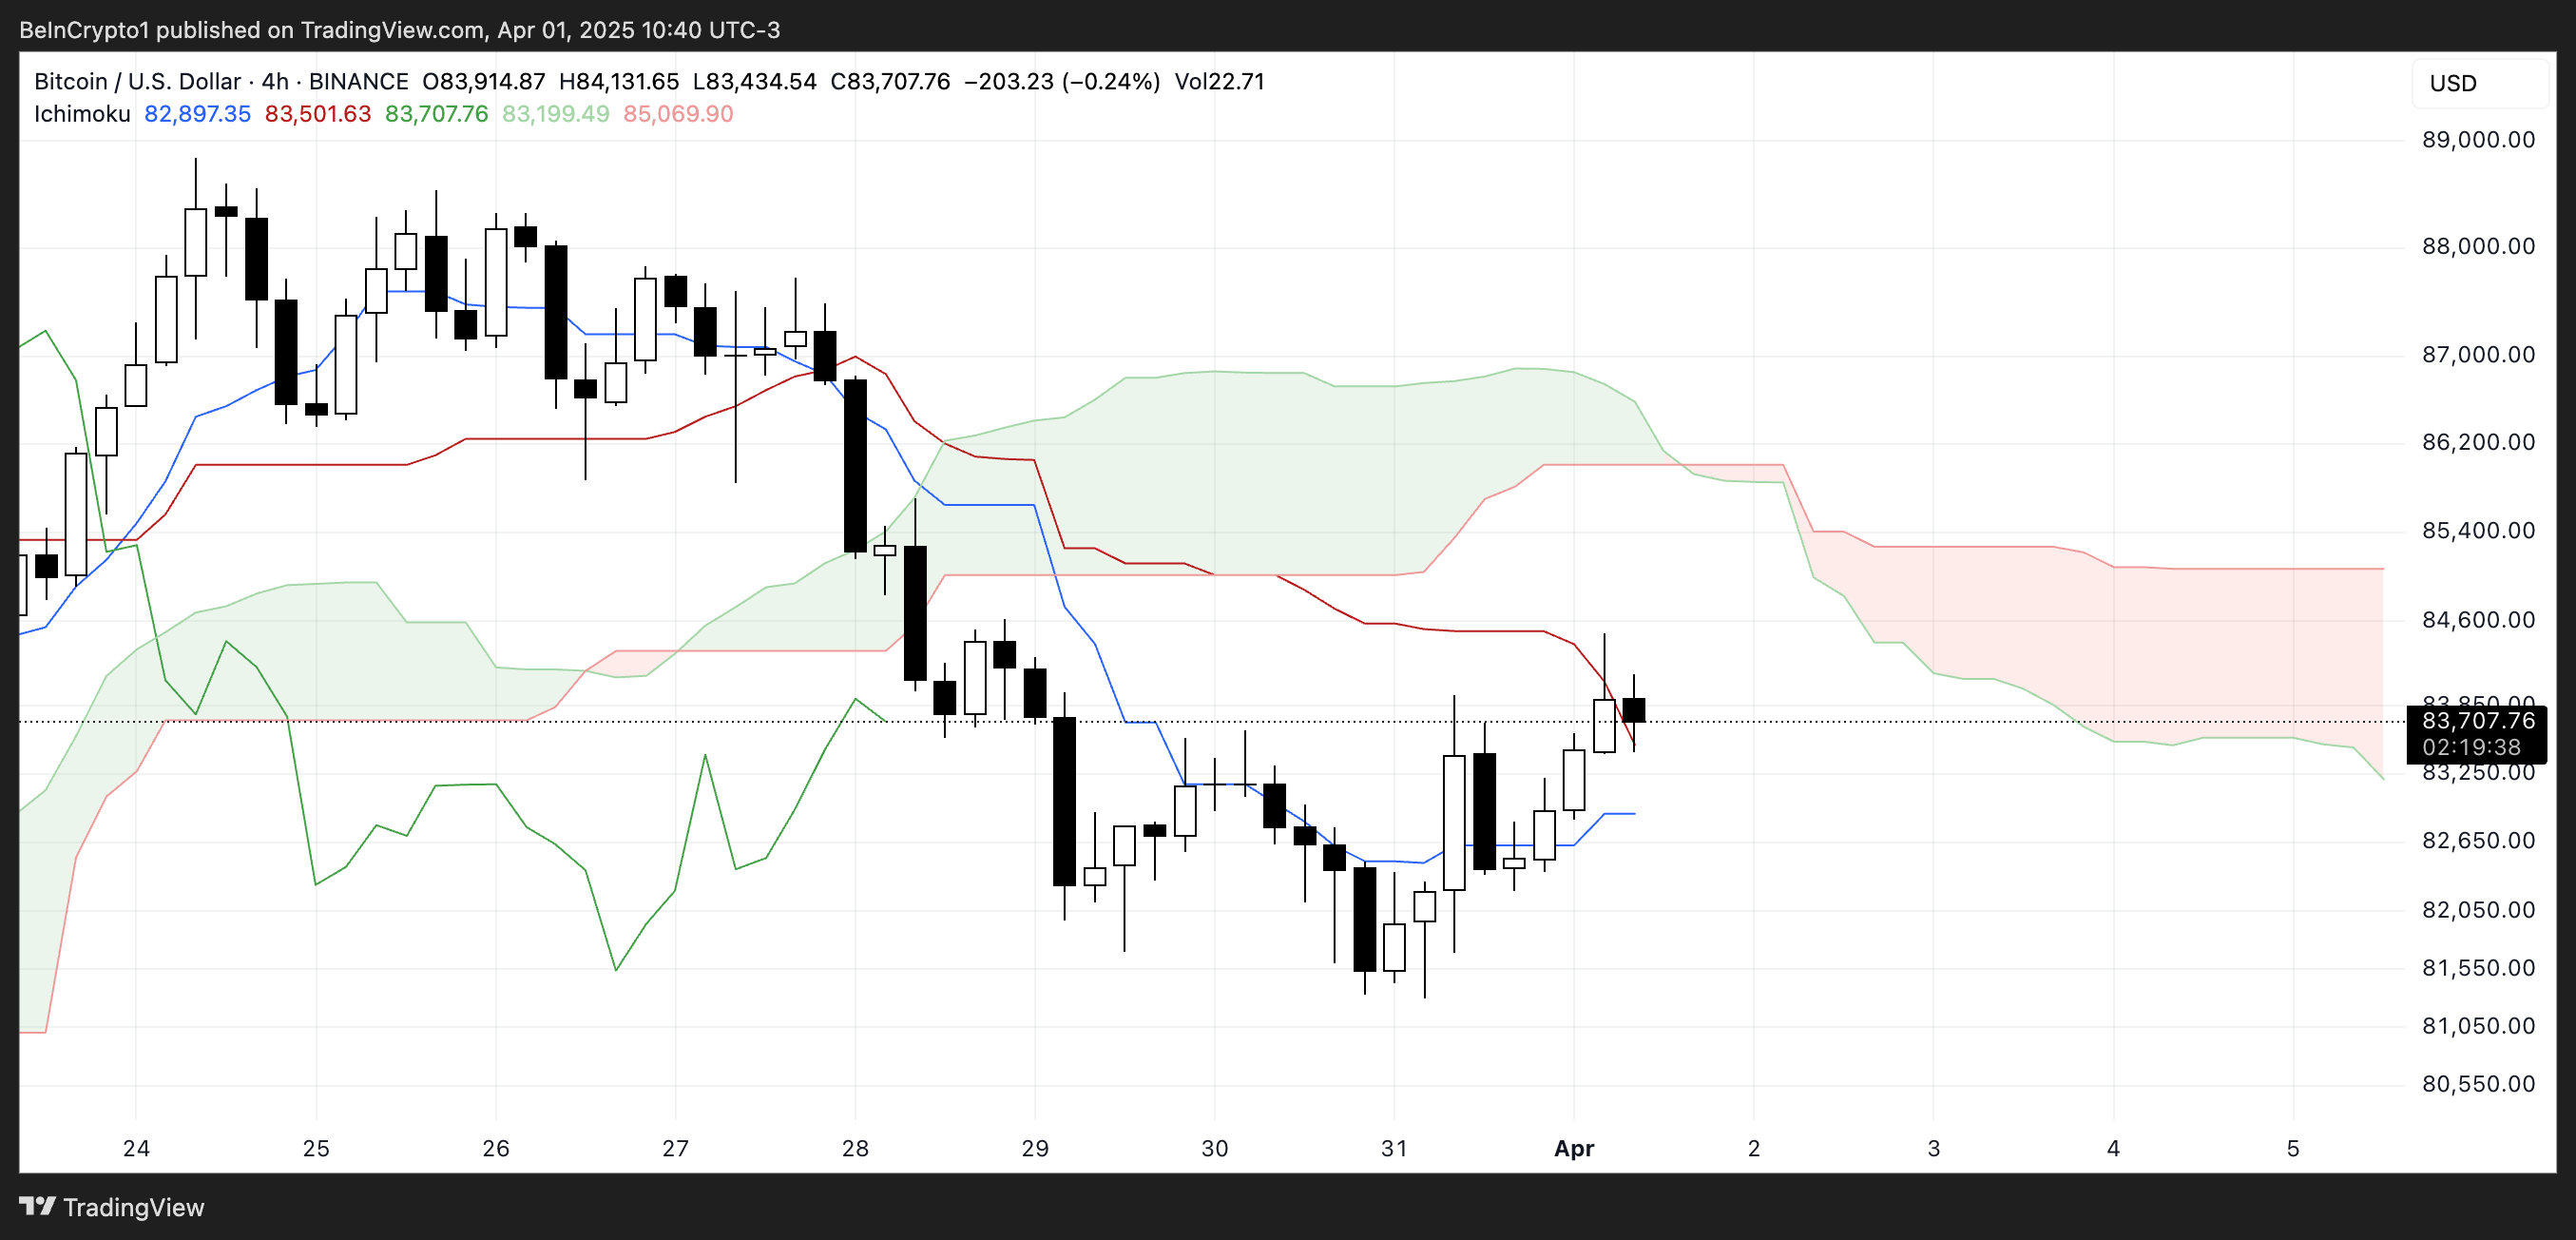
However, the price has briefly pushed into the cloud’s lower boundary, indicating a potential challenge to the bearish structure.
For a stronger trend reversal signal, Bitcoin would need to break above the cloud and see a bullish Kumo twist form. Until then, the Ichimoku setup shows a cautious recovery at best.
Liberation Day Could Strongly Influence Bitcoin Price
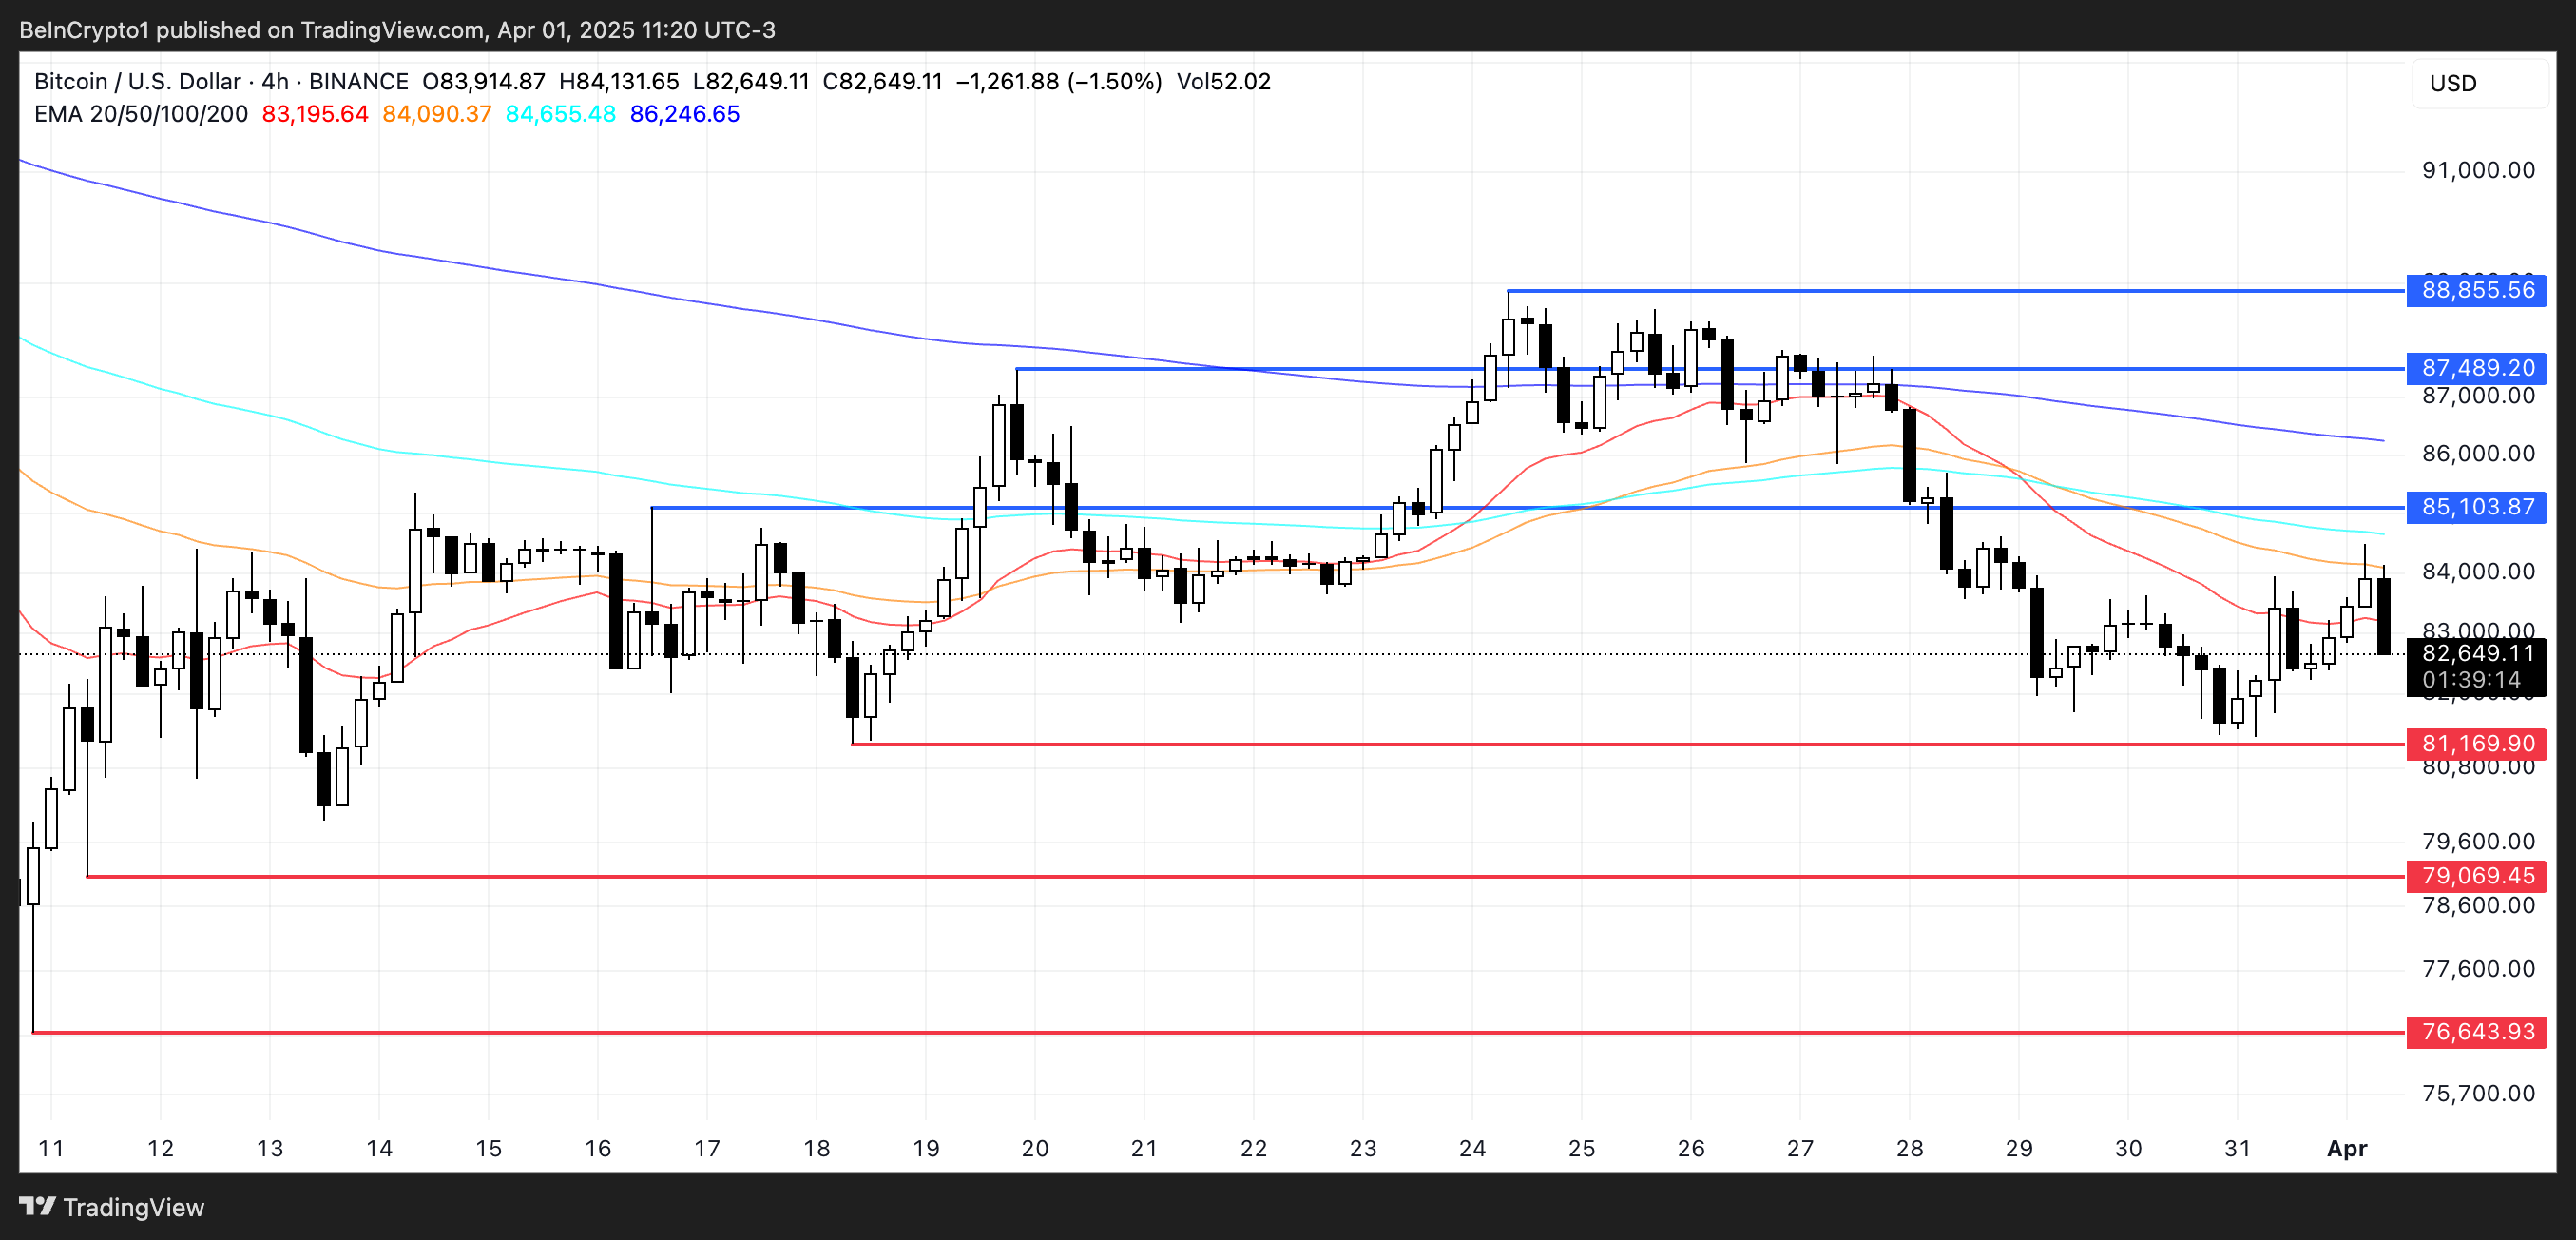
Bitcoin’s EMA lines remain bearish. Its shorter-term averages are still below the longer-term ones, an indication that downward momentum persists.
This setup suggests sellers continue to control the trend, and unless reversed, Bitcoin price could revisit key support zones. If the current downtrend accelerates, it may first test support around $81,169. If that level fails to hold, deeper drops toward $79,069 or even $76,643 could follow.
Nic Puckrin, crypto analyst and founder of The Coin Bureau told BeInCrypto the market’s heightened uncertainty ahead of the so-called “Liberation Day” tariffs. He notes that Bitcoin is equally positioned for a sharp move in either direction. It could possibly dip to $73,000 or surging toward $88,000:
“As Liberation Day approaches, the uncertainty around the magnitude of the tariffs is keeping Bitcoin and other risk assets in limbo. (…) Until there is more clarity around tariffs, this range-bound pattern will continue, but if we get softer news than feared or some sort of concessions, we could see a breakout from the current trading pattern. If we do, $88,000 is the level to watch in the short term, but we would need to see a marked increase in volume for this to indicate an extended rally.”
He defends that a tariff shock could make BTC test levels around $73,000:
“If there is a tariffs shock, conversely, we could see BTC breaking down toward $79,000 in the short term, or even further down to the next support level at $73,000 if extreme fear grips markets.“ – Nic told BeInCrypto.
Still, if Bitcoin manages to flip the trend and gain upward momentum, a climb toward resistance at $85,103 would be the first target. Breaking above that could open the path to higher levels at $87,489 and $88,855.
Disclaimer
In line with the Trust Project guidelines, this price analysis article is for informational purposes only and should not be considered financial or investment advice. BeInCrypto is committed to accurate, unbiased reporting, but market conditions are subject to change without notice. Always conduct your own research and consult with a professional before making any financial decisions. Please note that our Terms and Conditions, Privacy Policy, and Disclaimers have been updated.
Market
XRP Battle Heats Up—Can Bulls Turn the Tide?

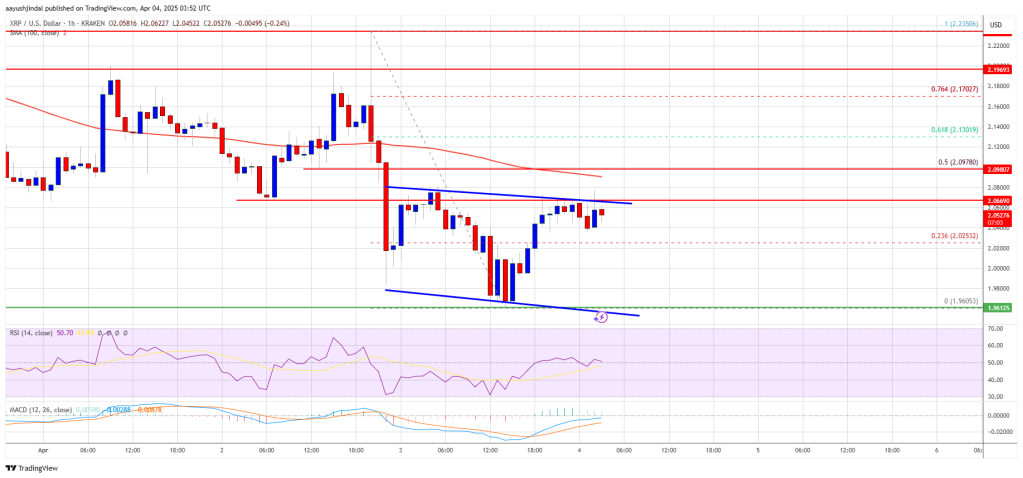
XRP price started a fresh decline below the $2.050 zone. The price is now consolidating and might face hurdles near the $2.10 level.
- XRP price started a fresh decline below the $2.120 and $2.050 levels.
- The price is now trading below $2.10 and the 100-hourly Simple Moving Average.
- There is a short-term declining channel forming with resistance at $2.0680 on the hourly chart of the XRP/USD pair (data source from Kraken).
- The pair might extend losses if it fails to clear the $2.10 resistance zone.
XRP Price Attempts Recovery
XRP price extended losses below the $2.050 support level, like Bitcoin and Ethereum. The price declined below the $2.00 and $1.980 support levels. A low was formed at $1.960 and the price is attempting a recovery wave.
There was a move above the $2.00 and $2.020 levels. The price surpassed the 23.6% Fib retracement level of the downward move from the $2.235 swing high to the $1.960 low. However, the bears are active below the $2.10 resistance zone.
The price is now trading below $2.10 and the 100-hourly Simple Moving Average. On the upside, the price might face resistance near the $2.070 level. There is also a short-term declining channel forming with resistance at $2.0680 on the hourly chart of the XRP/USD pair.
The first major resistance is near the $2.10 level. It is near the 50% Fib retracement level of the downward move from the $2.235 swing high to the $1.960 low. The next resistance is $2.120.
A clear move above the $2.120 resistance might send the price toward the $2.180 resistance. Any more gains might send the price toward the $2.2350 resistance or even $2.40 in the near term. The next major hurdle for the bulls might be $2.50.
Another Decline?
If XRP fails to clear the $2.10 resistance zone, it could start another decline. Initial support on the downside is near the $2.00 level. The next major support is near the $1.960 level.
If there is a downside break and a close below the $1.960 level, the price might continue to decline toward the $1.920 support. The next major support sits near the $1.90 zone.
Technical Indicators
Hourly MACD – The MACD for XRP/USD is now losing pace in the bearish zone.
Hourly RSI (Relative Strength Index) – The RSI for XRP/USD is now above the 50 level.
Major Support Levels – $2.00 and $1.960.
Major Resistance Levels – $2.10 and $2.120.
Market
Ethereum Price Losing Ground—Is a Drop to $1,550 Inevitable?

Reason to trust

Strict editorial policy that focuses on accuracy, relevance, and impartiality
Created by industry experts and meticulously reviewed
The highest standards in reporting and publishing
Strict editorial policy that focuses on accuracy, relevance, and impartiality
Morbi pretium leo et nisl aliquam mollis. Quisque arcu lorem, ultricies quis pellentesque nec, ullamcorper eu odio.
Ethereum price attempted a recovery wave above the $1,820 level but failed. ETH is now consolidating losses and might face resistance near the $1,840 zone.
- Ethereum failed to stay above the $1,850 and $1,840 levels.
- The price is trading below $1,840 and the 100-hourly Simple Moving Average.
- There is a short-term bearish trend line forming with resistance at $1,810 on the hourly chart of ETH/USD (data feed via Kraken).
- The pair must clear the $1,820 and $1,840 resistance levels to start a decent increase.
Ethereum Price Dips Further
Ethereum price failed to stay above the $1,800 support zone and extended losses, like Bitcoin. ETH traded as low as $1,751 and recently corrected some gains. There was a move above the $1,780 and $1,800 resistance levels.
The bulls even pushed the price above the 23.6% Fib retracement level of the downward move from the $1,955 swing high to the $1,751 low. However, the bears are active near the $1,820 zone. The price is now consolidating and facing many hurdles.
Ethereum price is now trading below $1,820 and the 100-hourly Simple Moving Average. On the upside, the price seems to be facing hurdles near the $1,810 level. There is also a short-term bearish trend line forming with resistance at $1,810 on the hourly chart of ETH/USD.
The next key resistance is near the $1,840 level or the 50% Fib retracement level of the downward move from the $1,955 swing high to the $1,751 low at $1,850. The first major resistance is near the $1,880 level.
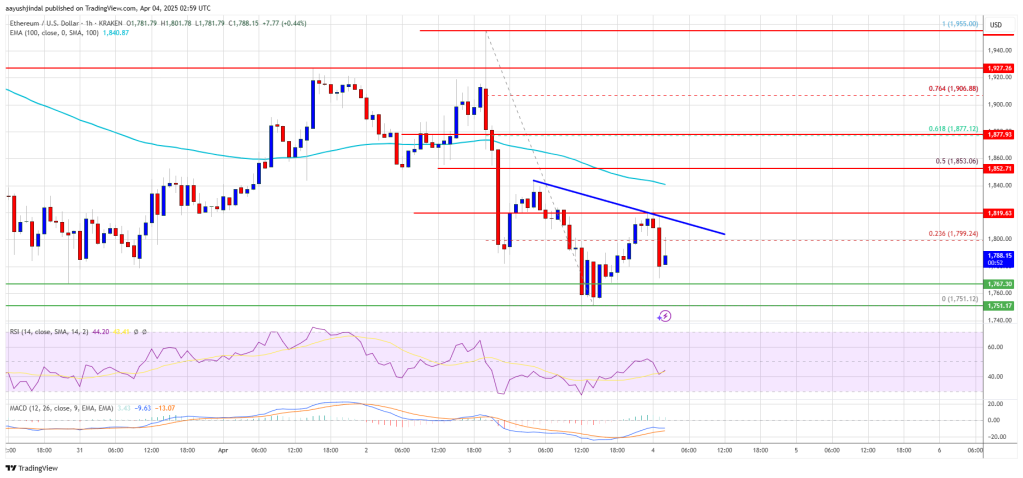
A clear move above the $1,880 resistance might send the price toward the $1,920 resistance. An upside break above the $1,920 resistance might call for more gains in the coming sessions. In the stated case, Ether could rise toward the $2,000 resistance zone or even $2,050 in the near term.
Another Decline In ETH?
If Ethereum fails to clear the $1,850 resistance, it could start another decline. Initial support on the downside is near the $1,765 level. The first major support sits near the $1,750 zone.
A clear move below the $1,750 support might push the price toward the $1,720 support. Any more losses might send the price toward the $1,680 support level in the near term. The next key support sits at $1,620.
Technical Indicators
Hourly MACD – The MACD for ETH/USD is gaining momentum in the bearish zone.
Hourly RSI – The RSI for ETH/USD is now below the 50 zone.
Major Support Level – $1,750
Major Resistance Level – $1,850
Market
Bitcoin Price Still In Trouble—Why Recovery Remains Elusive

Reason to trust

Strict editorial policy that focuses on accuracy, relevance, and impartiality
Created by industry experts and meticulously reviewed
The highest standards in reporting and publishing
Strict editorial policy that focuses on accuracy, relevance, and impartiality
Morbi pretium leo et nisl aliquam mollis. Quisque arcu lorem, ultricies quis pellentesque nec, ullamcorper eu odio.
Bitcoin price started a recovery wave from the $81,200 zone. BTC is consolidating losses and facing hurdles near the $83,500 resistance level.
- Bitcoin started a decent recovery wave above the $82,200 zone.
- The price is trading below $83,200 and the 100 hourly Simple moving average.
- There is a connecting bearish trend line forming with resistance at $83,500 on the hourly chart of the BTC/USD pair (data feed from Kraken).
- The pair could start another increase if it clears the $83,500 zone.
Bitcoin Price Faces Resistance
Bitcoin price extended losses below the $82,500 support zone and tested the $81,200 zone. BTC formed a base and recently started a decent recovery wave above the $82,200 resistance zone.
The bulls were able to push the price above the $82,500 and $83,000 resistance levels. The price even tested the 23.6% Fib retracement level of the recent decline from the $89,042 swing high to the $81,177 low. However, the price is struggling to continue higher.
Bitcoin price is now trading below $83,500 and the 100 hourly Simple moving average. On the upside, immediate resistance is near the $83,200 level. The first key resistance is near the $83,500 level. There is also a connecting bearish trend line forming with resistance at $83,500 on the hourly chart of the BTC/USD pair.
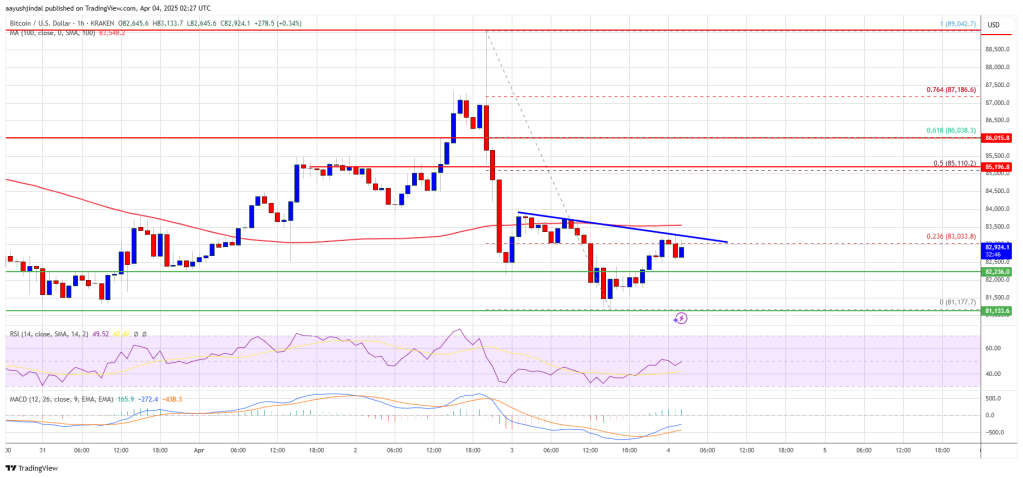
The next key resistance could be $84,500. A close above the $84,500 resistance might send the price further higher. In the stated case, the price could rise and test the $85,500 resistance level. Any more gains might send the price toward the $86,000 level or 61.8% Fib retracement level of the recent decline from the $89,042 swing high to the $81,177 low.
Another Decline In BTC?
If Bitcoin fails to rise above the $83,500 resistance zone, it could start a fresh decline. Immediate support on the downside is near the $82,200 level. The first major support is near the $81,200 level.
The next support is now near the $80,500 zone. Any more losses might send the price toward the $80,000 support in the near term. The main support sits at $78,800.
Technical indicators:
Hourly MACD – The MACD is now losing pace in the bearish zone.
Hourly RSI (Relative Strength Index) – The RSI for BTC/USD is now below the 50 level.
Major Support Levels – $82,200, followed by $81,200.
Major Resistance Levels – $83,500 and $85,000.
-

 Market20 hours ago
IP Token Price Surges, but Weak Demand Hints at Reversal
-

 Market23 hours ago
Ethereum Price Recovery Stalls—Bears Keep Price Below $2K
-

 Altcoin22 hours ago
VanEck Seeks BNB ETF Approval—Big Win For Binance?
-

 Market16 hours ago
Bitcoin’s Future After Trump Tariffs
-

 Altcoin21 hours ago
Binance Issues Key Announcement On StakeStone TGE; Here’s All
-

 Altcoin20 hours ago
Movimiento millonario de Solana, SOLX es la mejor opción
-

 Ethereum19 hours ago
Ethereum Trading In ‘No Man’s Land’, Breakout A ‘Matter Of Time’?
-

 Market18 hours ago
10 Altcoins at Risk of Binance Delisting


