
Market
Bitcoin Price On The Rise: Is The $70K Mark Within Reach?

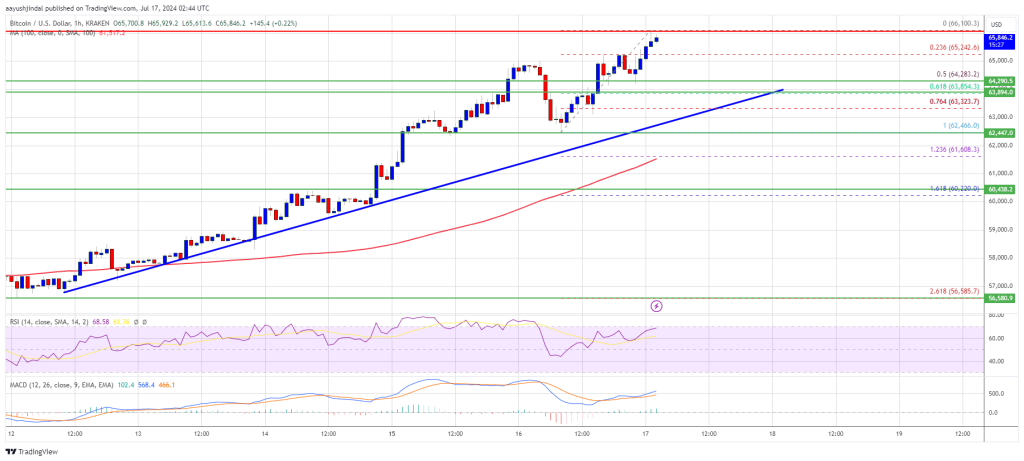
Bitcoin price gained over 15% and broke the $65,000 resistance level. BTC is still showing positive signs and might attempt to move above the $66,000 level.
- Bitcoin extended its increase above the $65,000 resistance zone.
- The price is trading above $64,500 and the 100 hourly Simple moving average.
- There is a key bullish trend line forming with support at $63,850 on the hourly chart of the BTC/USD pair (data feed from Kraken).
- The pair might continue to move up if it breaks the $66,000 resistance.
Bitcoin Price Extends Increase, Bulls In Action
Bitcoin price remained in a bullish zone above the $62,500 and $63,500 resistance levels. BTC was able to surpass the $64,000 level to extend its increase. The bulls even pushed the price toward the $66,000 zone.
A high was formed at $66,100 and the price is now consolidating gains. It is trading well above the 23.6% Fib retracement level of the upward move from the $62,466 swing low to the $66,100 high. There is also a key bullish trend line forming with support at $63,850 on the hourly chart of the BTC/USD pair.
Bitcoin price is now trading above $64,500 and the 100 hourly Simple moving average. If there is an upside continuation, the price could face resistance near the $66,000 level. The first key resistance is near the $66,500 level.
A clear move above the $66,500 resistance might spark more bullish moves in the coming sessions. The next key resistance could be $67,200. The next major hurdle sits at $68,000. A close above the $68,000 resistance might push the price further higher. In the stated case, the price could rise and test the $70,000 resistance.
Are Dips Supported In BTC?
If Bitcoin fails to climb above the $66,000 resistance zone, it could start a downside correction. Immediate support on the downside is near the $66,000 level.
The first major support is $64,250 and the 50% Fib retracement level of the upward move from the $62,466 swing low to the $66,100 high. The next support is now near $63,650 and the trend line. Any more losses might send the price toward the $62,500 support zone in the near term.
Technical indicators:
Hourly MACD – The MACD is now gaining pace in the bullish zone.
Hourly RSI (Relative Strength Index) – The RSI for BTC/USD is now above the 50 level.
Major Support Levels – $64,250, followed by $63,850.
Major Resistance Levels – $66,000, and $67,200.


Berachain (BERA) is under heavy pressure, down 50% over the last seven days as technical indicators continue flashing warning signs. Momentum remains firmly bearish, with the RSI stuck deep in oversold territory and the DMI signaling that sellers are still in control.
The EMA setup also points to continued downside, raising the risk that BERA could break below $3.80 and hit new all-time lows. However, if bulls manage to step in, key resistance levels at $4.44 and $4.78 could come into play, opening the door for a potential recovery.
BERA RSI Is Struggling Below 30
Berachain’s RSI (Relative Strength Index) is currently sitting at 24.19, having remained below the oversold threshold of 30 since yesterday.
This persistent weakness in RSI indicates sustained bearish pressure, with the token struggling to regain bullish momentum.
Notably, BERA’s RSI has been below the neutral 50 mark since April 3, suggesting that the broader trend has been skewed to the downside for several days.
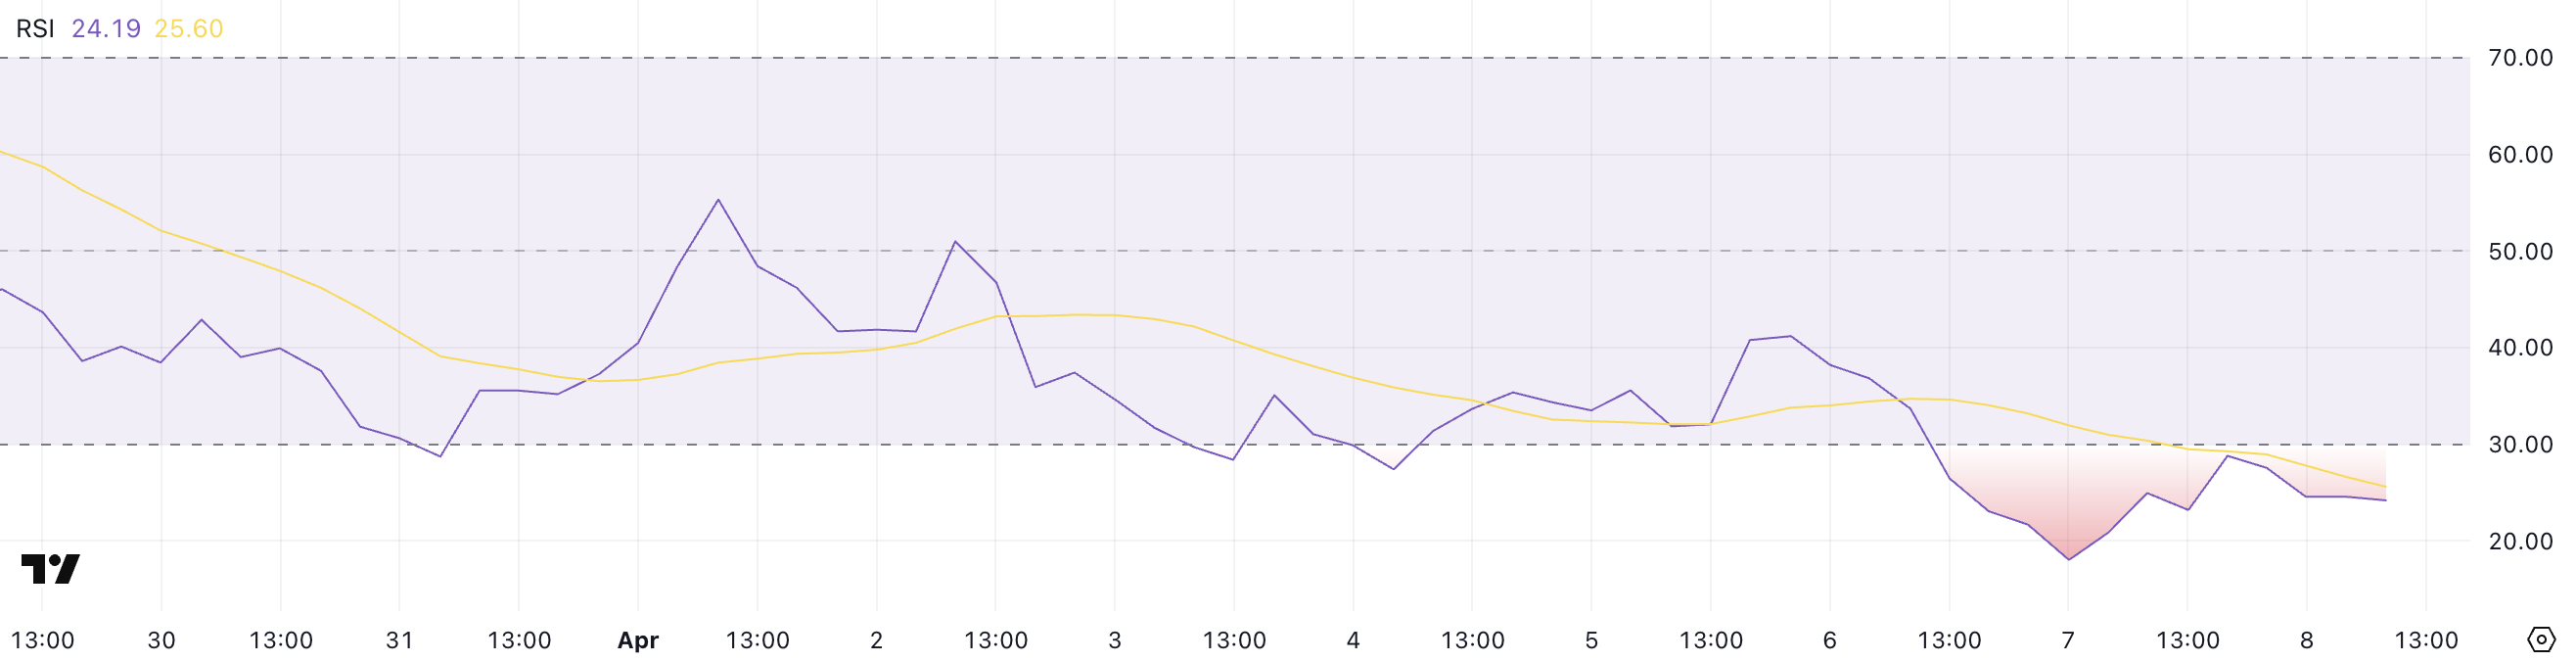
The RSI is a momentum oscillator that measures the speed and change of price movements on a scale from 0 to 100.
Readings above 70 typically indicate overbought conditions, while values below 30 suggest that an asset may be oversold and potentially primed for a rebound.
With BERA’s RSI deeply oversold at 24.19, a short-term bounce could occur if buyers step in, but unless it can break above the 50 level, the broader downtrend may remain intact.
Berachain DMI Shows Sellers Are Still In Control
Berachain’s DMI (Directional Movement Index) chart shows its ADX has climbed to 38.52, up significantly from 27.56 just two days ago. This sharp rise in ADX signals that the strength of the current trend — in this case, a bearish one — is intensifying.
An ADX value above 25 typically indicates a strong trend, and with it now approaching 40, market momentum appears to be gaining traction.
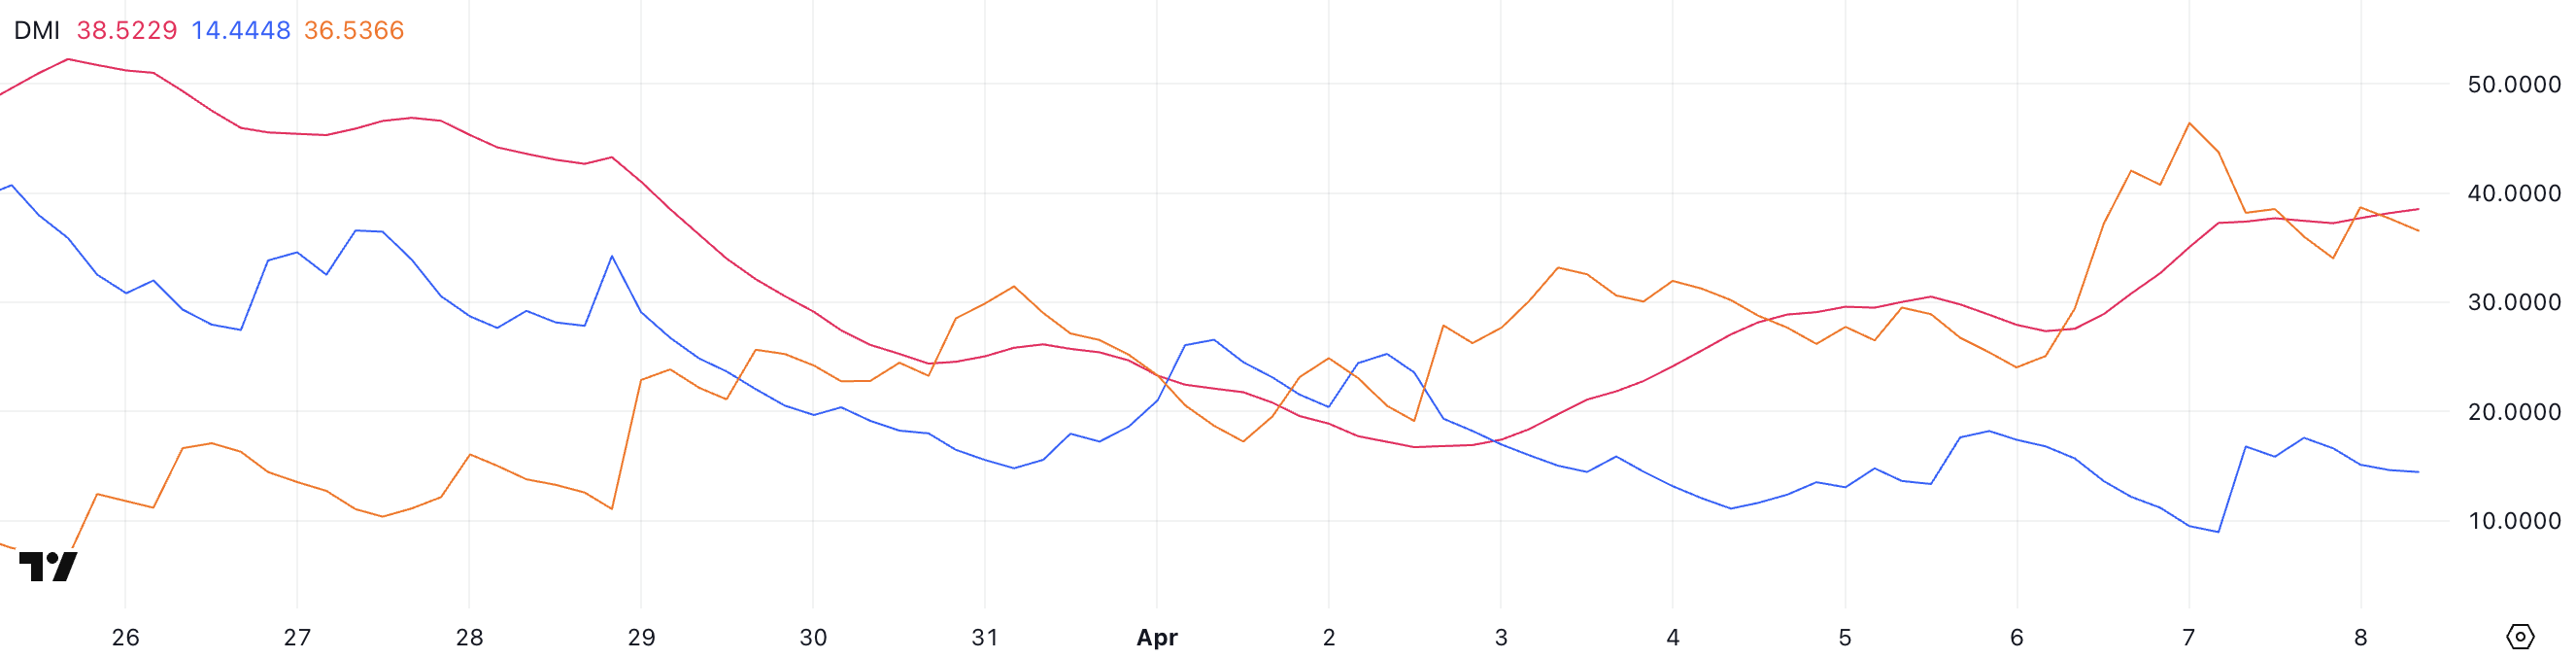
The DMI consists of two directional indicators: +DI, which tracks upward movement, and -DI, which tracks downward movement.
BERA’s +DI has risen from 8.94 to 14.44, showing a modest increase in bullish pressure, though it’s remained stable in the last several hours. Meanwhile, the -DI has dropped from 46.4 to 36.53, suggesting that bearish dominance is softening slightly.
While the narrowing gap between +DI and -DI points to a potential shift, the fact that -DI is still clearly in the lead, and ADX continues rising implies the downtrend remains in control — though bulls may be starting to push back.
Will Berachain Make New All-Time Lows Soon?
Berachain’s price chart currently shows a bearish EMA setup, with short-term moving averages positioned below the long-term ones — a classic signal that downward momentum may persist.
If this correction continues, BERA could fall below the $3.80 mark, setting a new all-time low and further shaking investor confidence in the short term.
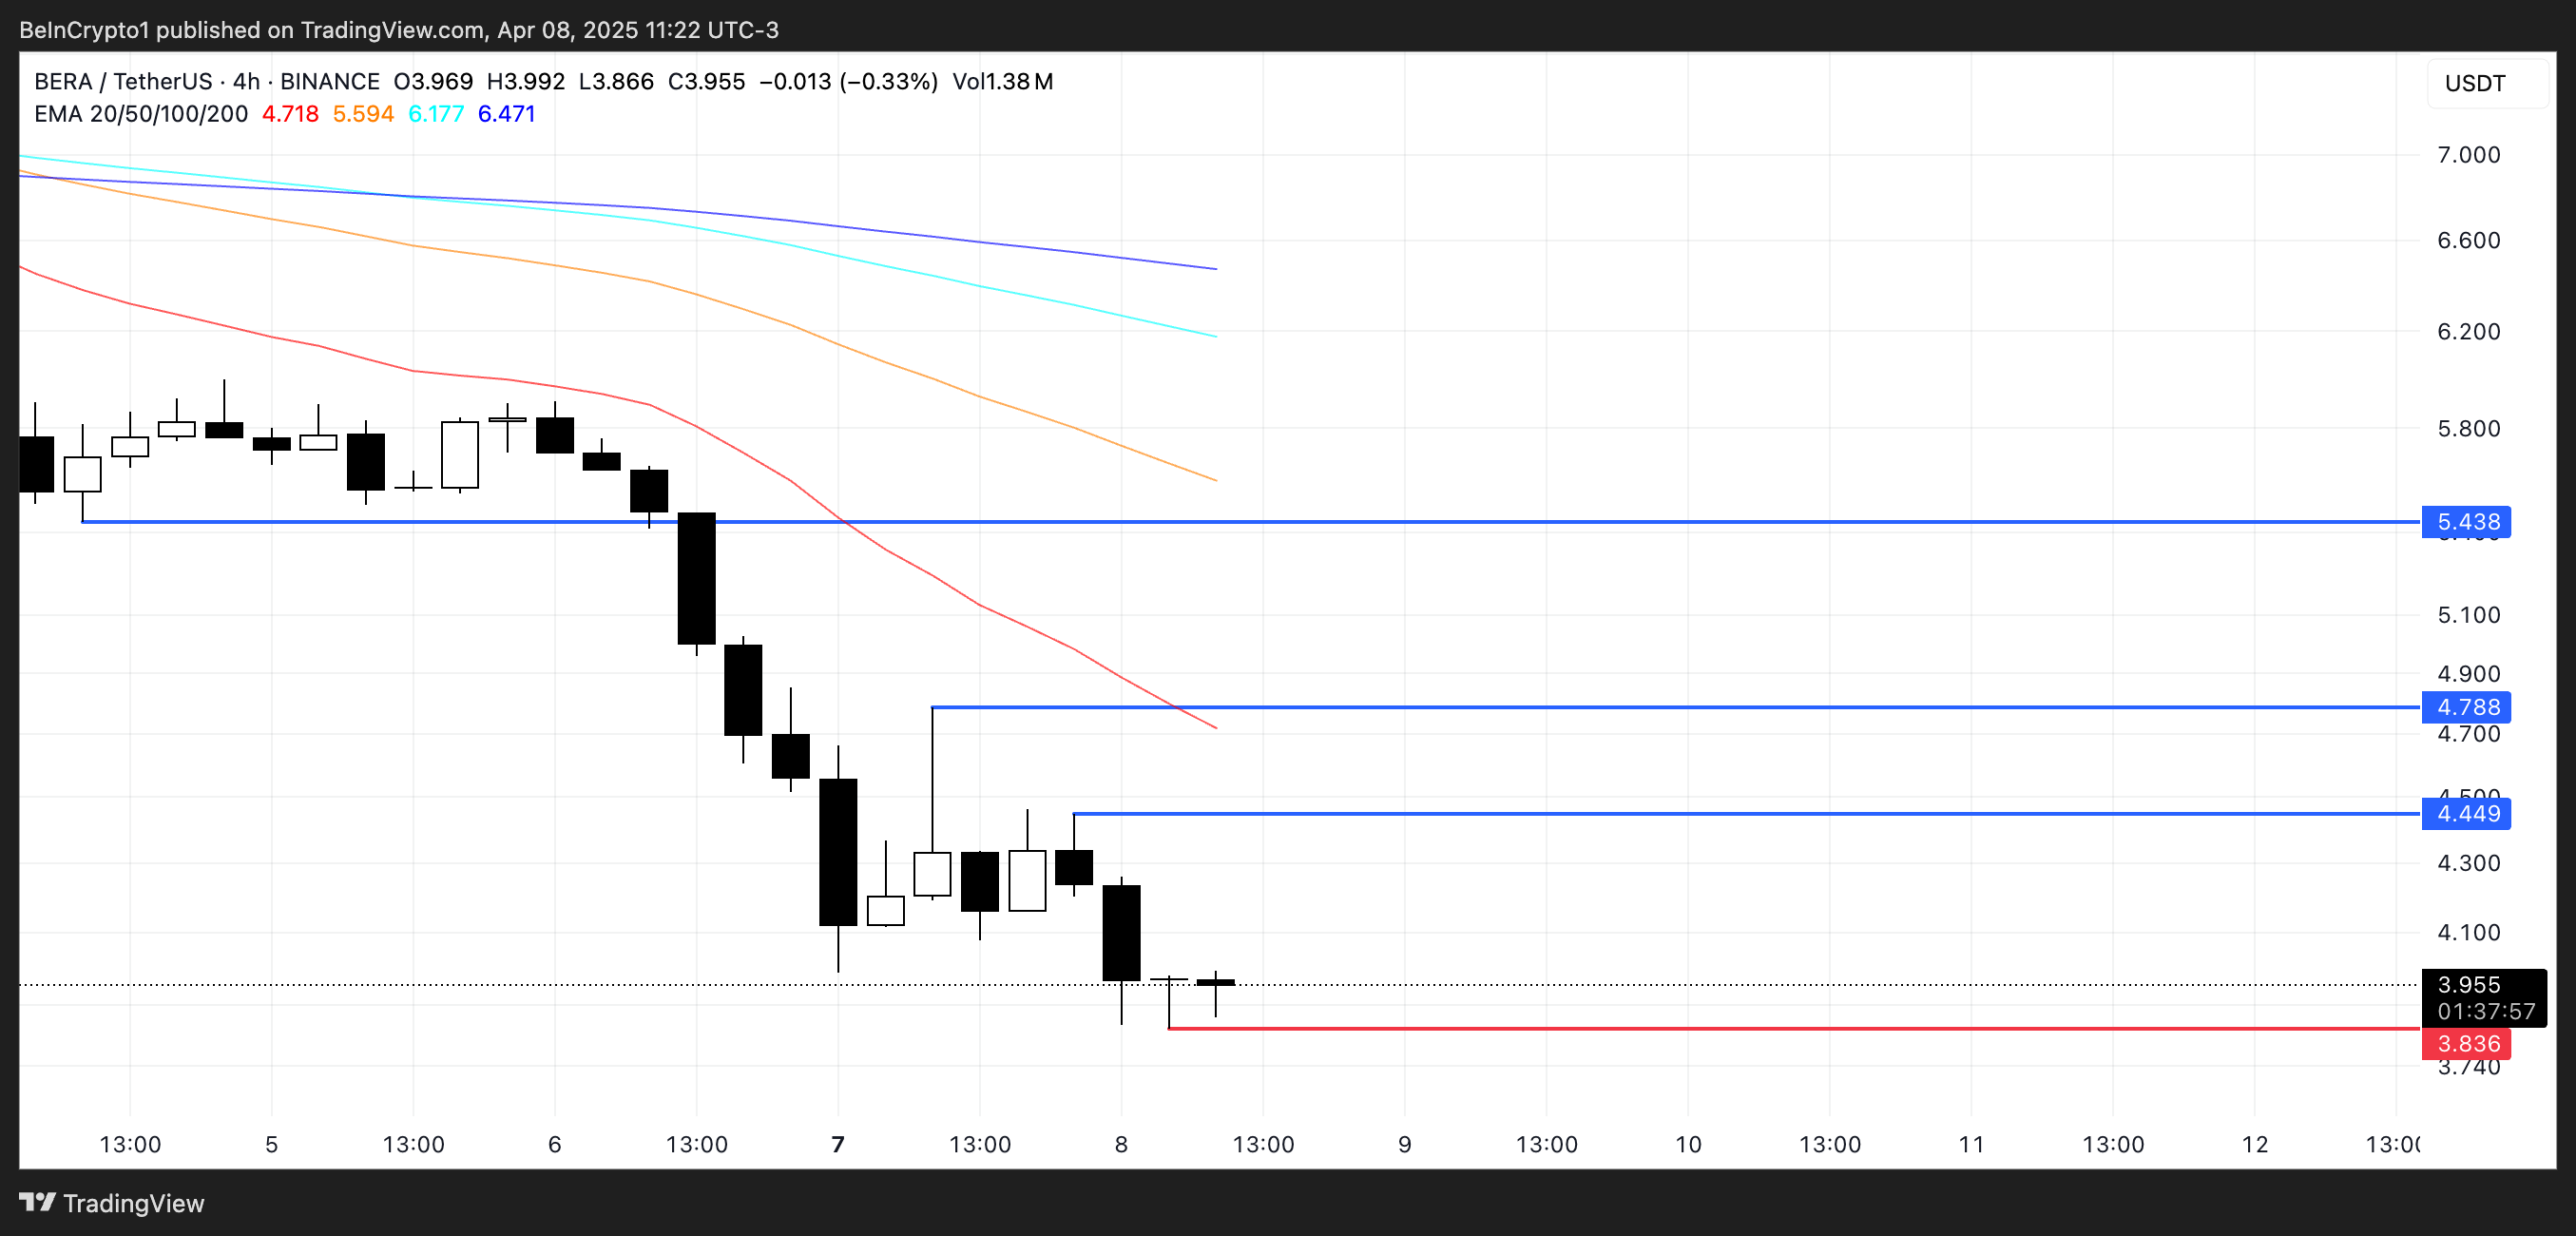
However, if the trend reverses and buyers step in with strength, BERA could begin climbing toward key resistance levels. The first major hurdle is at $4.44, and a breakout above that could open the path to $4.78.
Should bullish momentum return in full force, Berachain may even rally to retest the $5.43 level, signaling a potential shift back into an uptrend.
Disclaimer
In line with the Trust Project guidelines, this price analysis article is for informational purposes only and should not be considered financial or investment advice. BeInCrypto is committed to accurate, unbiased reporting, but market conditions are subject to change without notice. Always conduct your own research and consult with a professional before making any financial decisions. Please note that our Terms and Conditions, Privacy Policy, and Disclaimers have been updated.

Ondo (ONDO), Parcl (PRCL), Mantra (OM), OriginTrail (TRAC), and Clearpool (CPOOL) are five RWA altcoins worth keeping an eye on in April 2025.
ONDO holds a $2.4 billion market cap despite a 7% drop this week, while PRCL has fallen nearly 40% amid broader market weakness. Mantra is down just 1.5% over the same period, showing relative strength, though its actual on-chain impact is still debated. TRAC and CPOOL are both in correction phases, but key support and resistance levels could define their next moves.
Ondo (ONDO)
Despite a 7% decline over the past seven days, ONDO remains one of the leading RWA altcoins in crypto. It holds a strong position with a market cap near $2.4 billion.
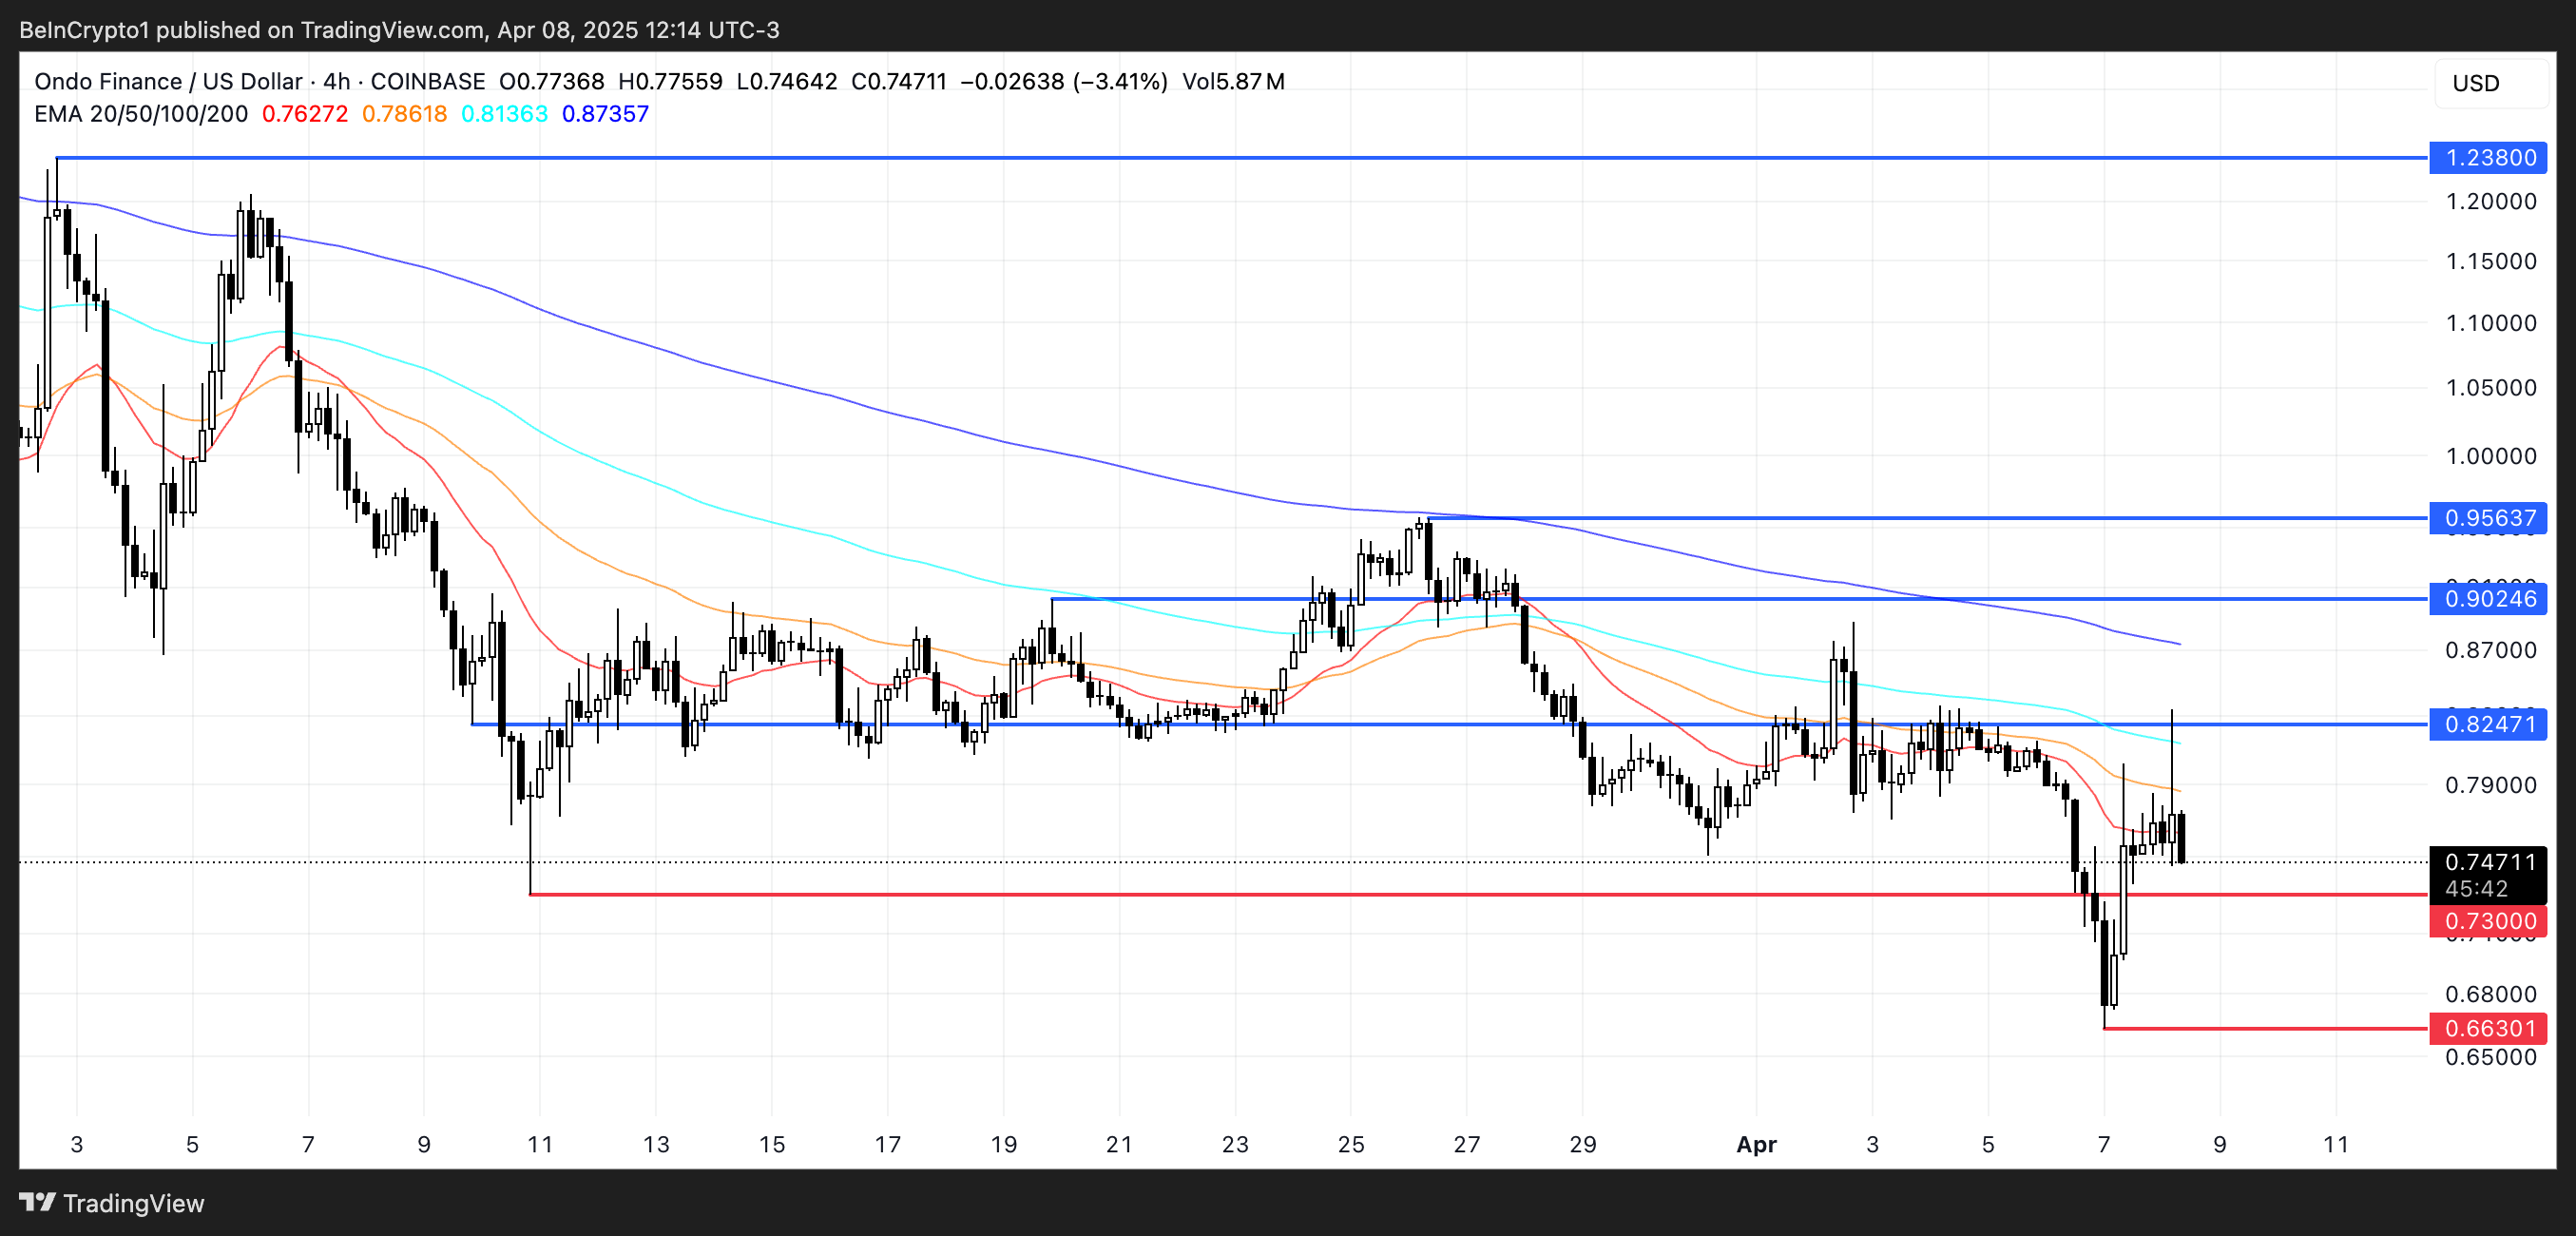
If the downtrend persists, ONDO could first test key support at $0.73. A breakdown below that level may trigger further losses toward $0.66, and if selling pressure accelerates, the token could slide below $0.60 — a level not seen since early 2024.
However, if bulls regain control and reverse the current trend, ONDO could begin climbing toward resistance at $0.82. A successful breakout could lead to a retest of $0.90 and $0.95, and if the momentum holds, the token could even rally up to $1.23 — signaling a strong return of bullish sentiment.
Parcl (PRCL)
Parcl, a decentralized real estate trading platform, current has a market cap nearing $16 billion.
However, the last seven days have been rough for PRCL, with its price plummeting nearly 40% amid a broader altcoin correction and waning market sentiment.
If PRCL can recover from its current downturn, the first key resistance level to watch is $0.073.
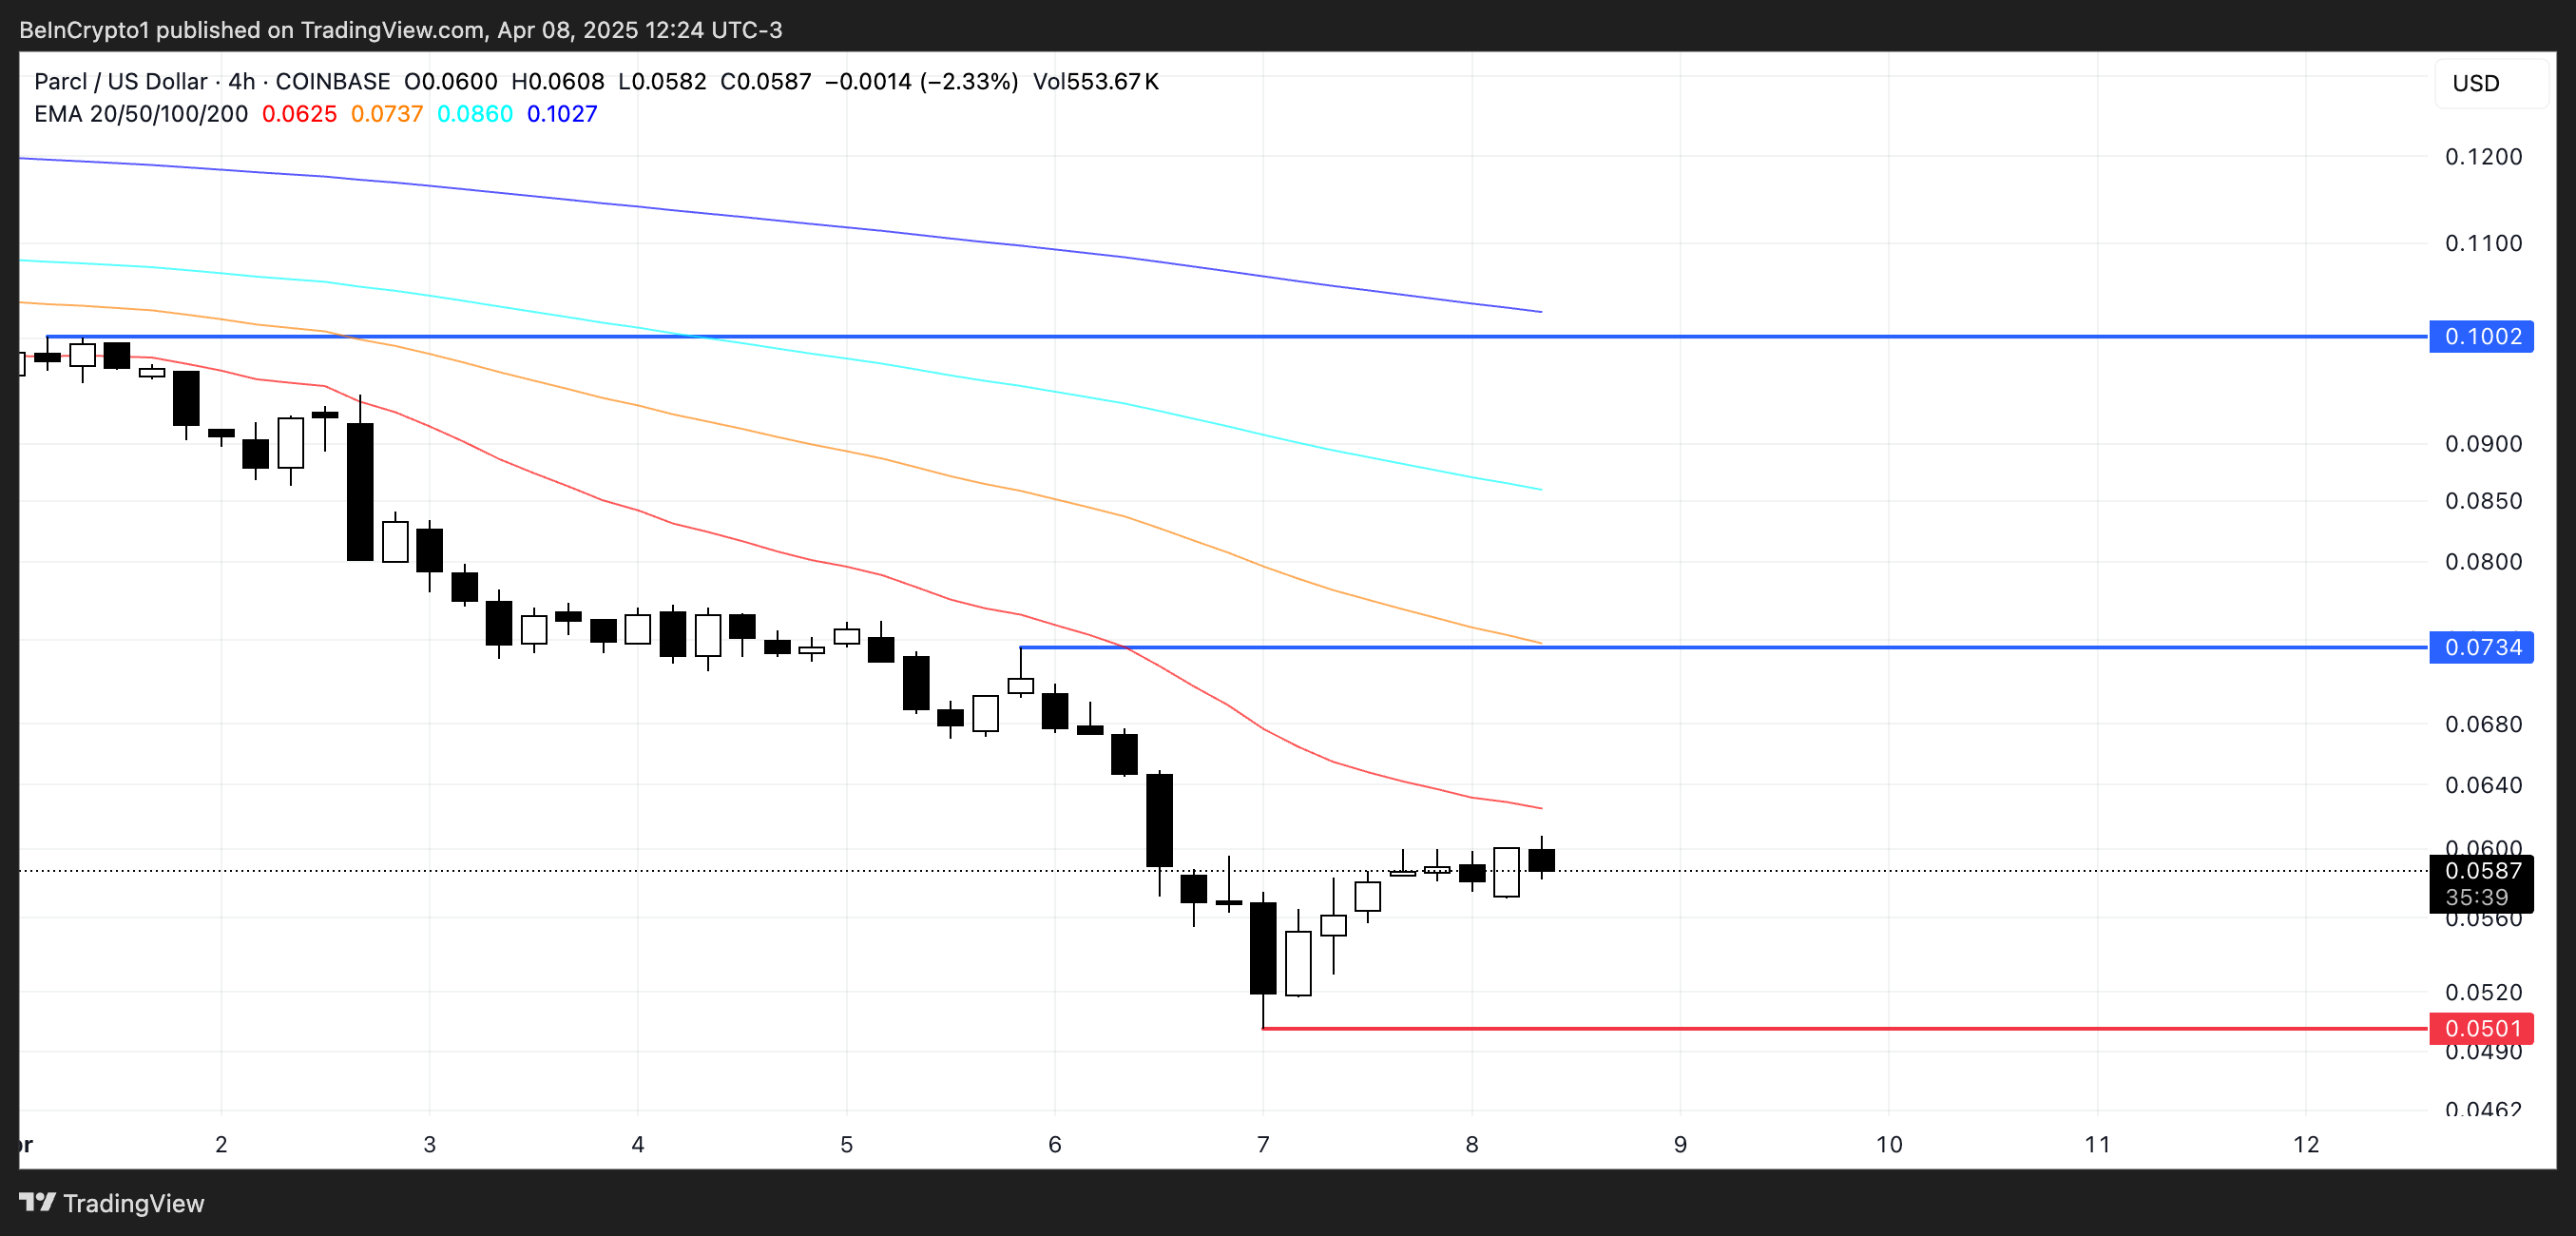
A break above that could open the door for a move toward $0.10, potentially signaling a shift in momentum and restoring some confidence among investors looking for a rebound in the RWA space.
On the flip side, if bearish pressure continues, PRCL may slide down to test critical support at $0.050.
Mantra (OM)
Mantra has emerged as one of the standout RWA altcoins in recent months, with its market cap reaching an impressive $6 billion. Unlike many of its peers, OM has held up relatively well during the latest market correction, dropping just 1.5% over the past seven days — a much smaller decline compared to other RWA altcoins. Recently, Binance Research published that RWA altcoins remain safer than Bitcoin during tariffs.
However, according to Marcos Viriato, CEO of Parfin, it’s too early to declare Mantra as the winner of this cycle:
“It’s still too early to declare a definitive winner. Mantra has executed well and gained momentum, but the RWA space is vast and still maturing. We’re likely to see a multi-platform landscape, with different players excelling in different segments, whether it’s institutional custody, yield generation, or settlement infrastructure. The winners will be those who combine regulatory readiness, composability, and real-world utility and there’s still a lot of room for innovation,” Viriato told BeInCrypto.
OM is still technically in a short-term downtrend. If the correction continues, the token could retest support at $6.11, and a break below that level could push prices down to $5.68. A loss of that support may signal weakening momentum, especially if broader market sentiment remains bearish.
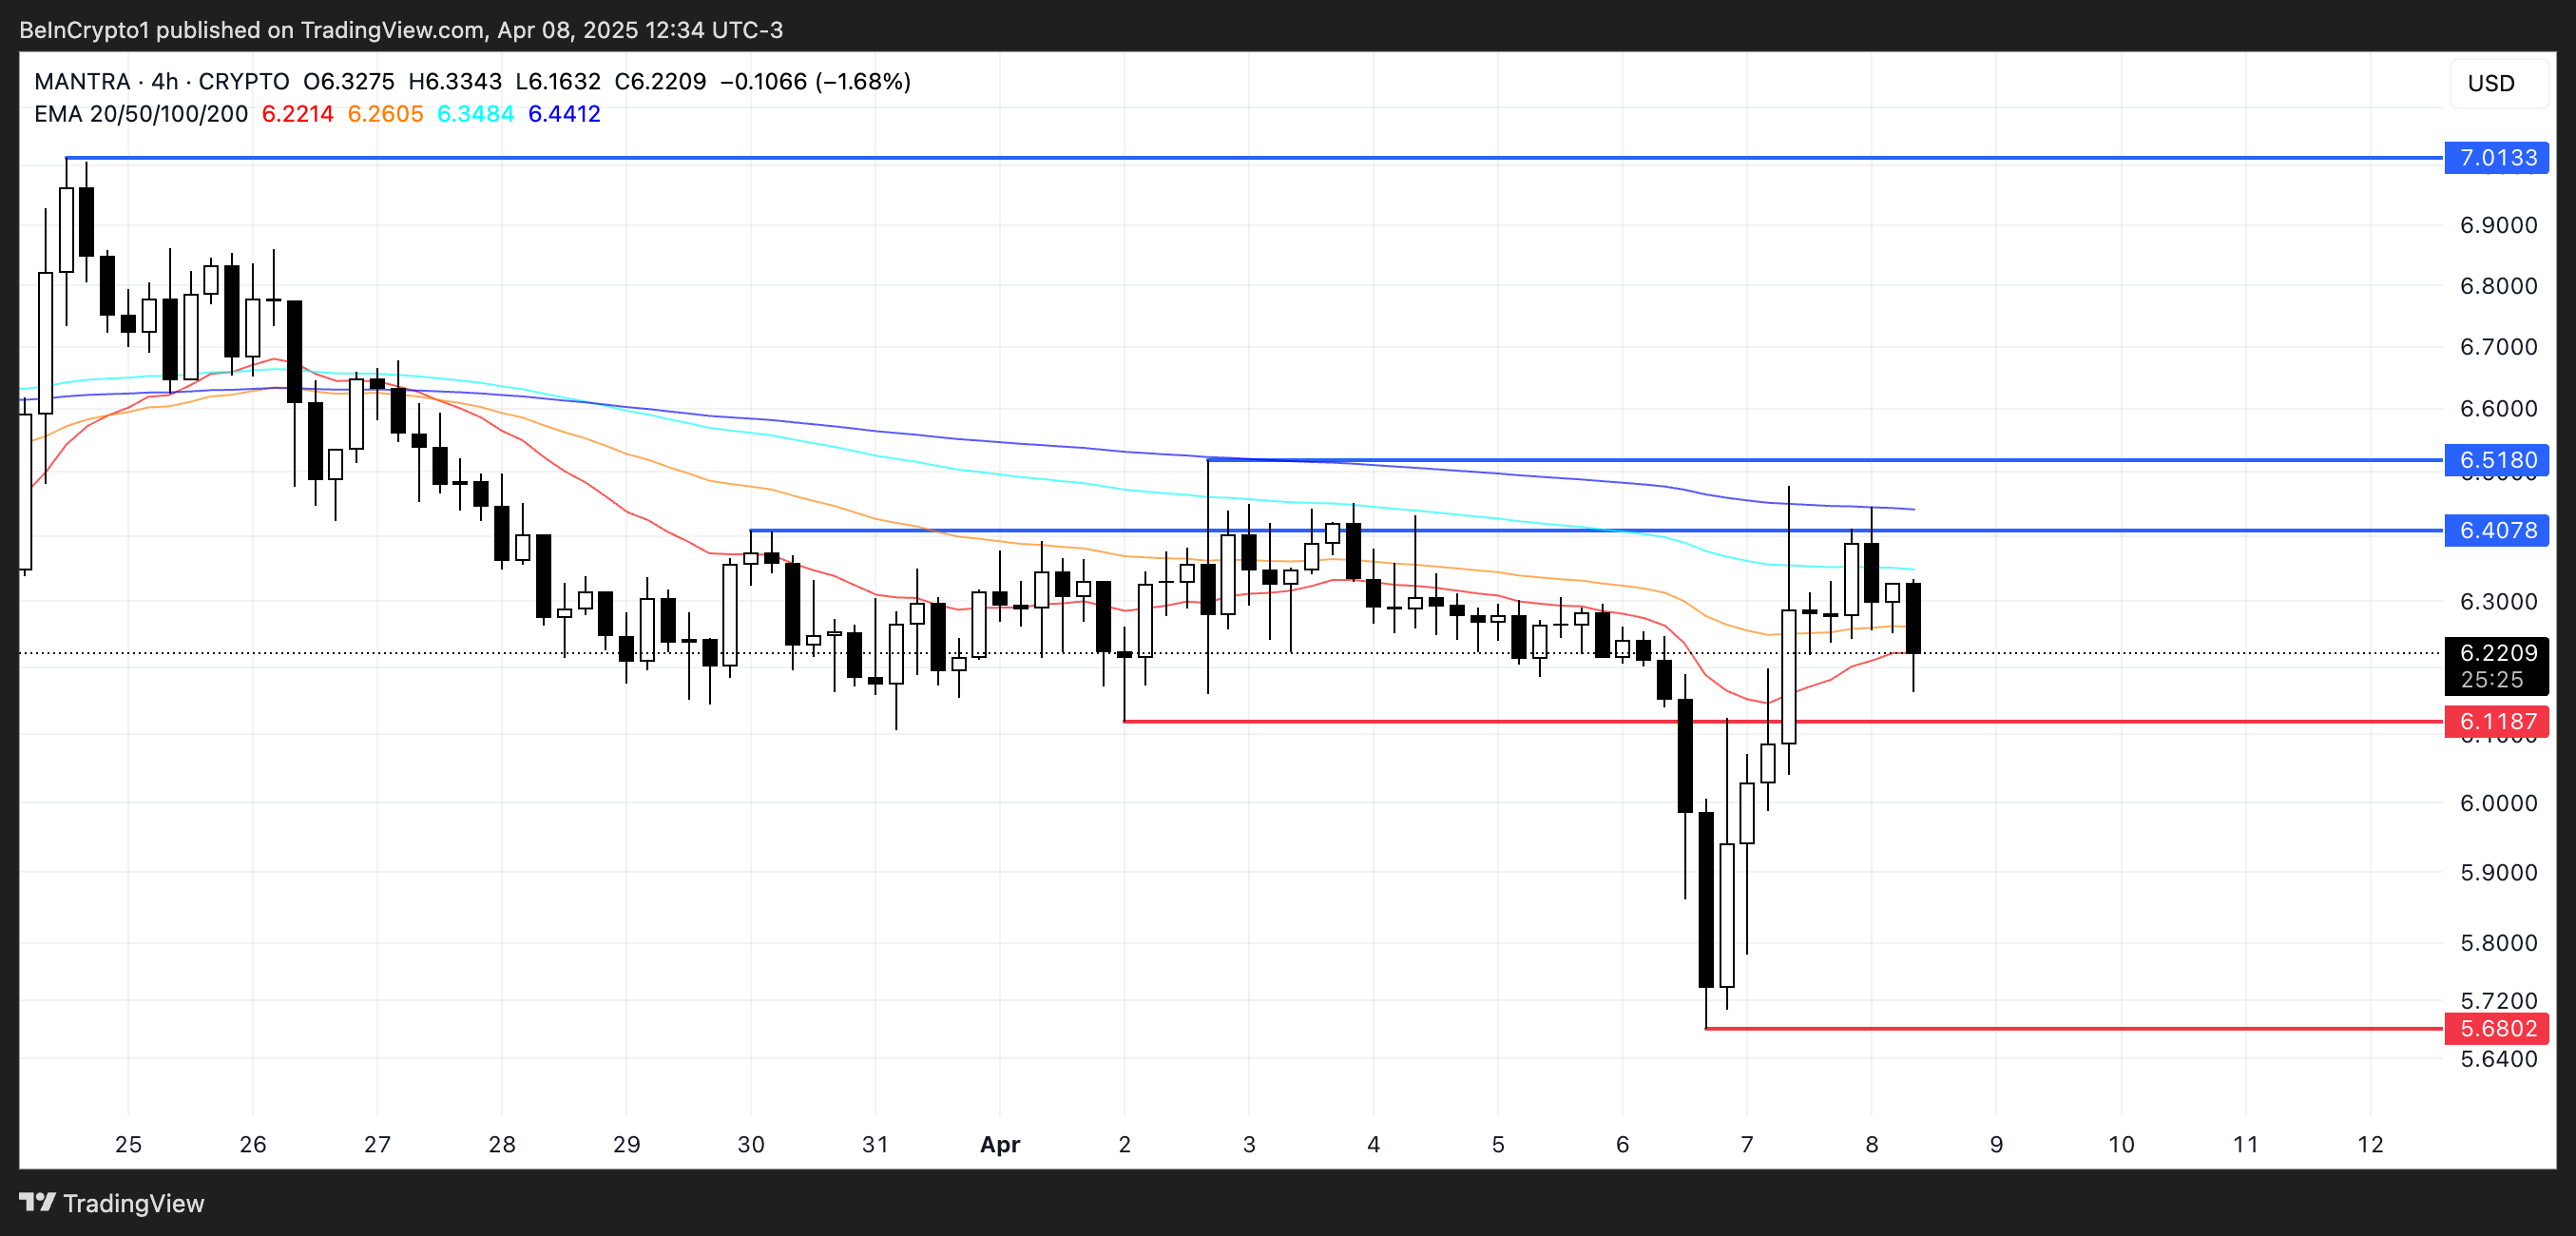
However, if buyers regain control and the trend reverses, Mantra could begin moving higher toward key resistance at $6.40 and $6.51. A successful breakout above these levels could trigger a stronger rally, potentially taking OM back to $7 — a level that would reinforce its bullish long-term outlook.
Kevin Rusher, founder of DeFi RWA lending and borrowing ecosystem RAAC.io, defends that despite price action, Mantra’s value to the whole RWA ecosystem isn’t that big:
“I think it’s definitely too soon to say that Mantra has cornered the RWA market. If you want to talk about price action, you might declare them the winner so far, but the value they have actually brought on-chain is minimal. According to DeFi Llama, Mantra’s current TVL is just $4.3m – this does not even place it within even the top 45 of RWA projects by TVL,” Rusher told BeInCrypto.
OriginTrail (TRAC)
TRAC is the native token of OriginTrail, a decentralized ecosystem focused on building a trusted knowledge infrastructure for artificial intelligence. Its mission is to create a Verifiable Web for decentralized AI.
Despite being down 8.6% over the past seven days, TRAC is showing signs of recovery, bouncing 7.6% in the last 24 hours. If this rebound gains momentum, the token could soon test resistance at $0.37.
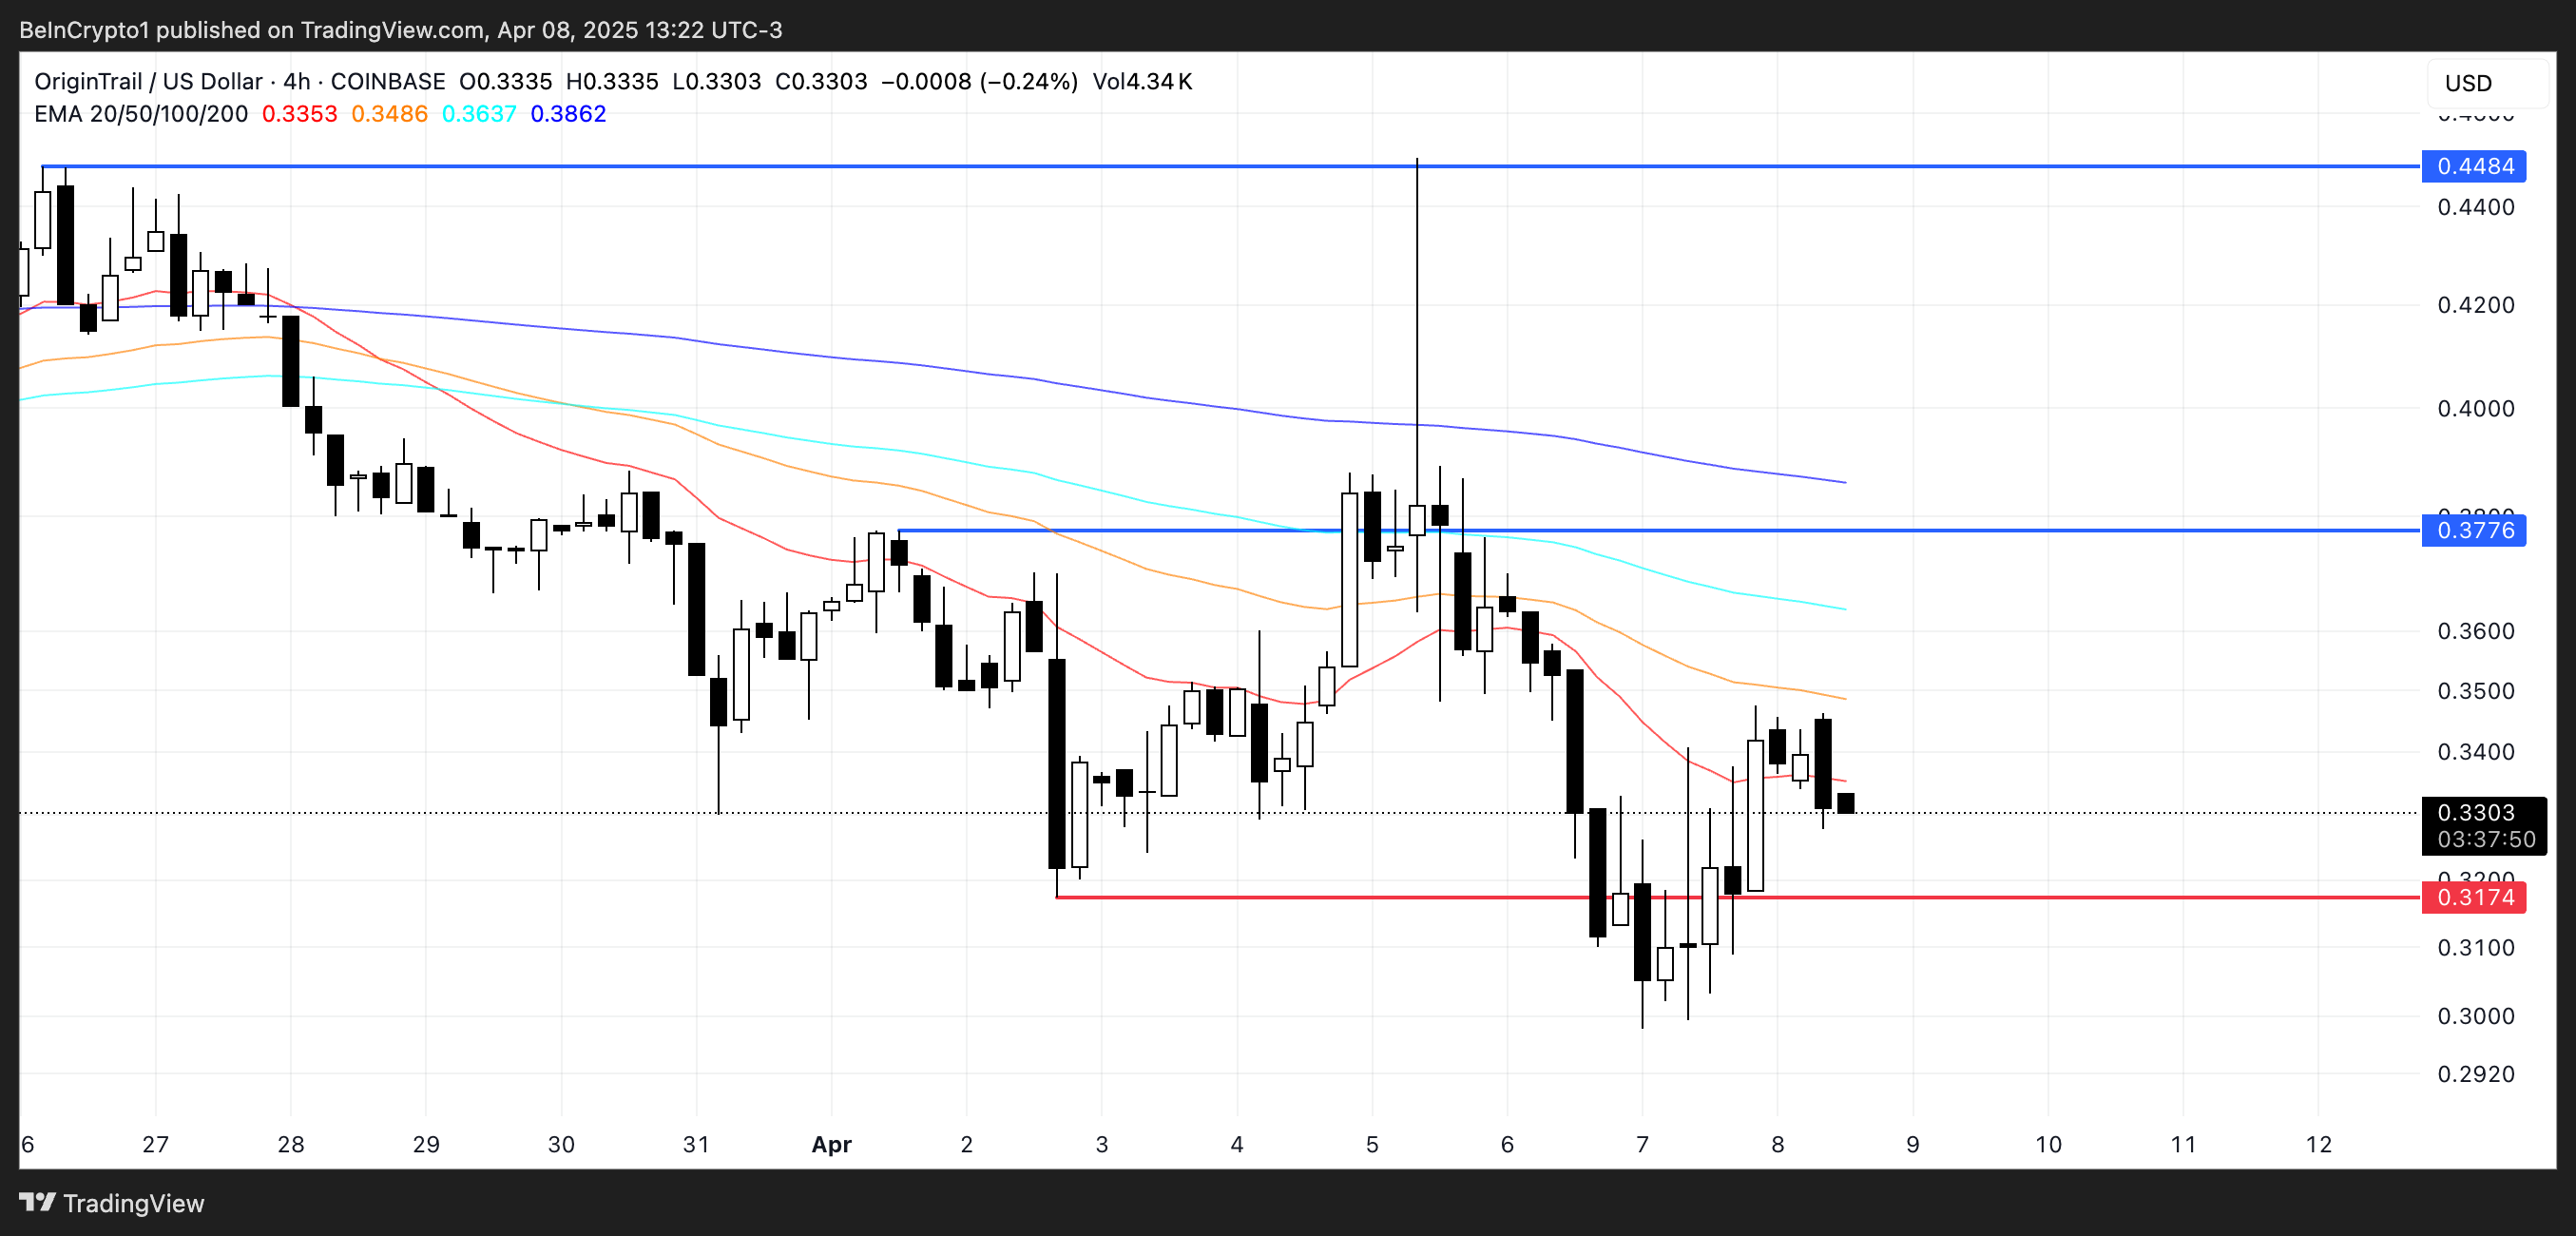
A breakout above that level could pave the way for a move toward $0.44, signaling a stronger bullish reversal and renewed interest in the OriginTrail project.
However, traders are closely watching the $0.31 support level, which remains a critical zone for maintaining the current structure. If TRAC drops and fails to hold that support, the price could slip below $0.30, potentially triggering another wave of downside pressure.
Clearpool (CPOOL)
Clearpool is a decentralized capital markets ecosystem that allows institutional borrowers to access unsecured loans directly from the DeFi apps. In a major development, the project recently introduced Ozean — a new blockchain initiative focused on enabling real-world asset (RWA) yield.
CPOOL, Clearpool’s native token, has declined by 7.5% over the past seven days, dropping below the $0.12 mark.
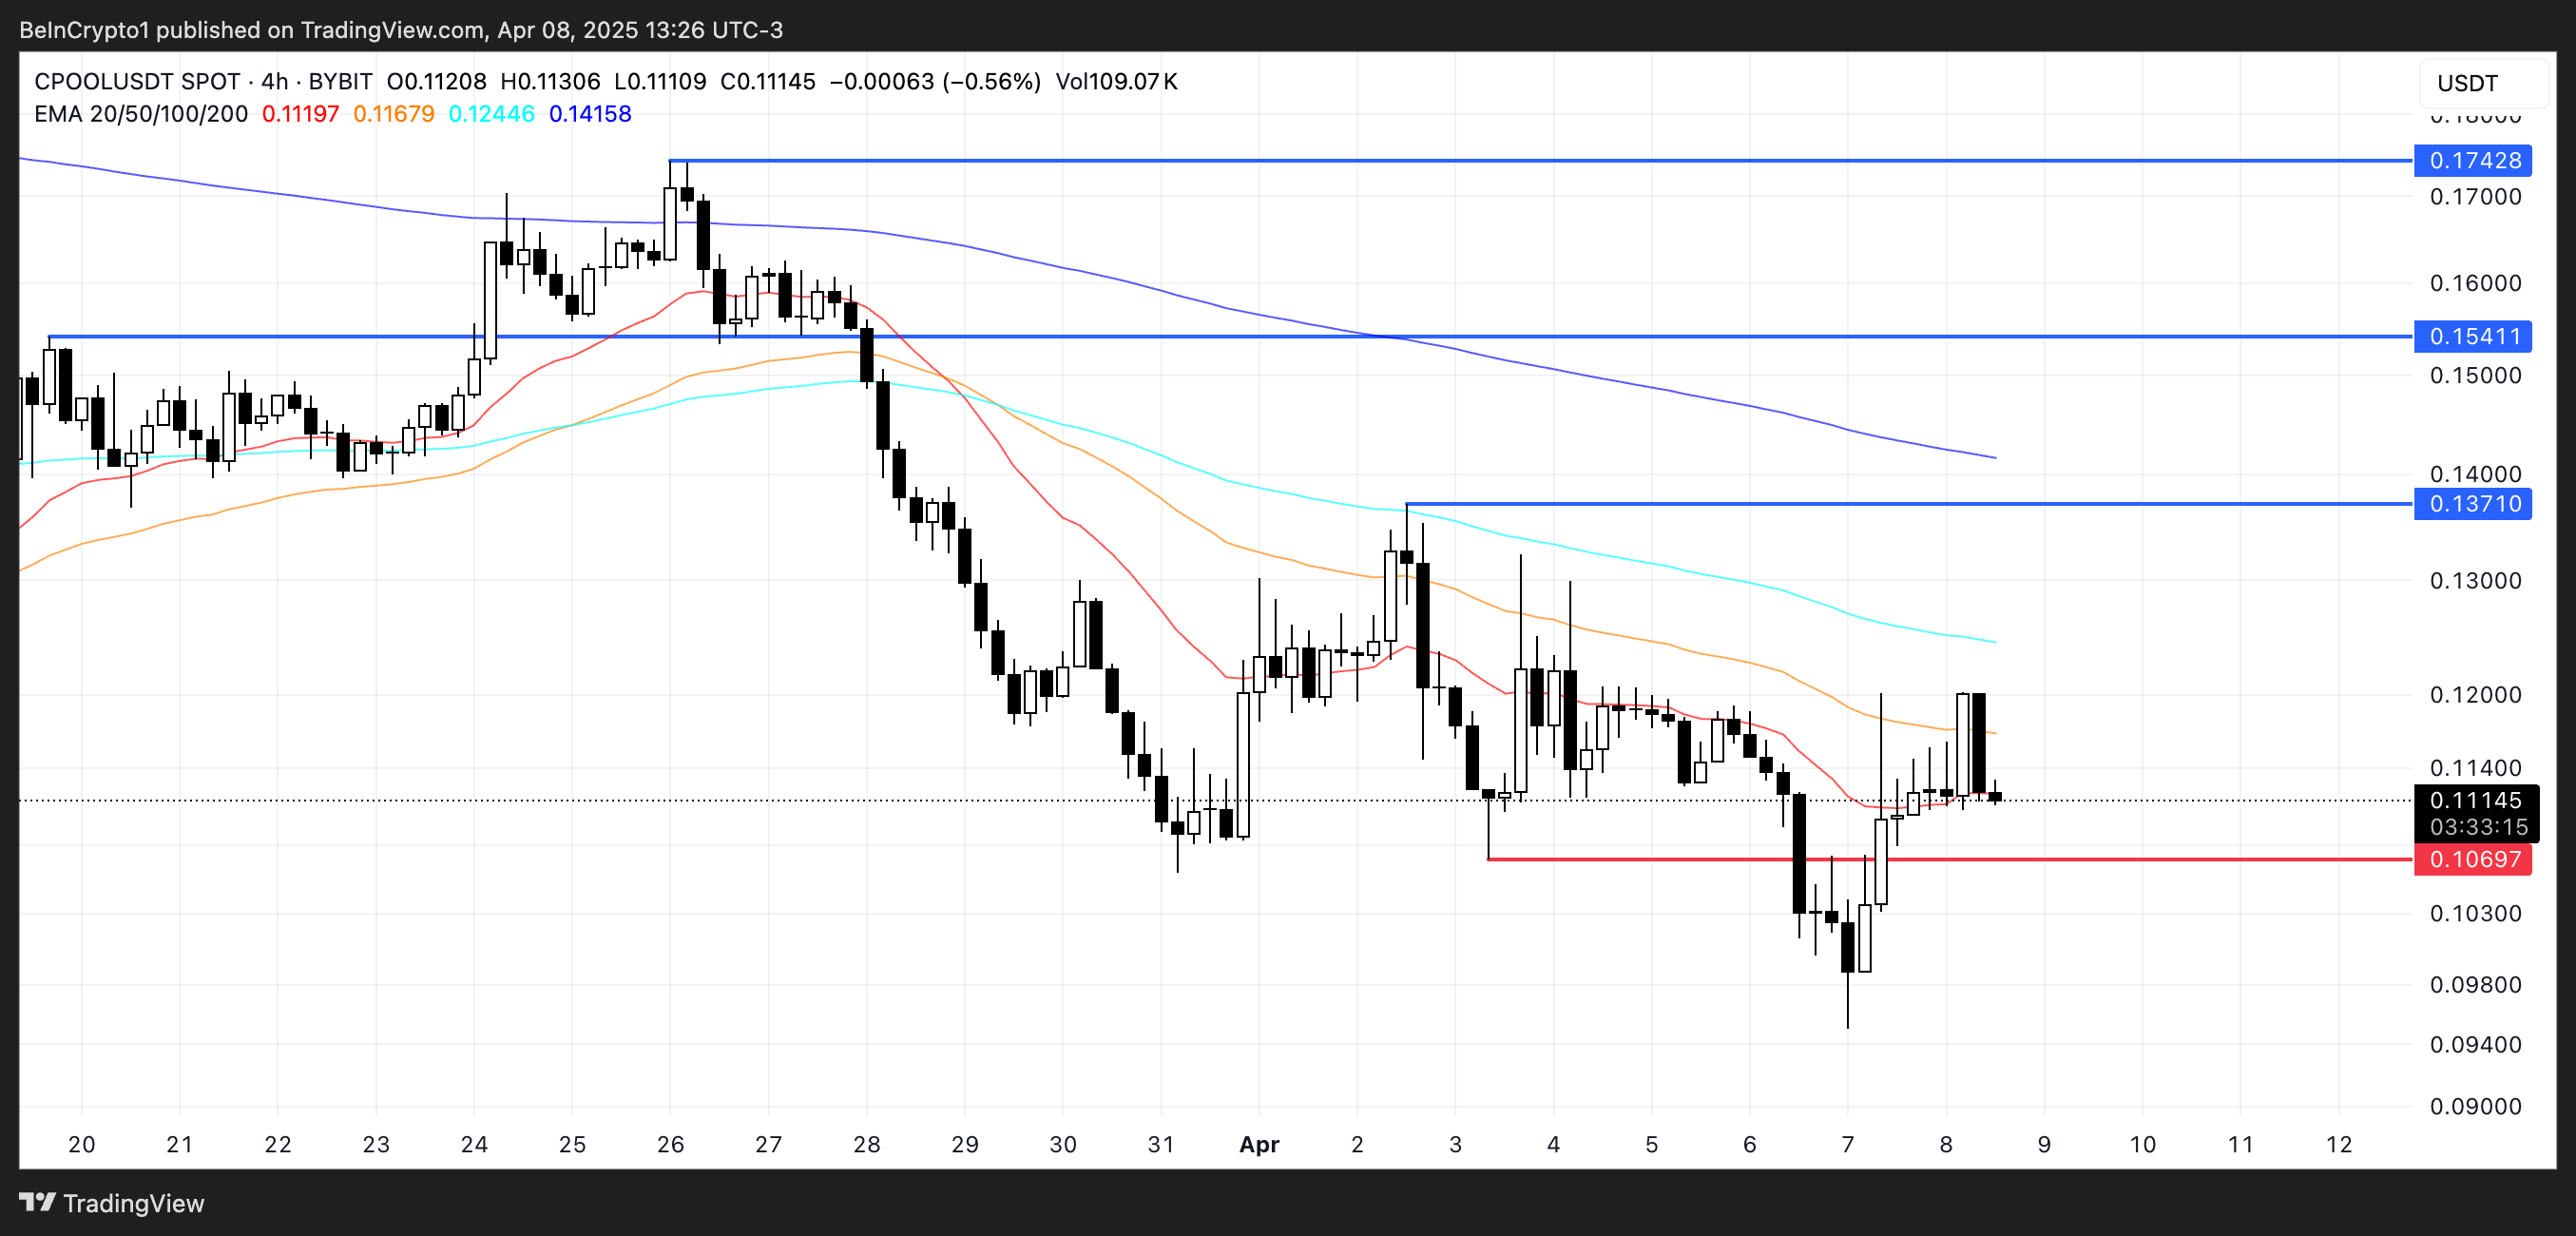
If the current correction continues, the token may test support at $0.106, and a breakdown from that level could push CPOOL below $0.10 — a psychologically significant threshold that may increase bearish sentiment.
However, if the trend reverses and bullish momentum around RWA coins returns, CPOOL could aim for resistance at $0.137. A breakout above that could open the path toward $0.154 and potentially $0.174, depending on the strength of the recovery.
Disclaimer
In line with the Trust Project guidelines, this price analysis article is for informational purposes only and should not be considered financial or investment advice. BeInCrypto is committed to accurate, unbiased reporting, but market conditions are subject to change without notice. Always conduct your own research and consult with a professional before making any financial decisions. Please note that our Terms and Conditions, Privacy Policy, and Disclaimers have been updated.

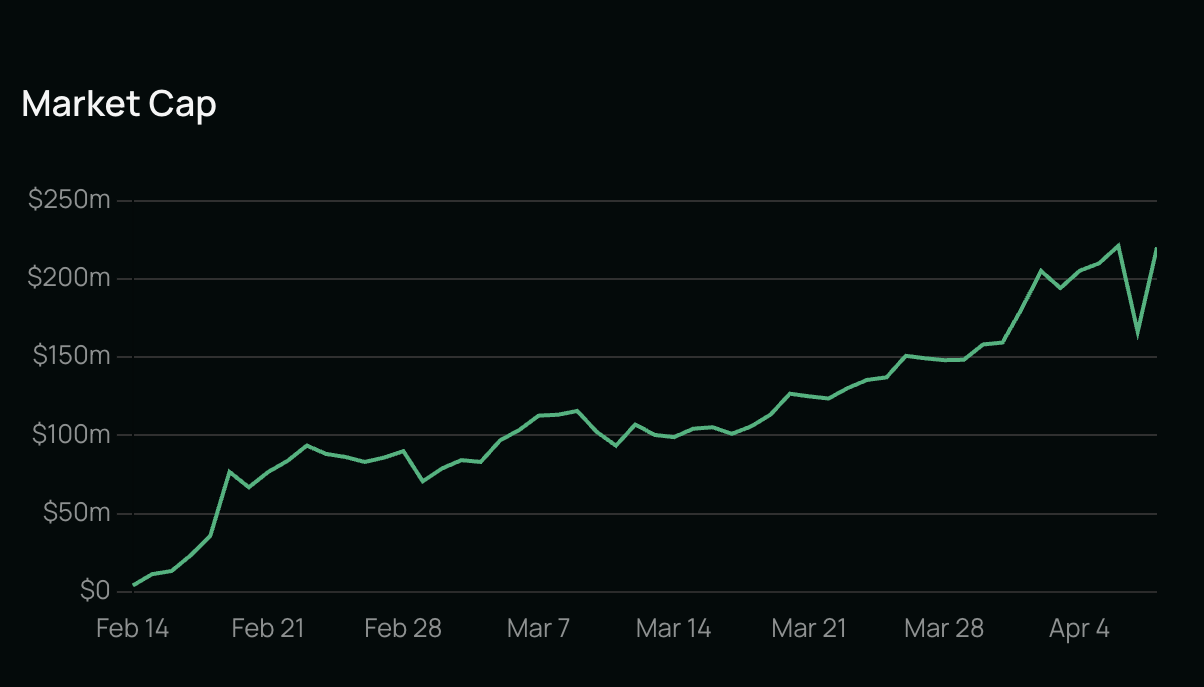
Despite tariff fears having an outsized impact on AI tokens, Bittensor’s subnet ecosystem is posting impressive returns. In two months, its subnet tokens’ market cap grew from $4 million to over $200 million.
The total number of subnets has tripled in the last year, and community enthusiasm could fuel further growth. Each one can improve Bittensor’s machine-learning capabilities, potentially creating further gains.
Bittensor Network Grows Thanks to Subnets
Bittensor, a decentralized AI learning network, has been going through a few changes lately. It became the biggest AI cryptoasset last December and rallied again after a Coinbase listing.
Although its token price has since had a period of decline, there are a few key signals of long-term potential. Essentially, the key factor for Bittensor is growth in its subnets.
“Venture capitalists chasing gas hashrate stars is old news. Bittensor subnets are open source projects with Bitcoin-like currencies bolted on top. ~50 days in, < 100 subnets are worth $6 billion+ with billions in emission pouring in over coming months. The bar is LOW. There should be thousands of subnets today!” Joseph Jacks claimed.
Subnets are how Bittensor keeps its machine-learning capabilities decentralized. Each subnet is a specialized partition of the network that focuses on a specific area of expertise, and they’re growing.
In the last year, the number of total active subnets on the network has nearly tripled:
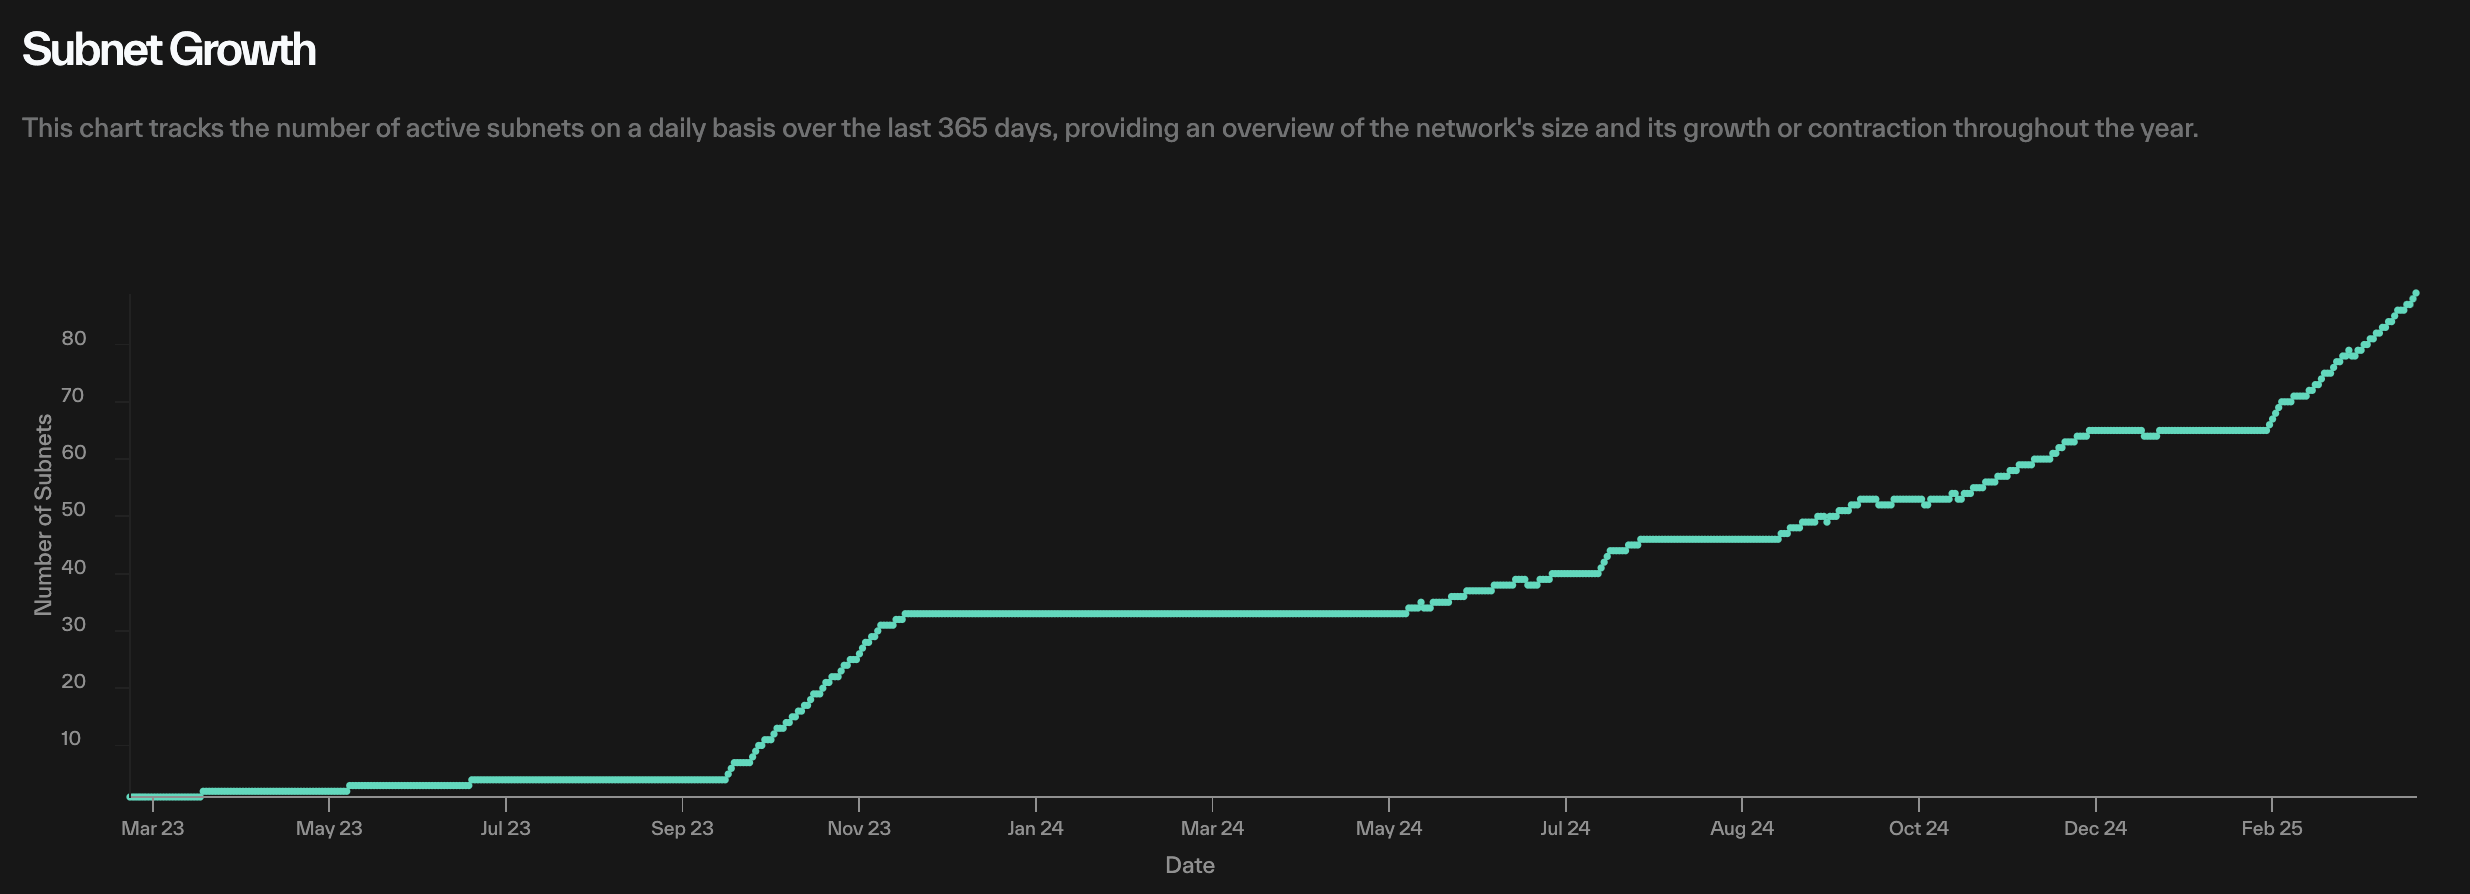
Some of the leading subnet tokens in Bittensor’s ecosystem have market caps well in excess of $10 million. Indeed, despite a slight hiccup yesterday, the total market cap of all subnet tokens has been growing dramatically.
This figure rose from around $4 million in February to over $200 million today, an impressive rate of growth.
This growth is impressive enough in a vacuum, and even more so in today’s unstable crypto market. However, Bittensor’s subnet performance is particularly noteworthy for another reason.
According to a recent report, tariff instability is heavily impacting AI tokens, with only meme coins suffering worse damage. In other words, Bittensor should be feeling pressure.
Despite these broader concerns, Bittensor’s ecosystem is actually expanding. This high performance has led some advocates to declare that Bittensor might be “the next generational opportunity.”
If the subnet ecosystem is growing under these circumstances, it’ll provide higher utility for Bittensor’s machine learning and a possible source of market stability.
Disclaimer
In adherence to the Trust Project guidelines, BeInCrypto is committed to unbiased, transparent reporting. This news article aims to provide accurate, timely information. However, readers are advised to verify facts independently and consult with a professional before making any decisions based on this content. Please note that our Terms and Conditions, Privacy Policy, and Disclaimers have been updated.

Berachain Drops 47% in a Month as Bearish Signals Grow

Bitcoin Crashes Below $75,000 As Asian Stock Markets Bleed

5 RWA Altcoins to Watch In April 2025

Bittensor’s Subnet Ecosystem Grows Despite Market Uncertainty

Ethereum Network Performance Tumbles As Total Transaction Fees Drops To New Lows

Crypto Stocks Suffer As Trump Confirms 104% Tariffs on China

2.52 Million Altcoins Are Ruining Crypto’s Future

Animoca Brands Valuation Tanks 75% In Two Years, Here’s Why

Crypto exchange BingX hacked for $43 million

Are The Big Players Losing Interest?

Hong Kong’s Securities Association Tips Authorities On Crypto Self-Regulation

Coinbase cbBTC Set to go Live on Solana
2.52 Million Altcoins Are Ruining Crypto’s Future
Animoca Brands Valuation Tanks 75% In Two Years, Here’s Why
Crypto exchange BingX hacked for $43 million
Are The Big Players Losing Interest?
Hong Kong’s Securities Association Tips Authorities On Crypto Self-Regulation
Coinbase cbBTC Set to go Live on Solana
-

 Market24 hours ago
Hedera (HBAR) Drops 8% as Market Signals Remain Mixed
-

 Market23 hours ago
Ethereum Price Rebound Stalls—Can It Reclaim the Lost Support?
-

 Market22 hours ago
XRP Price Recovery Fades—$2 Remains A Tough Nut to Crack
-

 Market18 hours ago
Bitcoin Price Recovery In Play—But Major Hurdles Loom Large
-
 Altcoin18 hours ago
Bitcoin +6%, Ethereum +10% Amid Tariff Uncertainty; FARTCOIN Skyrockets +38%, Recovery or Bubble?
-

 Market20 hours ago
Cardano (ADA) Eyes Resistance Break—Failure Could Spark Fresh Losses
-
 Market15 hours ago
Ripple Buys Hidden Road for $1.25 Billion to Boost XRP Ledger
-
 Altcoin14 hours ago
Ripple To Acquire Hidden Road For $1.25 Billion