
Market
Bitcoin Price Dips Again: BTC Bears Tighten Grip

Bitcoin price failed to climb above the $66,500 resistance. BTC is again moving lower and might decline below the $64,600 support zone.
- Bitcoin started a fresh decline from the $66,500 resistance level.
- The price is trading below $65,500 and the 100 hourly Simple moving average.
- There was a break below a connecting bullish trend line with support at $65,250 on the hourly chart of the BTC/USD pair (data feed from Kraken).
- The pair could extend losses if there is a clear move below the $64,600 and $64,200 support levels.
Bitcoin Price Faces Rejection
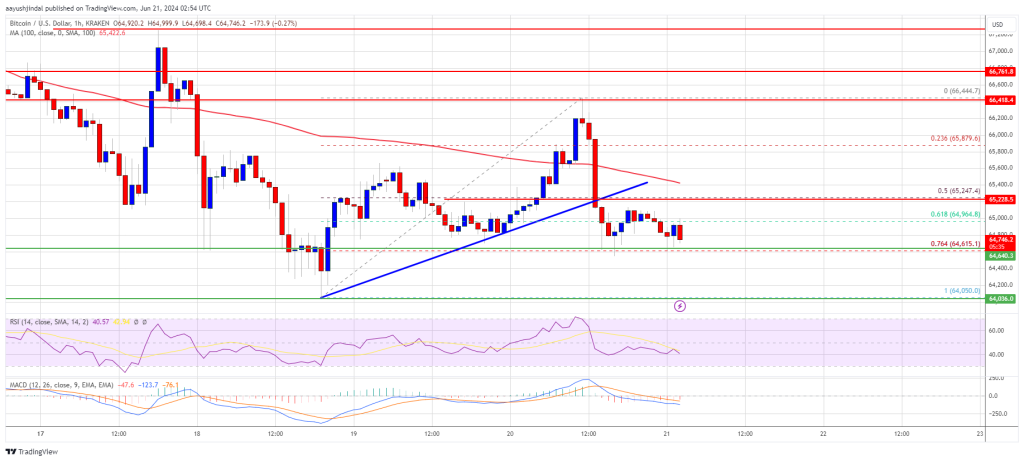
Bitcoin price started a recovery wave above the $65,000 level. BTC climbed above the $65,500 and $66,200 levels. However, the bears were active near the $66,500 zone. A high was formed at $66,444 and the price started another decline.
There was a move below the $65,500 and $65,400 support levels. The price dipped below the 50% Fib retracement level of the upward move from the $64,050 swing low to the $66,444 high. Besides, there was a break below a connecting bullish trend line with support at $65,250 on the hourly chart of the BTC/USD pair
The price tested the $64,600 support zone and the 76.4% Fib retracement level of the upward move from the $64,050 swing low to the $66,444 high.
Bitcoin is now trading below $65,500 and the 100 hourly Simple moving average. If there is another upward move, the price might face resistance near the $65,250 level. The first major resistance could be $65,500. The next key resistance could be $66,000.
A clear move above the $66,000 resistance might start a steady increase and send the price higher. In the stated case, the price could rise and test the $66,500 resistance. Any more gains might send BTC toward the $67,500 resistance in the near term.
More Downsides In BTC?
If Bitcoin fails to climb above the $65,250 resistance zone, it could continue to move down. Immediate support on the downside is near the $64,600 level.
The first major support is $64,200. The next support is now forming near $64,000. Any more losses might send the price toward the $63,200 support zone in the near term.
Technical indicators:
Hourly MACD – The MACD is now gaining pace in the bearish zone.
Hourly RSI (Relative Strength Index) – The RSI for BTC/USD is now below the 50 level.
Major Support Levels – $64,600, followed by $64,000.
Major Resistance Levels – $65,250, and $66,500.


Reason to trust
![]()
Strict editorial policy that focuses on accuracy, relevance, and impartiality
Created by industry experts and meticulously reviewed
The highest standards in reporting and publishing
Strict editorial policy that focuses on accuracy, relevance, and impartiality
Morbi pretium leo et nisl aliquam mollis. Quisque arcu lorem, ultricies quis pellentesque nec, ullamcorper eu odio.
Bitcoin price started a fresh decline below the $85,500 zone. BTC is now consolidating and might attempt to clear the $85,200 resistance zone.
- Bitcoin started a fresh decline below the $85,500 zone.
- The price is trading below $85,000 and the 100 hourly Simple moving average.
- There is a connecting bearish trend line forming with resistance at $84,800 on the hourly chart of the BTC/USD pair (data feed from Kraken).
- The pair could start another increase if it clears the $85,000 zone.
Bitcoin Price Eyes Fresh Increase
Bitcoin price struggled near the $86,500 zone and started a fresh decline. BTC declined below the $85,500 and $85,000 levels to enter a short-term bearish zone.
The price tested the $83,200 support. A low was formed at $83,171 and the price recently corrected some losses. There was a move above the $83,800 level. The price surpassed the 50% Fib retracement level of the downward move from the $86,401 swing high to the $83,171 low.
Bitcoin price is now trading below $85,000 and the 100 hourly Simple moving average. On the upside, immediate resistance is near the $84,750 level. There is also a connecting bearish trend line forming with resistance at $84,800 on the hourly chart of the BTC/USD pair.
The first key resistance is near the $85,150 level or the 61.8% Fib retracement level of the downward move from the $86,401 swing high to the $83,171 low. The next key resistance could be $85,500.

A close above the $85,500 resistance might send the price further higher. In the stated case, the price could rise and test the $85,800 resistance level. Any more gains might send the price toward the $86,400 level.
Another Decline In BTC?
If Bitcoin fails to rise above the $85,000 resistance zone, it could start another decline. Immediate support on the downside is near the $83,900 level. The first major support is near the $83,200 level.
The next support is now near the $82,200 zone. Any more losses might send the price toward the $81,500 support in the near term. The main support sits at $80,800.
Technical indicators:
Hourly MACD – The MACD is now losing pace in the bearish zone.
Hourly RSI (Relative Strength Index) – The RSI for BTC/USD is now near the 50 level.
Major Support Levels – $83,200, followed by $82,200.
Major Resistance Levels – $84,750 and $85,150.

Massive Bitcoin withdrawals worth hundreds of millions of USD from major exchanges have sparked significant interest in the crypto community.
However, if Bitcoin fails to break the $86,000 barrier, a price correction remains a real possibility, especially amid wavering investor confidence.
Bitcoin Whales Withdraw Hundreds of Millions in BTC
Data from the X account OnchainDataNerd on April 17, reveals that several large Bitcoin whales executed substantial withdrawals from top exchanges. Galaxy Digital withdrew 554 BTC, valued at approximately $76.74 million, from OKX and Binance.
Abraxas Capital pulled out 1,854 BTC, worth around $157.26 million, from Binance and Kraken.
Two other whales, identified by addresses 1MNqX and 1BERu, withdrew 545.5 BTC ($45.5 million) and 535.2 BTC ($45.44 million) from Coinbase, respectively. In a single day, over $280 million in Bitcoin was removed from exchanges.
Such withdrawals from Bitcoin whales, like those by Galaxy Digital and Abraxas Capital, often signal a strategy to move BTC into cold storage. This is typically viewed as a bullish sign, reducing selling pressure and reflecting expectations of future price increases.
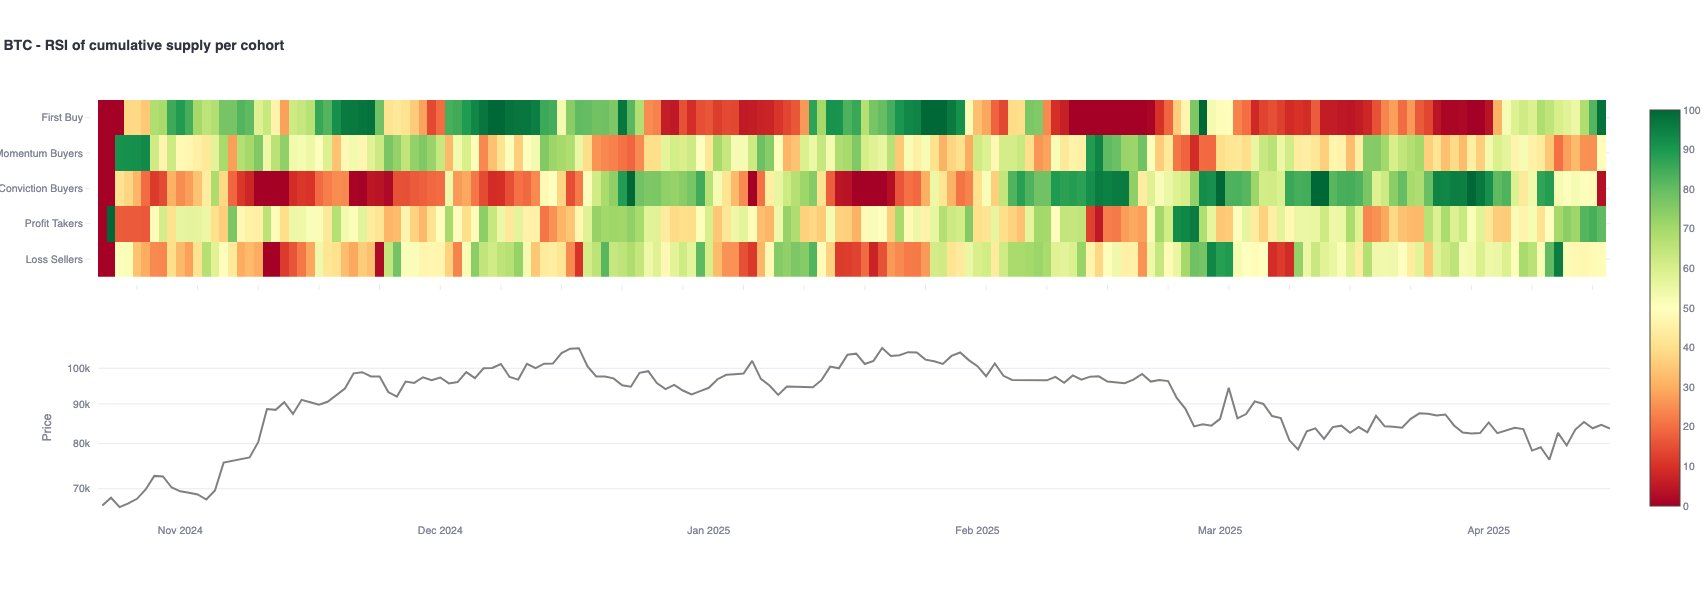
Surge in First-Time Bitcoin Buyers
A report from Glassnode on X highlights a sharp rise in first-time Bitcoin buyers. This influx of new investors could drive short-term price gains. However, long-term holders (LTHs) have paused their accumulation, signaling caution amid heightened market volatility.
In a post on X, the analyst Ali used the TD Sequential technical indicator to forecast Bitcoin’s price trend. The TD Sequential flashed a buy signal on the Bitcoin weekly chart.
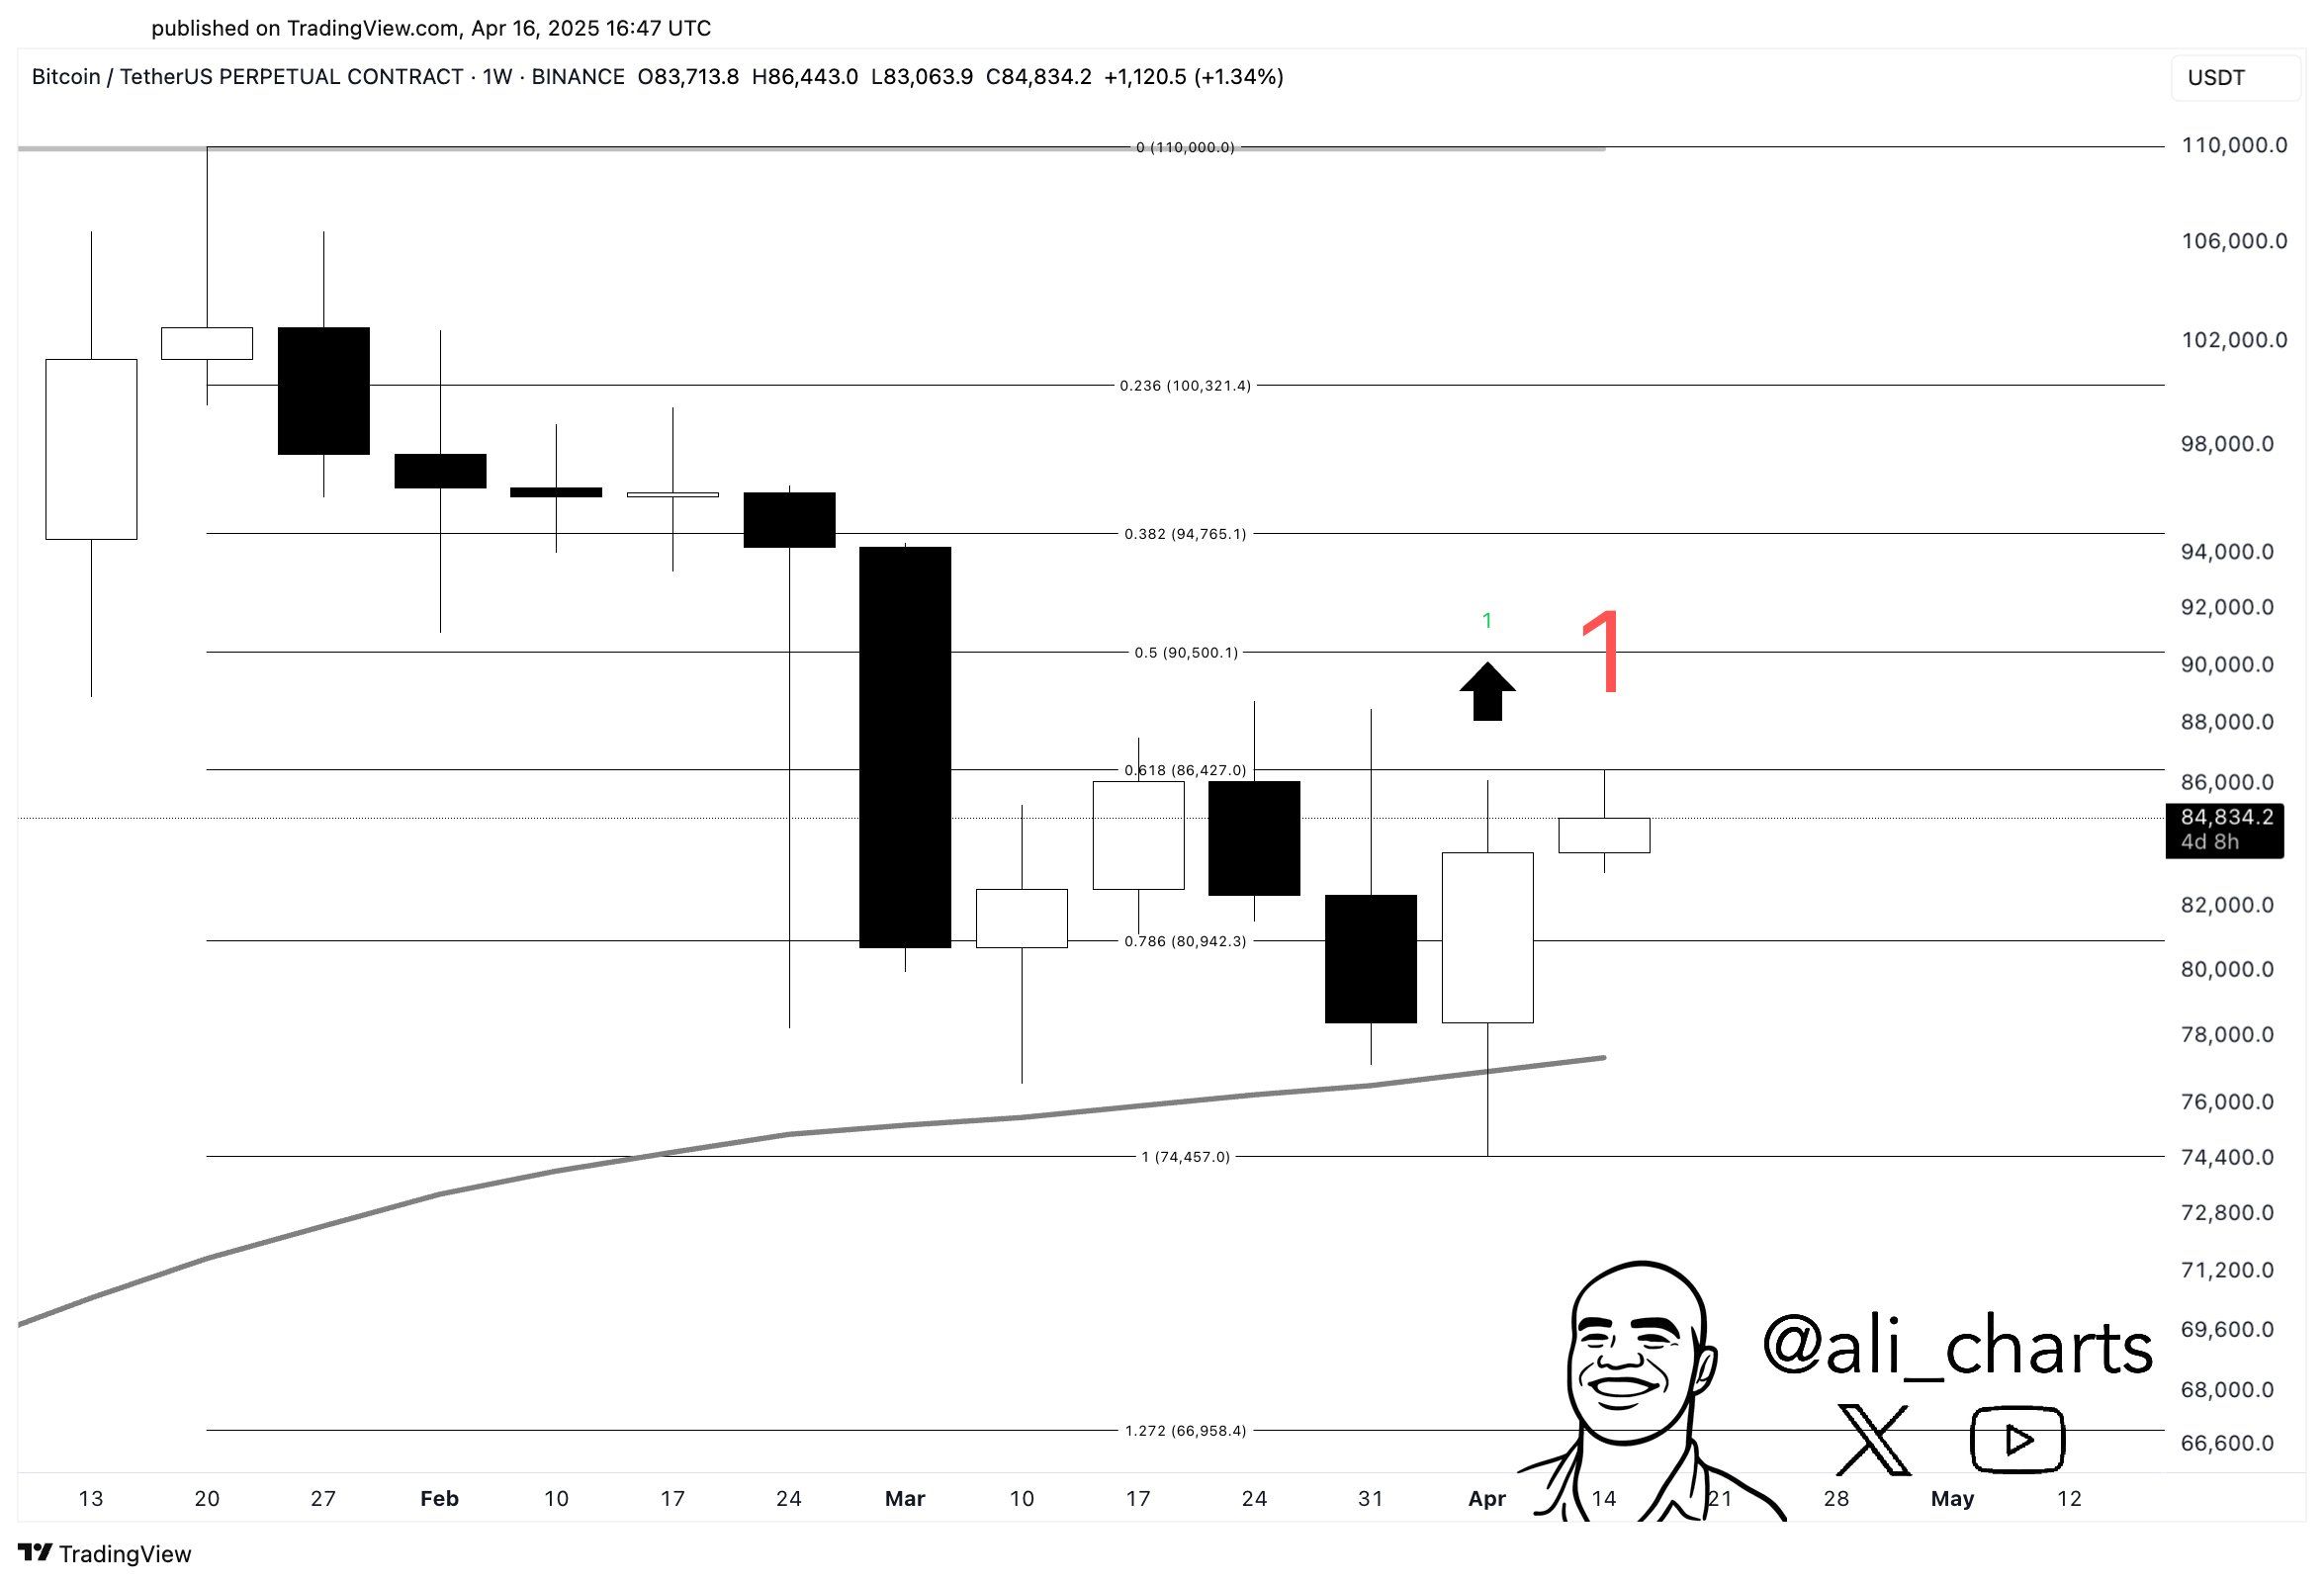
If Bitcoin consistently closes above $86,000, further price increases are likely. Currently, Bitcoin is hovering above $80,000, indicating growth potential. However, surpassing the critical $86,000 resistance level is essential to confirm the bullish trend.

Despite recent whale accumulation, not all signals are positive. Inflows into Bitcoin ETFs have dropped significantly. This decline suggests weakening investor confidence, which could exert downward pressure on prices without fresh catalysts.
Additionally, data from Lookonchain indicates that over $1.26 billion in Bitcoin was unstaked from Babylon. If this capital flows back to exchanges, selling pressure could intensify, making it harder for Bitcoin to breach key resistance levels.
Disclaimer
In adherence to the Trust Project guidelines, BeInCrypto is committed to unbiased, transparent reporting. This news article aims to provide accurate, timely information. However, readers are advised to verify facts independently and consult with a professional before making any decisions based on this content. Please note that our Terms and Conditions, Privacy Policy, and Disclaimers have been updated.

XRP price started a fresh decline below the $2.150 zone. The price is now consolidating above $2.00 and facing hurdles near the $2.120 zone.
- XRP price started a downside correction from the $2.250 resistance zone.
- The price is now trading below $2.10 and the 100-hourly Simple Moving Average.
- There is a key bearish trend line forming with resistance at $2.130 on the hourly chart of the XRP/USD pair (data source from Kraken).
- The pair might extend losses if there is a close below the $2.00 support zone.
XRP Price Faces Resistance
XRP price started a downside correction from the $2.250 zone, like Bitcoin and Ethereum. The price traded below the $2.150 and $2.120 levels to enter a bearish zone.
The price even spiked below $2.050 but stayed above $2.00. A low was formed at $2.036 and the price is now consolidating losses. There was a recovery wave above the $2.10 level. The price spiked above the 50% Fib retracement level of the downward move from the $2.184 swing high to the $2.036 low.
The price is now trading below $2.10 and the 100-hourly Simple Moving Average. On the upside, the price might face resistance near the $2.120 level. There is also a key bearish trend line forming with resistance at $2.130 on the hourly chart of the XRP/USD pair.

The trend line is near the 61.8% Fib retracement level of the downward move from the $2.184 swing high to the $2.036 low. The first major resistance is near the $2.180 level. The next resistance is $2.20. A clear move above the $2.20 resistance might send the price toward the $2.250 resistance. Any more gains might send the price toward the $2.320 resistance or even $2.350 in the near term. The next major hurdle for the bulls might be $2.50.
More Losses?
If XRP fails to clear the $2.120 resistance zone, it could start another decline. Initial support on the downside is near the $2.030 level. The next major support is near the $2.00 level.
If there is a downside break and a close below the $2.00 level, the price might continue to decline toward the $1.920 support. The next major support sits near the $1.840 zone.
Technical Indicators
Hourly MACD – The MACD for XRP/USD is now losing pace in the bearish zone.
Hourly RSI (Relative Strength Index) – The RSI for XRP/USD is now below the 50 level.
Major Support Levels – $2.030 and $2.00.
Major Resistance Levels – $2.120 and $2.180.

Bitcoin Price Range-Bound—But a Move Higher May Be Brewing?

How Crypto Traders Made $666K from $4.5K in One Trade?

Bitcoin Whales Withdraw $280 Million: Bullish Signal?
Gary Gensler Explains Why Bitcoin Will Outlast Altcoins

How Rising Solana Network Inflows Could Drive SOL Price to $150?

XRP’s $2.00 Pivot Point—A Launchpad or Breakdown Zone?


-
 Altcoin22 hours ago
Mantra (OM) Price Pumps As Founder Reveals Massive Token Burn Plan
-
 Altcoin17 hours ago
DOGE Whale Moves 478M Coins As Analyst Predicts Dogecoin Price Breakout “Within Hours”
-

 Market19 hours ago
How It’s Impacting the Network
-

 Market12 hours ago
Crypto Market Lost $633 Billion in Q1 2025, CoinGecko Finds
-
 Altcoin19 hours ago
Analyst Reveals Why The Solana Price Can Still Drop To $65
-

 Market17 hours ago
Pi Network Drops10% as Outflows Surge, Death Cross Looms
-
 Market23 hours ago
Mantra’s OM Token Surges 25% After Token Burn Announcement
-

 Market15 hours ago
Bitcoin and Ethereum Now Accepted by Panama City Government

 Arabic
 Chinese (Simplified)
 Dutch
Dutch English
 French
 German
 Italian
 Portuguese
 Russian
 Spanish
 Vietnamese