Market
Arbitrum (ARB) Faces Headwinds Despite Recent Price Increase

During the trading session on May 28, Arbitrum (ARB) bulls took control, propelling the Layer 2 (L2) token’s price above its critical 20-day exponential moving average (EMA).
While this often suggests a potential shift toward an upward trend, assessing other key technical indicators showed that the uptrend might materialize slower than anticipated.
Arbitrum Distribution Remains Higher Than Its Accumulation
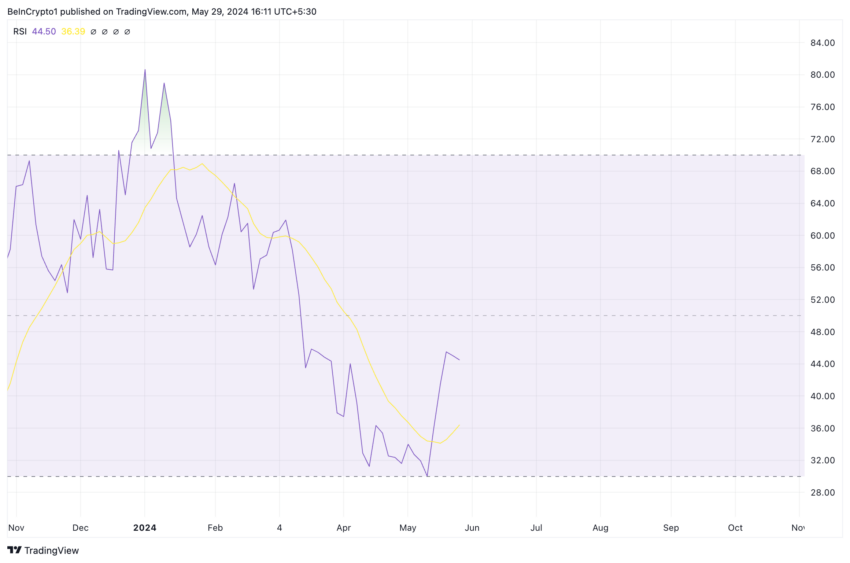
Arbitrum’s Relative Strength Index (RSI) rested below its 50-neutral zone at press time. This indicator measures the momentum of an asset’s price movement.
When it returns a value above 70, it indicates that the asset might be overbought. Conversely, an RSI value below 30 suggests the asset might be oversold, potentially signaling a buying opportunity.
At 44.50 at press time, the indicator suggested although ARB traded above a key moving average, its sell-offs still outpaced its accumulation.

Confirming the rise in selling pressure, ARB’s Chaikin Money Flow (CMF) returned a negative value of -0.09 as of this writing.
This indicator assesses buying and selling pressure in an asset’s price movement. When it returns a value above zero, it indicates that more money flows into the asset on up days, suggesting potential accumulation by investors.
Read More: What Is Arbitrum?
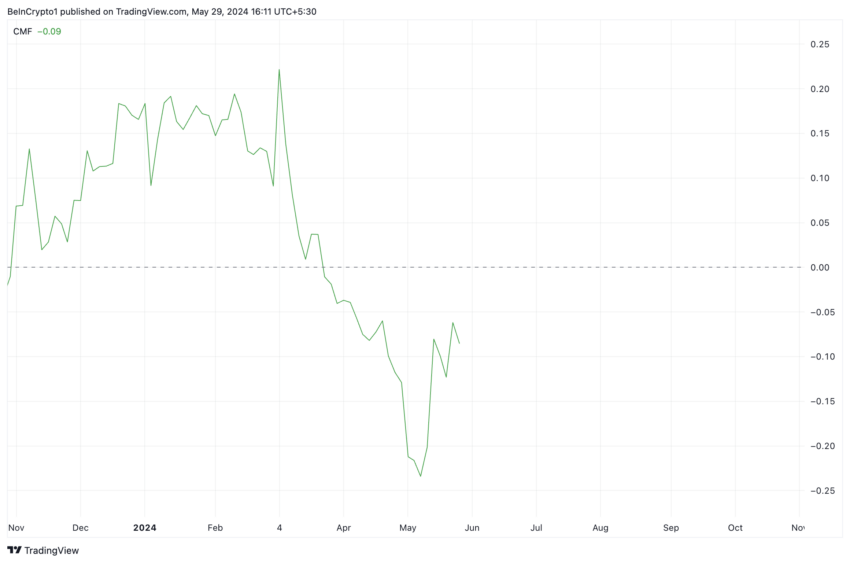
Conversely, a negative CMF value suggests that more money is flowing out on down days, potentially signaling investor distribution. A negative CMF is often taken as a cue to exit long positions and occupy short positions, a move known to put downward pressure on an asset’s price.
ARB Price Prediction: Futures Traders Are Moving Differently
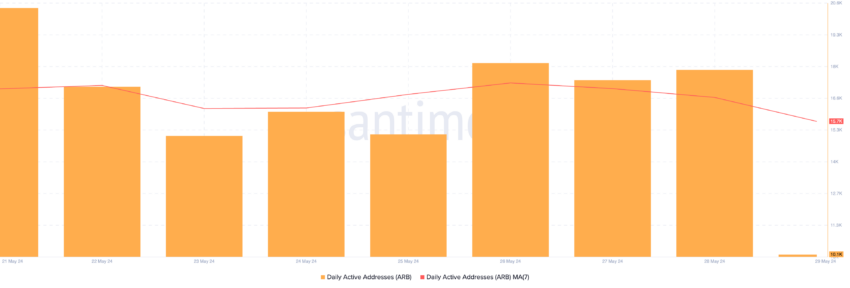
The decline in ARB’s daily active addresses makes a downward correction in its price more likely. On-chain data assessed using a seven-day moving average showed that in the last week, the number of daily addresses executing ARB transactions has dropped by almost 10%.

Interestingly, despite the significant bearish sentiment in the ARB market, its futures traders have maintained a bullish outlook. The token’s funding rate across cryptocurrency exchanges has remained positive.
Funding rates are used in perpetual futures contracts to ensure the contract price stays close to the spot price.
When an asset’s funding rate is positive, it suggests that there is a stronger demand for long positions in its perpetual futures contract than for short positions. This is a bullish sign, as it means that more traders are accumulating in anticipation of a price rally.
If this pushes up demand for ARB, it may continue to trade above its 20-day EMA and exchange hands at $1.2.
Read More: Arbitrum (ARB) Price Prediction 2024/2025/2035
However, if the bears retain market control and put more pressure on its price, ARB’s value may drop to $1.11.
Disclaimer
In line with the Trust Project guidelines, this price analysis article is for informational purposes only and should not be considered financial or investment advice. BeInCrypto is committed to accurate, unbiased reporting, but market conditions are subject to change without notice. Always conduct your own research and consult with a professional before making any financial decisions. Please note that our Terms and Conditions, Privacy Policy, and Disclaimers have been updated.