
Market
Analyst Says XRP Remains Strongest Compared To Bitcoin And Ethereum, Here’s Why

Crypto analyst RLinda has revealed that XRP is showing impressive strength despite the decline in Bitcoin and Ethereum’s price. She explained why XRP suddenly has such a bullish outlook, considering that the crypto token has underperformed since the start of the year.
XRP Is The “Strongest” In The Market
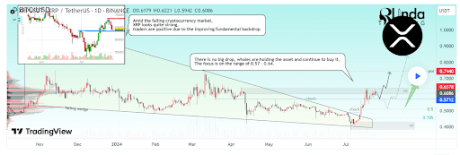
RLinda mentioned in a post on TradingView that XRP is the strongest in the market. She noted that the crypto token has been holding quite well as traders and investors are again becoming bullish on XRP due to its “improving fundamental backdrop.” She alluded to the long-running legal battle between the US Securities and Exchange Commission (SEC) and how Ripple CEO Brad Garlinghouse recently stated that he expects the lawsuit to end “very soon.”
Related Reading
RLinda also mentioned the rumors that the SEC’s closed-door meeting on July 25 was related to a potential settlement with Ripple. As such, these bullish fundamentals have led to rising trading volumes, prices hitting local highs, and increased whale activity. Bitcoinist recently reported that XRP whales accumulated over 140 million XRP tokens this past week.
Network activity on the XRP Ledger (XRPL) has increased significantly, with a notable increase in the number of new addresses on the network and total addresses interacting on the network, both metrics at their highest levels since March. This again highlights the bullish sentiment that investors are beginning to have towards XRP in anticipation of higher prices.
These investors expect that the conclusion of the legal battle between the SEC and Ripple could trigger a massive rally for XRP, especially considering that this case is believed to have been a stumbling block to XRP’s growth in the 2021 bull run. XRP is also long overdue for such a rally, seeing how it has consolidated for over six years. As such, an end to the lawsuit could provide the much-needed catalyst to spark such price movement.
Interestingly, crypto analysts like JackTheRippler previously predicted that XRP could climb as high as $100 once the case between the SEC and Ripple ends.
Key Price Levels To Watch Out For
RLinda mentioned that the price range between $0.6378 and $0.5712 is worth paying attention to from a technical perspective. She claimed that XRP’s price may test liquidity below the support before subsequent growth if it fails to break the resistance level at $0.6378. She also highlighted another crucial resistance level at $0.7440.
Related Reading
Meanwhile, according to RLinda, $0.5712 and $0.5100 are crucial support levels that XRP needs to hold above, as a drop below these levels could invalidate its bullish outlook. The analyst again alluded to the lawsuit and asserted that it would give XRP a “second life.” She suggested this could lead to a successful breakout from the $0.6378 price level, which she added will “open a new path” for the crypto token.
At the time of writing, XRP is trading at around $0.6, up almost 1% in the last 24 hours, according to data from CoinMarketCap.
Featured image created with Dall.E, chart from Tradingview.com


Reason to trust
![]()
Strict editorial policy that focuses on accuracy, relevance, and impartiality
Created by industry experts and meticulously reviewed
The highest standards in reporting and publishing
Strict editorial policy that focuses on accuracy, relevance, and impartiality
Morbi pretium leo et nisl aliquam mollis. Quisque arcu lorem, ultricies quis pellentesque nec, ullamcorper eu odio.
Bitcoin price started a fresh decline below the $83,500 zone. BTC is consolidating losses and might start another decline below the $80,000 level.
- Bitcoin started a fresh decline below the $82,000 zone.
- The price is trading below $81,200 and the 100 hourly Simple moving average.
- There was a break below a connecting bullish trend line with support at $83,000 on the hourly chart of the BTC/USD pair (data feed from Kraken).
- The pair could start another increase if it clears the $80,500 zone.
Bitcoin Price Dips Below Support
Bitcoin price failed to settle above the $83,500 level and started a fresh decline. BTC traded below the $83,000 ad $82,000 levels to enter a bearish zone.
There was a break below a connecting bullish trend line with support at $83,000 on the hourly chart of the BTC/USD pair. The pair even dived below the $80,000 support zone. A low was formed at $77,057 and the price started a recovery wave.
There was a move above the $78,800 level. The price climbed above the 23.6% Fib retracement level of the recent decline from the $83,680 swing high to the $77,057 low. However, the price is struggling to continue higher.
Bitcoin price is now trading below $81,500 and the 100 hourly Simple moving average. On the upside, immediate resistance is near the $80,000 level. The first key resistance is near the $80,500 level or the 50% Fib retracement level of the recent decline from the $83,680 swing high to the $77,057 low.

The next key resistance could be $81,500. A close above the $81,500 resistance might send the price further higher. In the stated case, the price could rise and test the $82,500 resistance level. Any more gains might send the price toward the $83,500 level.
Another Decline In BTC?
If Bitcoin fails to rise above the $80,500 resistance zone, it could start a fresh decline. Immediate support on the downside is near the $77,500 level. The first major support is near the $77,000 level.
The next support is now near the $76,500 zone. Any more losses might send the price toward the $75,000 support in the near term. The main support sits at $74,200.
Technical indicators:
Hourly MACD – The MACD is now gaining pace in the bearish zone.
Hourly RSI (Relative Strength Index) – The RSI for BTC/USD is now below the 50 level.
Major Support Levels – $77,500, followed by $77,000.
Major Resistance Levels – $80,000 and $80,500.

Cardano (ADA) has faced a sharp price decline amid heightened volatility and widespread liquidations across the broader crypto market. Over the past 24 hours, ADA has shed more than 10% of its value, marking one of its steepest single-day losses in recent months.
ADA is now trading at $0.52, levels last seen in November 2024. This reinforces the growing bearish sentiment against the altcoin.
Death Cross and Heavy Outflows Weigh on ADA
ADA’s downturn in the past day has pushed its price into precarious territory, with a death cross now appearing on its daily chart. This marks the first time the pattern will appear on ADA charts since May 2024.
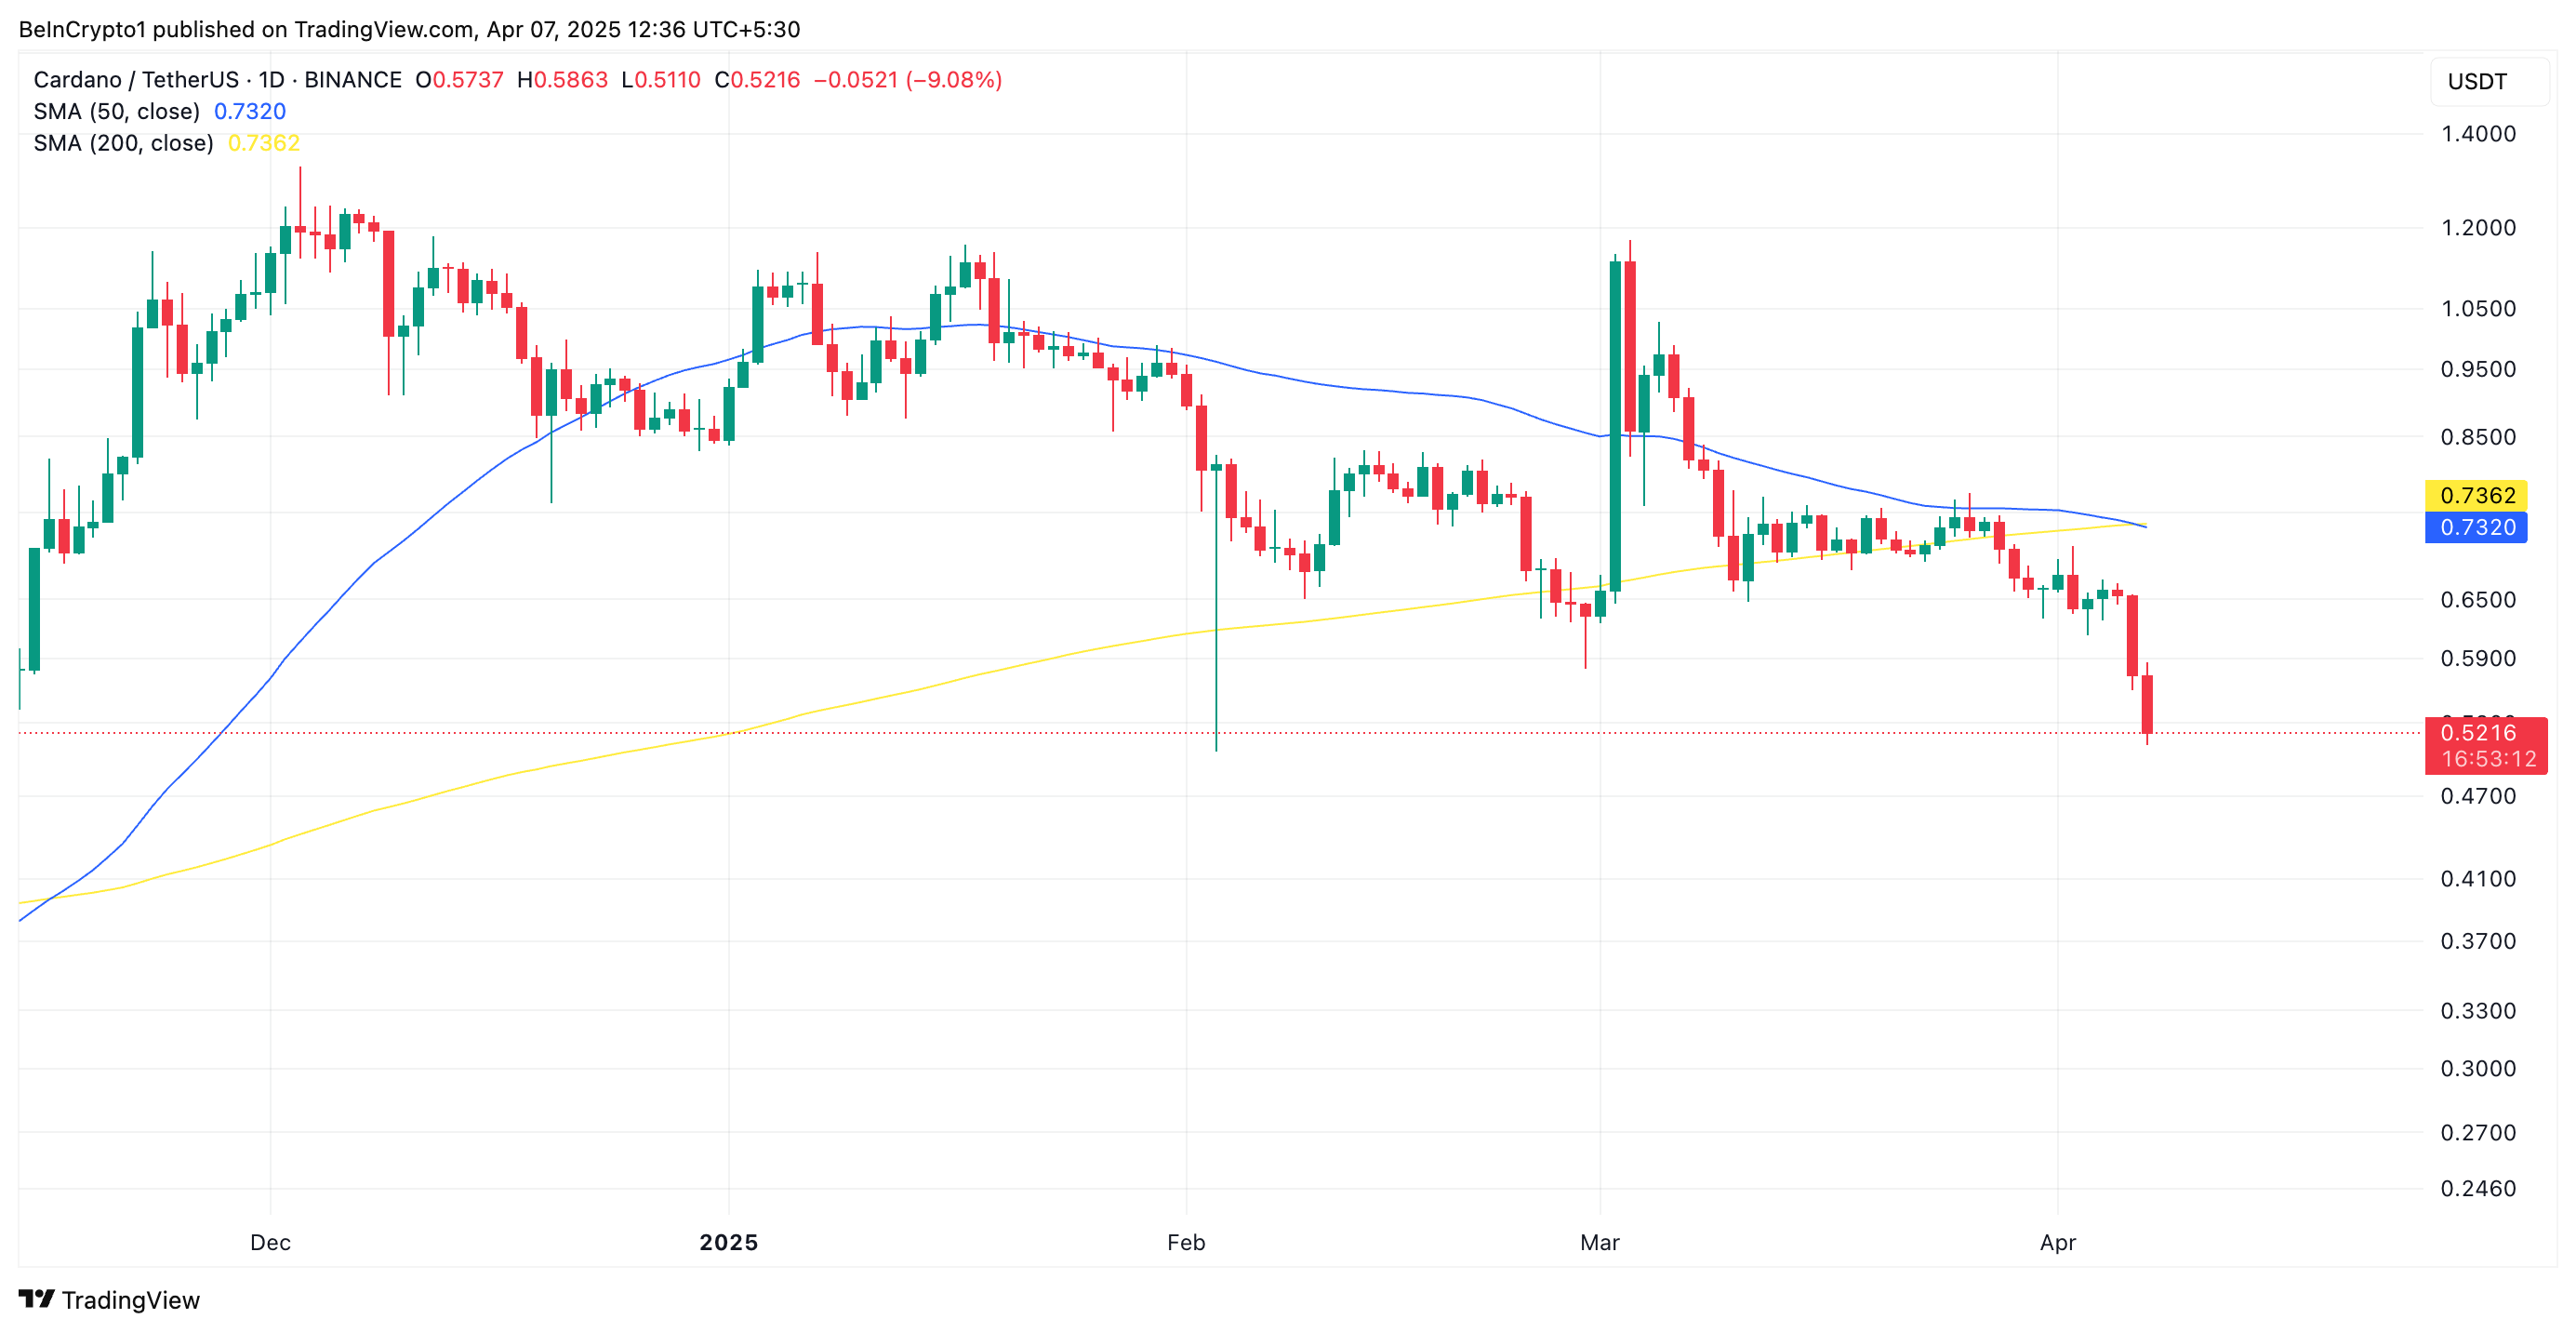
The death cross pattern—where the 50-day moving average falls below the 200-day moving average—is viewed as a long-term bearish signal, often preceding extended periods of price weakness.
When a death cross is formed, it indicates a definitive shift in market sentiment from bullish to bearish, leading to increased selling pressure and a possible further decline in price. This suggests ADA could face continued downward pressure in the near term if the bulls remain in the shadows.
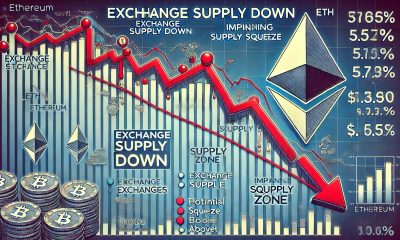
Moreover, the steady outflows from the ADA spot markets add to the downward pressure on its price. According to Coinglass, ADA spot outflows have totaled $12 million so far today.
Over the past month, capital exit from the ADA spot markets has exceeded $150 million.
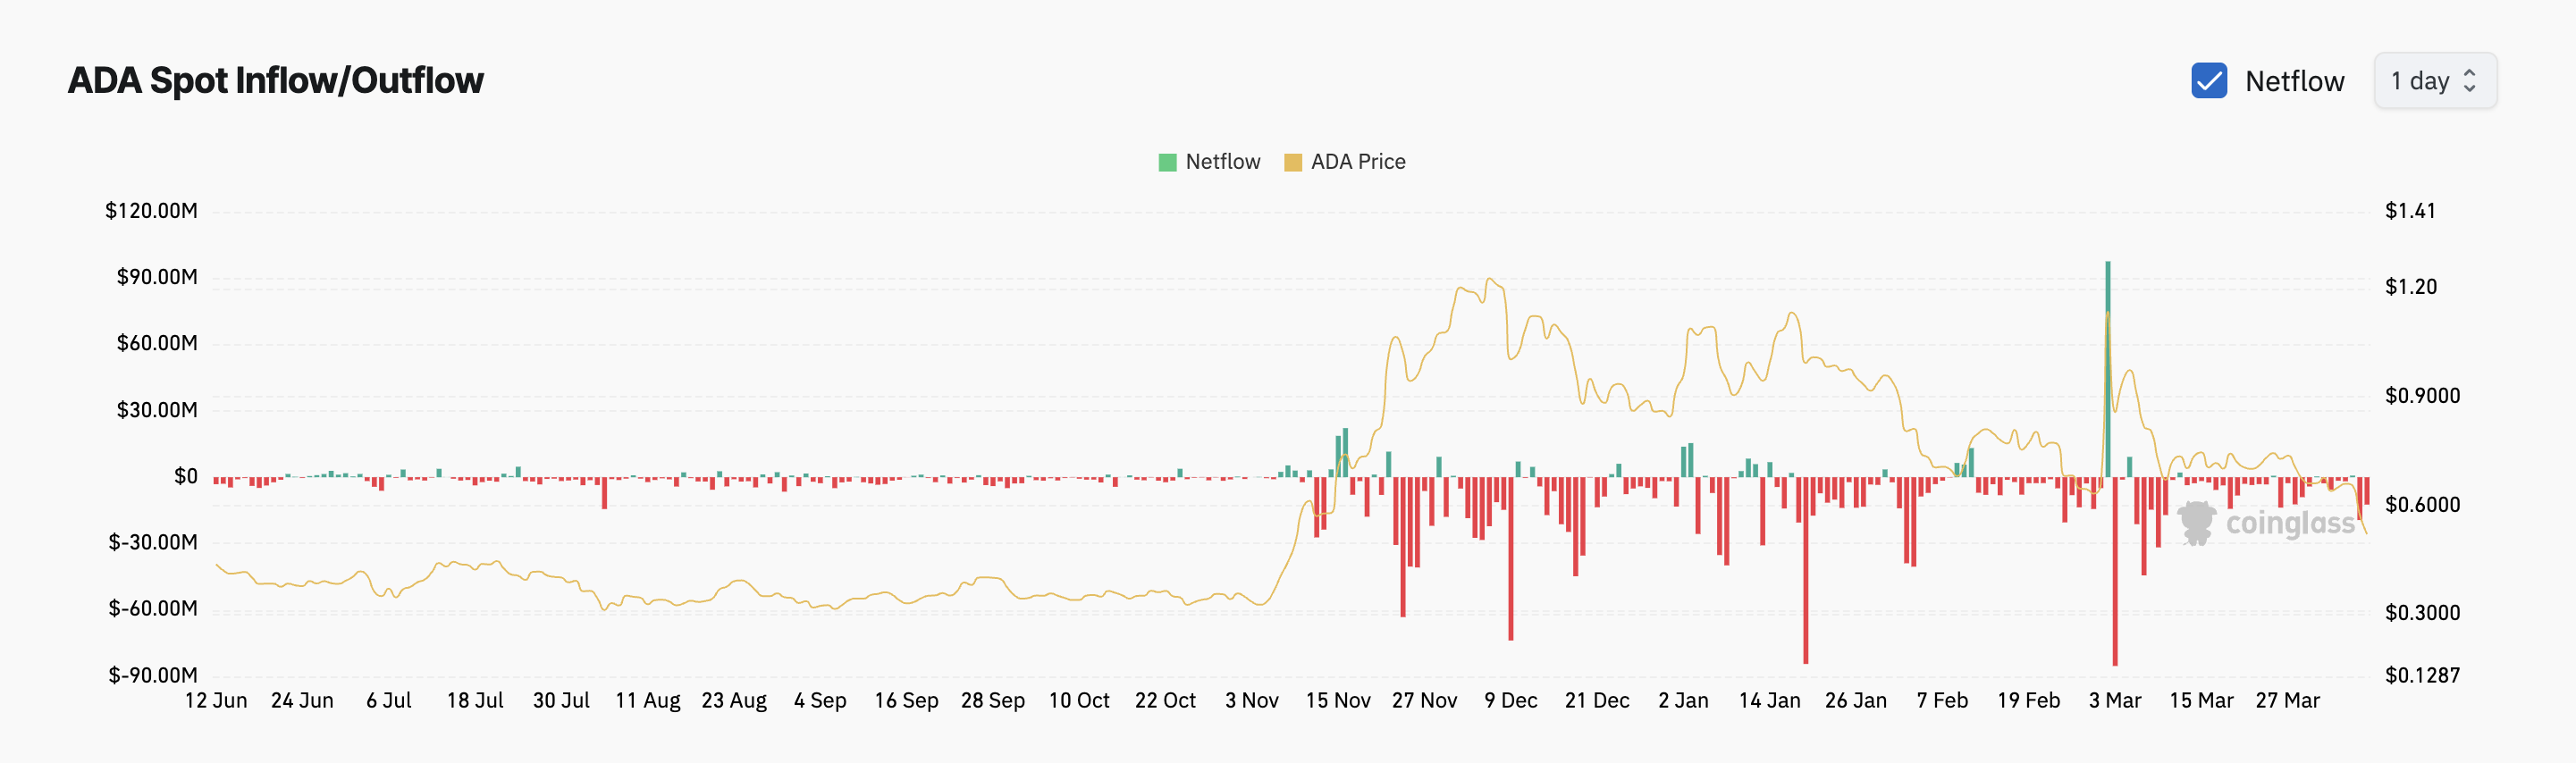
Spot outflows like this indicate bearish sentiment, as they suggest that investors are pulling their capital in anticipation of further price drops or moving funds into other assets.
This persistent trend signals a loss of confidence among ADA traders as they continuously liquidate their positions. This has worsened the market’s selling pressure and contributed significantly to ADA’s price troubles.
Cardano’s Downward Trend Deepens: Death Cross Threatens More Drop
While broader market instability has impacted many altcoins, ADA’s price drop is notable due to the formation of the Death Cross. The emergence of this technical indicator, combined with a multi-month price low as buying activity falls, suggests ADA could face continued downward pressure in the near term.
In this scenario, its value could dip to $0.44, marking a 14% decline from its current value.
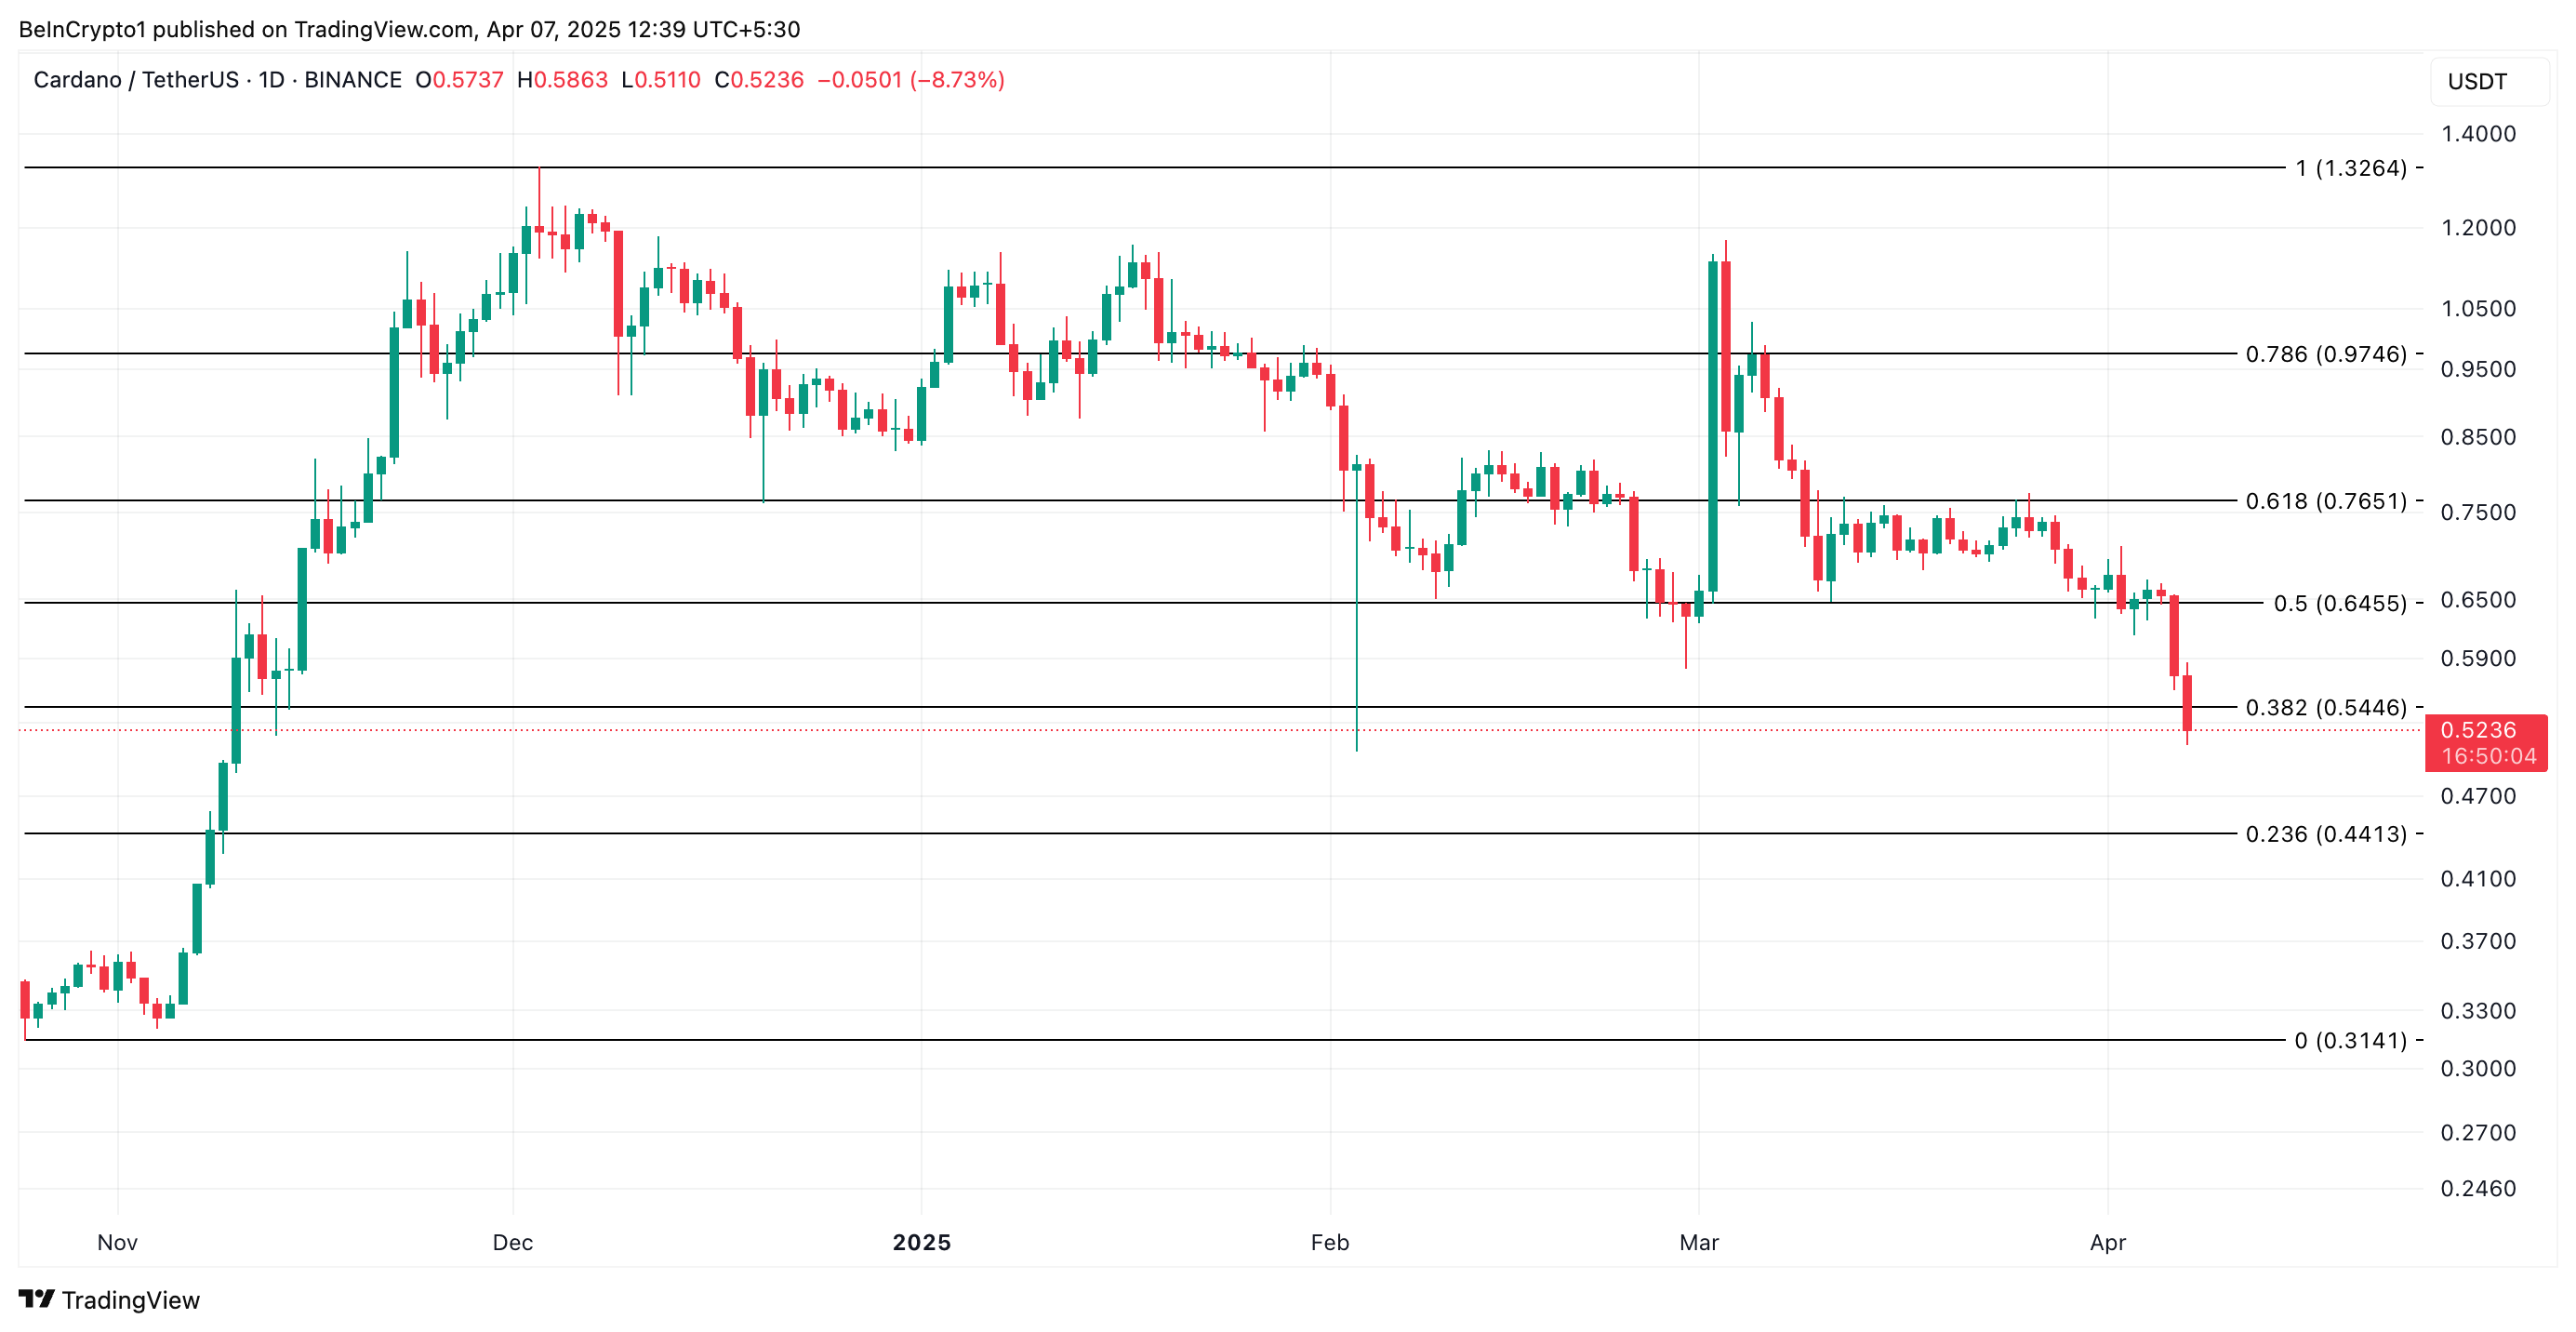
On the other hand, a resurgence in new demand for the altcoin will invalidate this bearish outlook. In that scenario, ADA’s price could regain its losses and attempt to break above resistance at $0.54.
If successful, it could extend its gains to $0.64.
Disclaimer
In line with the Trust Project guidelines, this price analysis article is for informational purposes only and should not be considered financial or investment advice. BeInCrypto is committed to accurate, unbiased reporting, but market conditions are subject to change without notice. Always conduct your own research and consult with a professional before making any financial decisions. Please note that our Terms and Conditions, Privacy Policy, and Disclaimers have been updated.

Reason to trust
![]()
Strict editorial policy that focuses on accuracy, relevance, and impartiality
Created by industry experts and meticulously reviewed
The highest standards in reporting and publishing
Strict editorial policy that focuses on accuracy, relevance, and impartiality
Morbi pretium leo et nisl aliquam mollis. Quisque arcu lorem, ultricies quis pellentesque nec, ullamcorper eu odio.
Ethereum price failed to recover above $1,820 and dropped below $1,650. ETH is now consolidating losses and might face resistance near the $1,675 zone.
- Ethereum failed to stay above the $1,650 and $1,620 levels.
- The price is trading below $1,650 and the 100-hourly Simple Moving Average.
- There was a break below a connecting bullish trend line with support at $1,775 on the hourly chart of ETH/USD (data feed via Kraken).
- The pair remains at risk of more losses below the $1,550 support zone.
Ethereum Price Dips Further
Ethereum price failed to stay above the $1,800 support zone and extended losses, like Bitcoin. ETH declined heavily below the $1,750 and $1,700 levels.
There was a break below a connecting bullish trend line with support at $1,775 on the hourly chart of ETH/USD. The bears even pushed the price below the $1,600 level. A low was formed at $1,537 and the price recently corrected some losses.
There was a move above the $1,580 level. The price tested the 23.6% Fib retracement level of the downward move from the $1,815 swing high to the $1,537 low. However, the bears are active near the $1,600 zone. The price is now consolidating and facing many hurdles.
Ethereum price is now trading below $1,650 and the 100-hourly Simple Moving Average. On the upside, the price seems to be facing hurdles near the $1,600 level.
The next key resistance is near the $1,675 level or the 50% Fib retracement level of the downward move from the $1,815 swing high to the $1,537 low. The first major resistance is near the $1,710 level. A clear move above the $1,710 resistance might send the price toward the $1,820 resistance.

An upside break above the $1,820 resistance might call for more gains in the coming sessions. In the stated case, Ether could rise toward the $1,880 resistance zone or even $1,920 in the near term.
Another Decline In ETH?
If Ethereum fails to clear the $1,600 resistance, it could start another decline. Initial support on the downside is near the $1,550 level. The first major support sits near the $1,535 zone.
A clear move below the $1,535 support might push the price toward the $1,420 support. Any more losses might send the price toward the $1,400 support level in the near term. The next key support sits at $1,350.
Technical Indicators
Hourly MACD – The MACD for ETH/USD is gaining momentum in the bearish zone.
Hourly RSI – The RSI for ETH/USD is now below the 50 zone.
Major Support Level – $1,550
Major Resistance Level – $1,600

Bitcoin Price Crashes Hard—Is The Selloff Just Getting Started?

Will ADA Drop to $0.44?

Will 2025’s Crypto Market Mirror 2020’s Rebound? Analysts Predict

Ethereum Price Tanks Hard—Can It Survive the $1,500 Test?

Solana (SOL) Price Falls Below $100, Crashes To 14-Month Low
$1 Billion in Liquidations Over the Weekend

2.52 Million Altcoins Are Ruining Crypto’s Future

Animoca Brands Valuation Tanks 75% In Two Years, Here’s Why

Crypto exchange BingX hacked for $43 million

Are The Big Players Losing Interest?

Hong Kong’s Securities Association Tips Authorities On Crypto Self-Regulation

Coinbase cbBTC Set to go Live on Solana
2.52 Million Altcoins Are Ruining Crypto’s Future
Animoca Brands Valuation Tanks 75% In Two Years, Here’s Why
Crypto exchange BingX hacked for $43 million
Are The Big Players Losing Interest?
Hong Kong’s Securities Association Tips Authorities On Crypto Self-Regulation
Coinbase cbBTC Set to go Live on Solana
-

 Bitcoin24 hours ago
Altseason Dead On Arrival? Data Shows Bitcoin Outperforming All Categories
-

 Market24 hours ago
HBAR Could Avoid $30 Million Liquidation Thanks to Death Cross
-

 Bitcoin19 hours ago
US Macro Setup To Favour New Bitcoin ATH In The Long Run
-
 Altcoin17 hours ago
Expert Reveals Decentralized Strategy To Stabilize Pi Network Price
-

 Market23 hours ago
Conor McGregor’s Crypto Token REAL Tanks After Launch
-

 Market21 hours ago
Ripple Highlights UK’s Potential to Become Global Crypto Hub
-

 Market20 hours ago
Key Solana Holders’ 6-Month High Accumulation Signal Price Rise
-

 Market19 hours ago
3 Token Unlocks for This Week: AXS, JTO, XAV