
Market
Alameda Unstakes $23 Million in Solana for 38 FTX Addresses

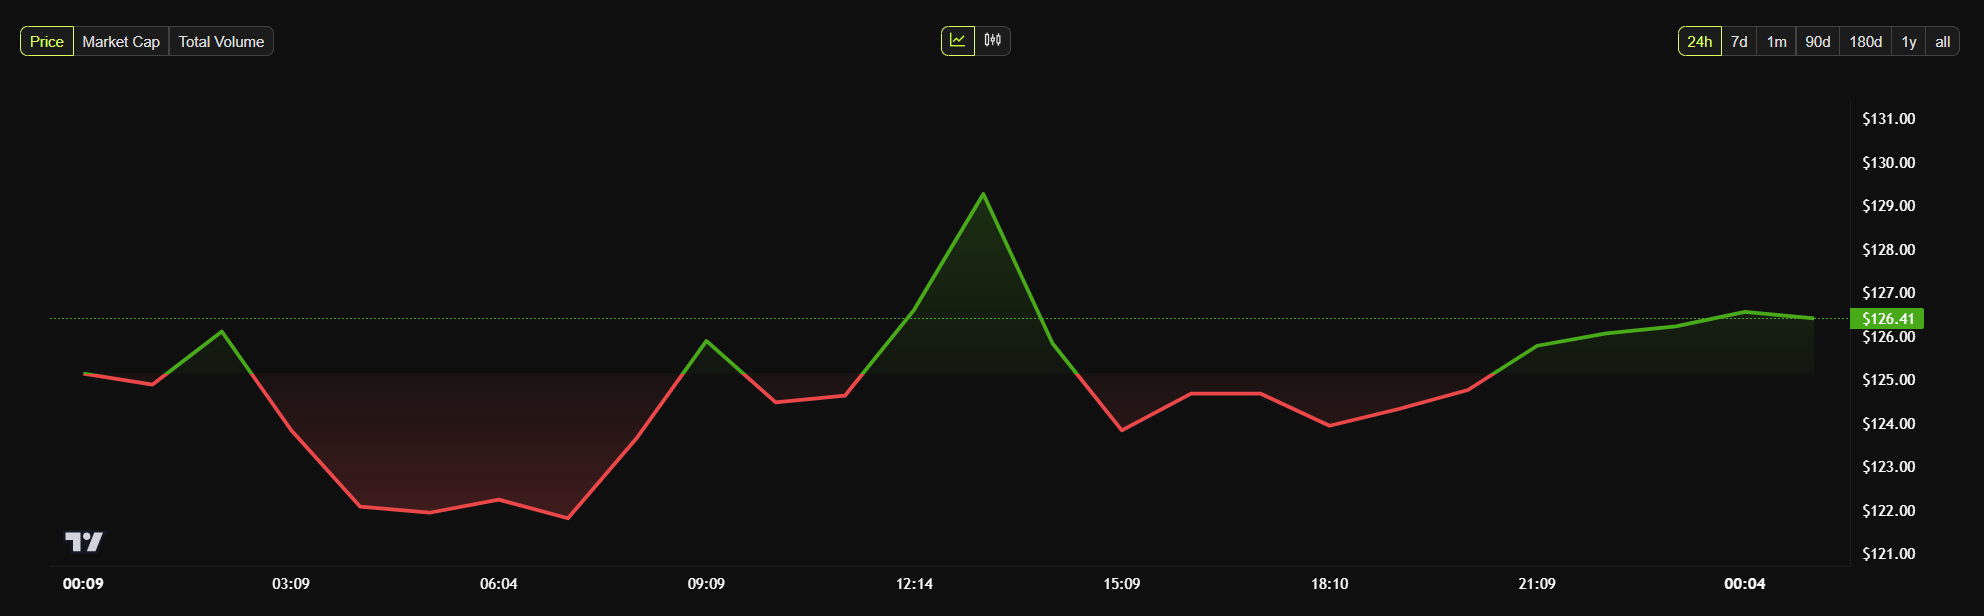
Alameda Research unlocked Solana tokens worth nearly $23 million today. Despite this notable unlock, it barely affected SOL’s underlying price or demand dynamics.
FTX’s reimbursement process has begun, and the firm unlocked SOL worth $1.57 billion. Alameda’s comparatively small unlock exists in the context of bearish market factors that are drastically impacting demand.
How Will Alameda Use Its Unstaked Solana Tokens?
According to on-chain data from Arkham Intelligence, Alameda Research distributed the unstaked SOL to 38 FTX-linked addresses. As a refresher, Alameda was the trading firm linked to the FTX collapse, operated by Caroline Ellison.
“Alameda address just unstaked $23 million SOL to 38 new addresses. An FTX/Alameda staking address received $22.9 million SOL from a staking address unlock and has just distributed these funds to 37 addresses that have previously received SOL from this address. These addresses currently hold $178.82 million SOL,” Arkham claimed via social media.
Since its downfall, Alameda has moved huge amounts of assets on several occasions. For example, Alameda bankruptcy addresses staked $10 million in MATIC tokens in late 2023 and moved Ethereum worth $14.75 million in early 2024.
However, both these incidents caused significant price fluctuations in the relevant assets.
Solana’s price, on the other hand, has barely budged since these Alameda transactions took place. Yesterday, the SEC delayed several Solana ETF applications, and this had a slightly bearish impact on the altcoin’s price.
Even so, ETH jumped 10% when Alameda moved a supply worth $14.75 million. It moved much more SOL today, but this didn’t even cause the day’s largest price move.
Solana declined and spiked in a short time span, but all of this happened before the announcement. Comparatively, the Alameda unlock had practically no effect.
So far, it isn’t clear what exactly Alameda is planning to do with these unlocked Solana tokens. Last month, FTX began the first round of creditor repayments, but this will be a long process. Earlier this month, FTX also unlocked Solana tokens worth $1.57 billion.
In other words, Alameda may be planning to use these tokens as part of the FTX reimbursement process, but that might not change Solana’s demand.
The crypto market is currently in a state of Extreme Fear, and most major assets are seeing big outflows. Alameda’s actions are just one drop in a very large bucket.
Disclaimer
In adherence to the Trust Project guidelines, BeInCrypto is committed to unbiased, transparent reporting. This news article aims to provide accurate, timely information. However, readers are advised to verify facts independently and consult with a professional before making any decisions based on this content. Please note that our Terms and Conditions, Privacy Policy, and Disclaimers have been updated.


Reason to trust
![]()
Strict editorial policy that focuses on accuracy, relevance, and impartiality
Created by industry experts and meticulously reviewed
The highest standards in reporting and publishing
Strict editorial policy that focuses on accuracy, relevance, and impartiality
Morbi pretium leo et nisl aliquam mollis. Quisque arcu lorem, ultricies quis pellentesque nec, ullamcorper eu odio.
Ethereum price started a recovery wave above the $1,820 zone. ETH is now consolidating and facing hurdles near the $1,950 resistance.
- Ethereum started a recovery wave above the $1,820 level.
- The price is trading below $1,920 and the 100-hourly Simple Moving Average.
- There is a short-term bearish trend line forming with resistance at $1,900 on the hourly chart of ETH/USD (data feed via Kraken).
- The pair must clear the $1,900 and $1,950 resistance levels to start a decent increase.
Ethereum Price Faces Resistance
Ethereum price formed a base above the $1,760 level and started a recovery wave, like Bitcoin. ETH was able to clear the $1,820 and $1,850 resistance levels.
The bulls pushed the price above the $1,920 level. There was a move above the 23.6% Fib retracement level of the downward wave from the $2,150 swing high to the $1,752 low. However, the bears seem to be active near the $1,950 resistance zone.
Ethereum price is now trading below $1,920 and the 100-hourly Simple Moving Average. On the upside, the price seems to be facing hurdles near the $1,900 level.
There is also a short-term bearish trend line forming with resistance at $1,900 on the hourly chart of ETH/USD. The next key resistance is near the $1,950 level or the 50% Fib retracement level of the downward wave from the $2,150 swing high to the $1,752 low.

The first major resistance is near the $1,990 level. A clear move above the $1,990 resistance might send the price toward the $2,050 resistance. An upside break above the $2,050 resistance might call for more gains in the coming sessions. In the stated case, Ether could rise toward the $2,120 resistance zone or even $2,250 in the near term.
Another Drop In ETH?
If Ethereum fails to clear the $1,950 resistance, it could start another decline. Initial support on the downside is near the $1,845 level. The first major support sits near the $1,800 zone.
A clear move below the $1,800 support might push the price toward the $1,750 support. Any more losses might send the price toward the $1,720 support level in the near term. The next key support sits at $1,650.
Technical Indicators
Hourly MACD – The MACD for ETH/USD is gaining momentum in the bullish zone.
Hourly RSI – The RSI for ETH/USD is now above the 50 zone.
Major Support Level – $1,800
Major Resistance Level – $1,920
Reason to trust
![]()
Strict editorial policy that focuses on accuracy, relevance, and impartiality
Created by industry experts and meticulously reviewed
The highest standards in reporting and publishing
Strict editorial policy that focuses on accuracy, relevance, and impartiality
Morbi pretium leo et nisl aliquam mollis. Quisque arcu lorem, ultricies quis pellentesque nec, ullamcorper eu odio.
Ethereum price started a recovery wave above the $1,820 zone. ETH is now consolidating and facing hurdles near the $1,950 resistance.
- Ethereum started a recovery wave above the $1,820 level.
- The price is trading below $1,920 and the 100-hourly Simple Moving Average.
- There is a short-term bearish trend line forming with resistance at $1,900 on the hourly chart of ETH/USD (data feed via Kraken).
- The pair must clear the $1,900 and $1,950 resistance levels to start a decent increase.
Ethereum Price Faces Resistance
Ethereum price formed a base above the $1,760 level and started a recovery wave, like Bitcoin. ETH was able to clear the $1,820 and $1,850 resistance levels.
The bulls pushed the price above the $1,920 level. There was a move above the 23.6% Fib retracement level of the downward wave from the $2,150 swing high to the $1,752 low. However, the bears seem to be active near the $1,950 resistance zone.
Ethereum price is now trading below $1,920 and the 100-hourly Simple Moving Average. On the upside, the price seems to be facing hurdles near the $1,900 level.
There is also a short-term bearish trend line forming with resistance at $1,900 on the hourly chart of ETH/USD. The next key resistance is near the $1,950 level or the 50% Fib retracement level of the downward wave from the $2,150 swing high to the $1,752 low.
The first major resistance is near the $1,990 level. A clear move above the $1,990 resistance might send the price toward the $2,050 resistance. An upside break above the $2,050 resistance might call for more gains in the coming sessions. In the stated case, Ether could rise toward the $2,120 resistance zone or even $2,250 in the near term.
Another Drop In ETH?
If Ethereum fails to clear the $1,950 resistance, it could start another decline. Initial support on the downside is near the $1,845 level. The first major support sits near the $1,800 zone.
A clear move below the $1,800 support might push the price toward the $1,750 support. Any more losses might send the price toward the $1,720 support level in the near term. The next key support sits at $1,650.
Technical Indicators
Hourly MACD – The MACD for ETH/USD is gaining momentum in the bullish zone.
Hourly RSI – The RSI for ETH/USD is now above the 50 zone.
Major Support Level – $1,800
Major Resistance Level – $1,920
Reason to trust
![]()
Strict editorial policy that focuses on accuracy, relevance, and impartiality
Created by industry experts and meticulously reviewed
The highest standards in reporting and publishing
Strict editorial policy that focuses on accuracy, relevance, and impartiality
Morbi pretium leo et nisl aliquam mollis. Quisque arcu lorem, ultricies quis pellentesque nec, ullamcorper eu odio.
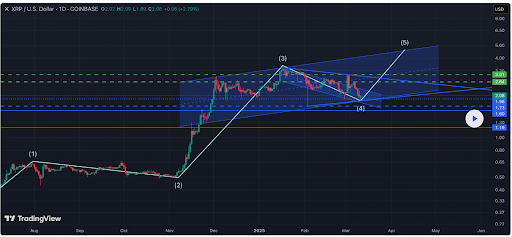
Crypto analyst CW23 has revealed that the XRP price is hinting at a symmetrical triangle, which provides a bullish outlook for the crypto. However, he warned that a price crash could occur before XRP breaks out of this triangle and rallies to the upside.
XRP Price Hints At Symmetrical Triangle
In a TradingView post, CW23 revealed that a symmetrical triangle may be forming for the XRP price. This came as he noted that XRP is bouncing off the bottom of an ascending channel, with the pinbar candle on the 4-hour chart now in upward pressure having tested the bottom. The analyst added that the crypto will probably trade in this range for a while.
Related Reading
However, CW23 stated that a symmetrical triangle is forming and it could be a larger wave 4 pullback in the Elliot wave before wave 5 takes the XRP price to a new all-time high (ATH) to round out this year’s bull cycle. The analyst’s accompanying chart showed that XRP could drop to as low as $1.70 on wave 4. Meanwhile, the asset is projected to rally to a new ATH of $5 on wave 5.
Crypto analyst ElmoX also recently predicted that the XRP price could witness a massive corrective and drop below $2 before it rallies to new highs. The analyst provided a more bullish outlook for XRP, predicting it could rally to as high as $20 in this market cycle. However, he warned that the crypto would face major resistance at $2.9 on its way to a new ATH.
The Altcoin Has Finalized Its Correction
In an X post, crypto analyst Dark Defender stated that the XRP price has finalized the correction on the four-hour time frame. He mentioned that XRP is expected to move towards $2.42 first considering the correction structures. The analyst also affirmed that the real move to the upside will start after XRP climbs above the Ichimoku clouds.
Related Reading
Dark Defender highlighted $2.22 and $2.04 as the support levels to watch out for while he stated that $4.2932 and $5.8563 are the targets which the XRP price could rally to. Crypto analyst CasiTrades highlighted the importance of the altcoin holding the support levels at $2.04 and $2.11.
She added that a hold above either of these levels is critical to maintaining the consolidation. Meanwhile, the analyst revealed that the next resistance levels are $2.25 and $2.70, which happens to be the next breakout level. CasiTrades also assured market participants that the price is still bullish, indicating it is still well primed to reach new highs.
At the time of writing, the XRP price is trading at around $2.24, up over 2% in the last 24 hours, according to data from CoinMarketCap.
Featured image from iStock, chart from Tradingview.com

Ethereum Price Consolidates and Eyes Recovery—Is a Bounce Incoming?
Ethereum Price Consolidates and Eyes Recovery—Is a Bounce Incoming?

XRP Price Hints At Symmetrical Triangle, But A Crash Could Come Before The Surge

CertiK Expert Discusses Surge in Social Engineering Crypto Scams

Cardano (ADA) Struggle Persists—Is a Rebound Still Possible?

Court Ruling Raises 3AC’s FTX Claim to $1.53 Billion

2.52 Million Altcoins Are Ruining Crypto’s Future

Animoca Brands Valuation Tanks 75% In Two Years, Here’s Why

Crypto exchange BingX hacked for $43 million

Are The Big Players Losing Interest?

Hong Kong’s Securities Association Tips Authorities On Crypto Self-Regulation

Coinbase cbBTC Set to go Live on Solana
2.52 Million Altcoins Are Ruining Crypto’s Future
Animoca Brands Valuation Tanks 75% In Two Years, Here’s Why
Crypto exchange BingX hacked for $43 million
Are The Big Players Losing Interest?
Hong Kong’s Securities Association Tips Authorities On Crypto Self-Regulation
Coinbase cbBTC Set to go Live on Solana
-

 Market23 hours ago
Solana Hit by Bearish Signal After 3 Years, Price at Risk
-

 Market22 hours ago
Aave Horizon RWA Product To Unlock Trillions in Tokenized Assets
-

 Ethereum19 hours ago
Ethereum Net Taker Volume Signals Huge Selling Pressure – Can Bulls Hold Key Levels?
-

 Market24 hours ago
This Crypto Analyst Correctly Predicted XRP Price Crash Below $2, Here’s The Rest Of The Forecast
-

 Market20 hours ago
Celestia TIA) Price Nears Consolidation After 31% Rally
-

 Market19 hours ago
Crypto Stocks Post Losses, But Bear Market Fears Diminish
-

 Market21 hours ago
XCN Dip Signals More Downside as Bearish Indicators Intensify
-

 Regulation15 hours ago
Ripple Secures DFSA License in the UAE