
Market
5 Crucial Red Flags Investors Missed

The collapse of the MANTRA (OM) token has left investors reeling, with many facing significant losses. As analysts comb through the causes of the collapse, many questions remain.
BeInCrypto consulted industry experts to identify five critical red flags behind MANTRA’s downfall and reveal strategies investors can adopt to steer clear of similar pitfalls in the future.
MANTRA (OM) Crash: What Investors Missed and How to Avoid Future Losses
On April 13, BeInCrypto broke the news of OM’s 90% crash. The collapse raised several concerns, with investors accusing the team of orchestrating a pump-and-dump scheme. Experts believe that there were many early signs of trouble.
Yet, many overlooked the risks associated with the project.
1. MANTRA Red Flag: OM Tokenomics
In 2024, the team changed OM’s tokenomics after a community vote in October. The token migrated from an ERC20 token to the native L1 staking coin for the MANTRA Chain.
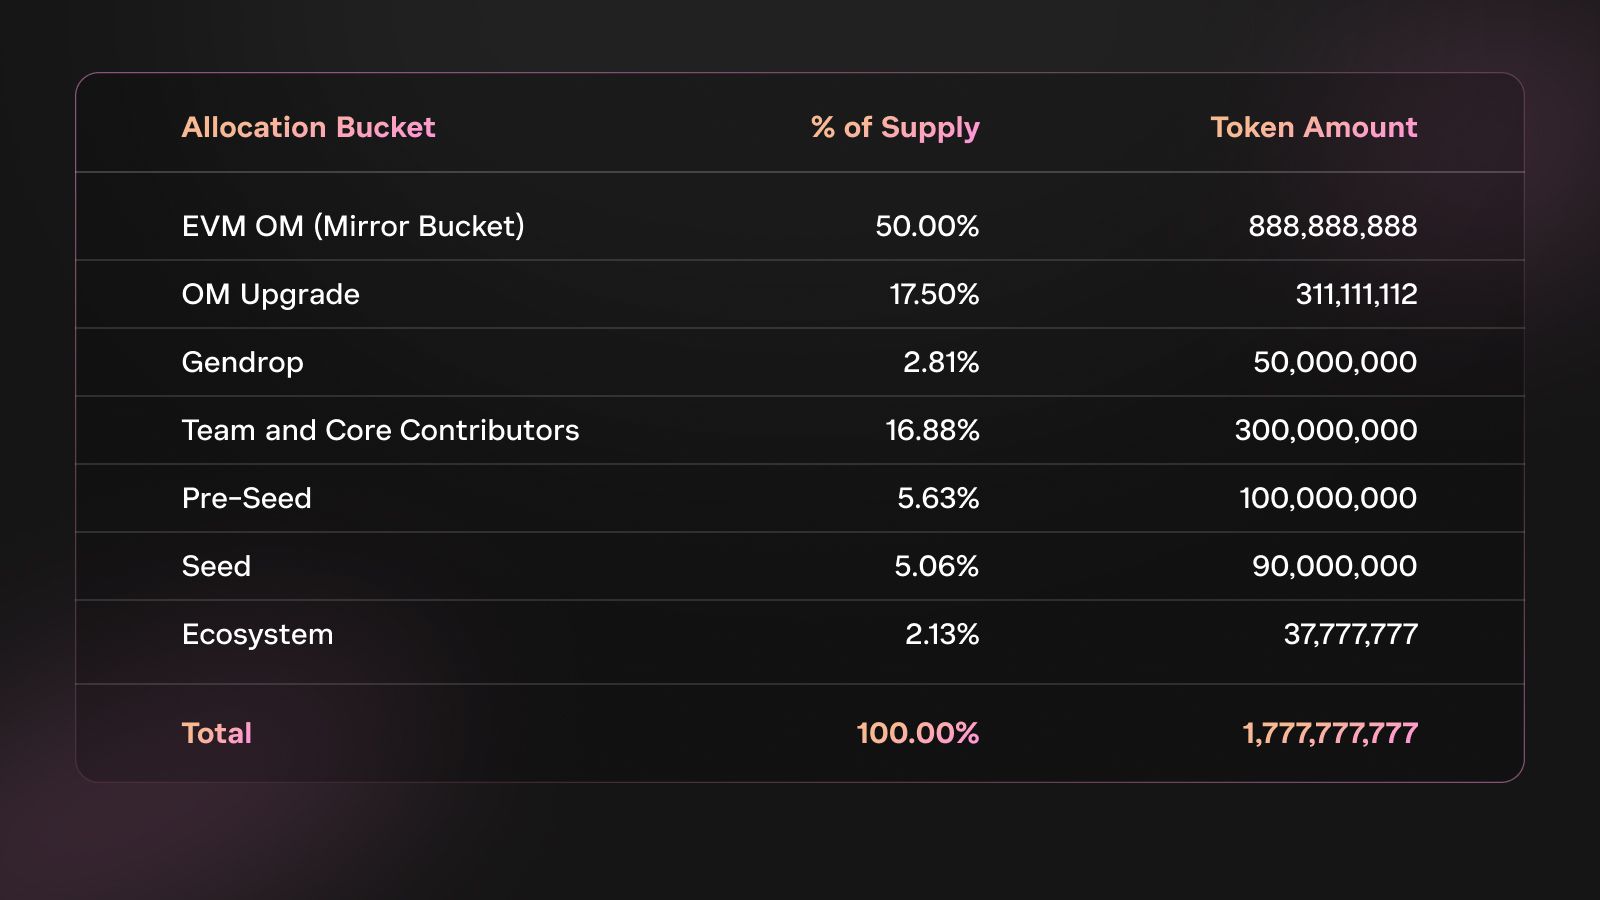
In addition, the project adopted an inflationary tokenomic model with an uncapped supply, replacing the previous hard cap. As part of this transition, the total token supply was also increased to 1.7 billion.
However, the move wasn’t without drawbacks. According to Jean Rausis, co-founder of SMARDEX, tokenomics was a point of concern in the OM collapse.
“The project doubled its token supply to 1.77 billion in 2024 and shifted to an inflationary model, which diluted its original holders. Complex vesting favored insiders, while low circulating supply and massive FDV fueled hype and price manipulation,” Jean Rausis told BeInCrypto.
Moreover, the team’s control over the OM supply also raised centralization concerns. Experts believe this was also a factor that could have led to the alleged price manipulation.
“About 90% of OM tokens were held by the team, indicating a high level of centralization that could potentially lead to manipulation. The team also maintained control over governance, which undermined the project’s decentralized nature,” said Phil Fogel, co-founder of Cork.
Strategies to Protect Yourself
Phil Fogel acknowledged that a concentrated token supply isn’t always a red flag. However, it’s crucial for investors to know who holds large amounts, their lock-up terms, and whether their involvement aligns with the project’s decentralization goals.
Moreover, Ming Wu, the founder of RabbitX, also argued that analyzing this data is essential to uncover any potential risks that could undermine the project in the long term.
“Tools like bubble maps can help identify potential risks related to token distribution,” Wu advised.
2. OM Price Action
2025 has been marked as the year of significant market volatility. The broader macroeconomic pressures have weighed heavily on the market, with the majority of the coins experiencing steep losses. Yet, OM’s price action was relatively stable until the latest crash.
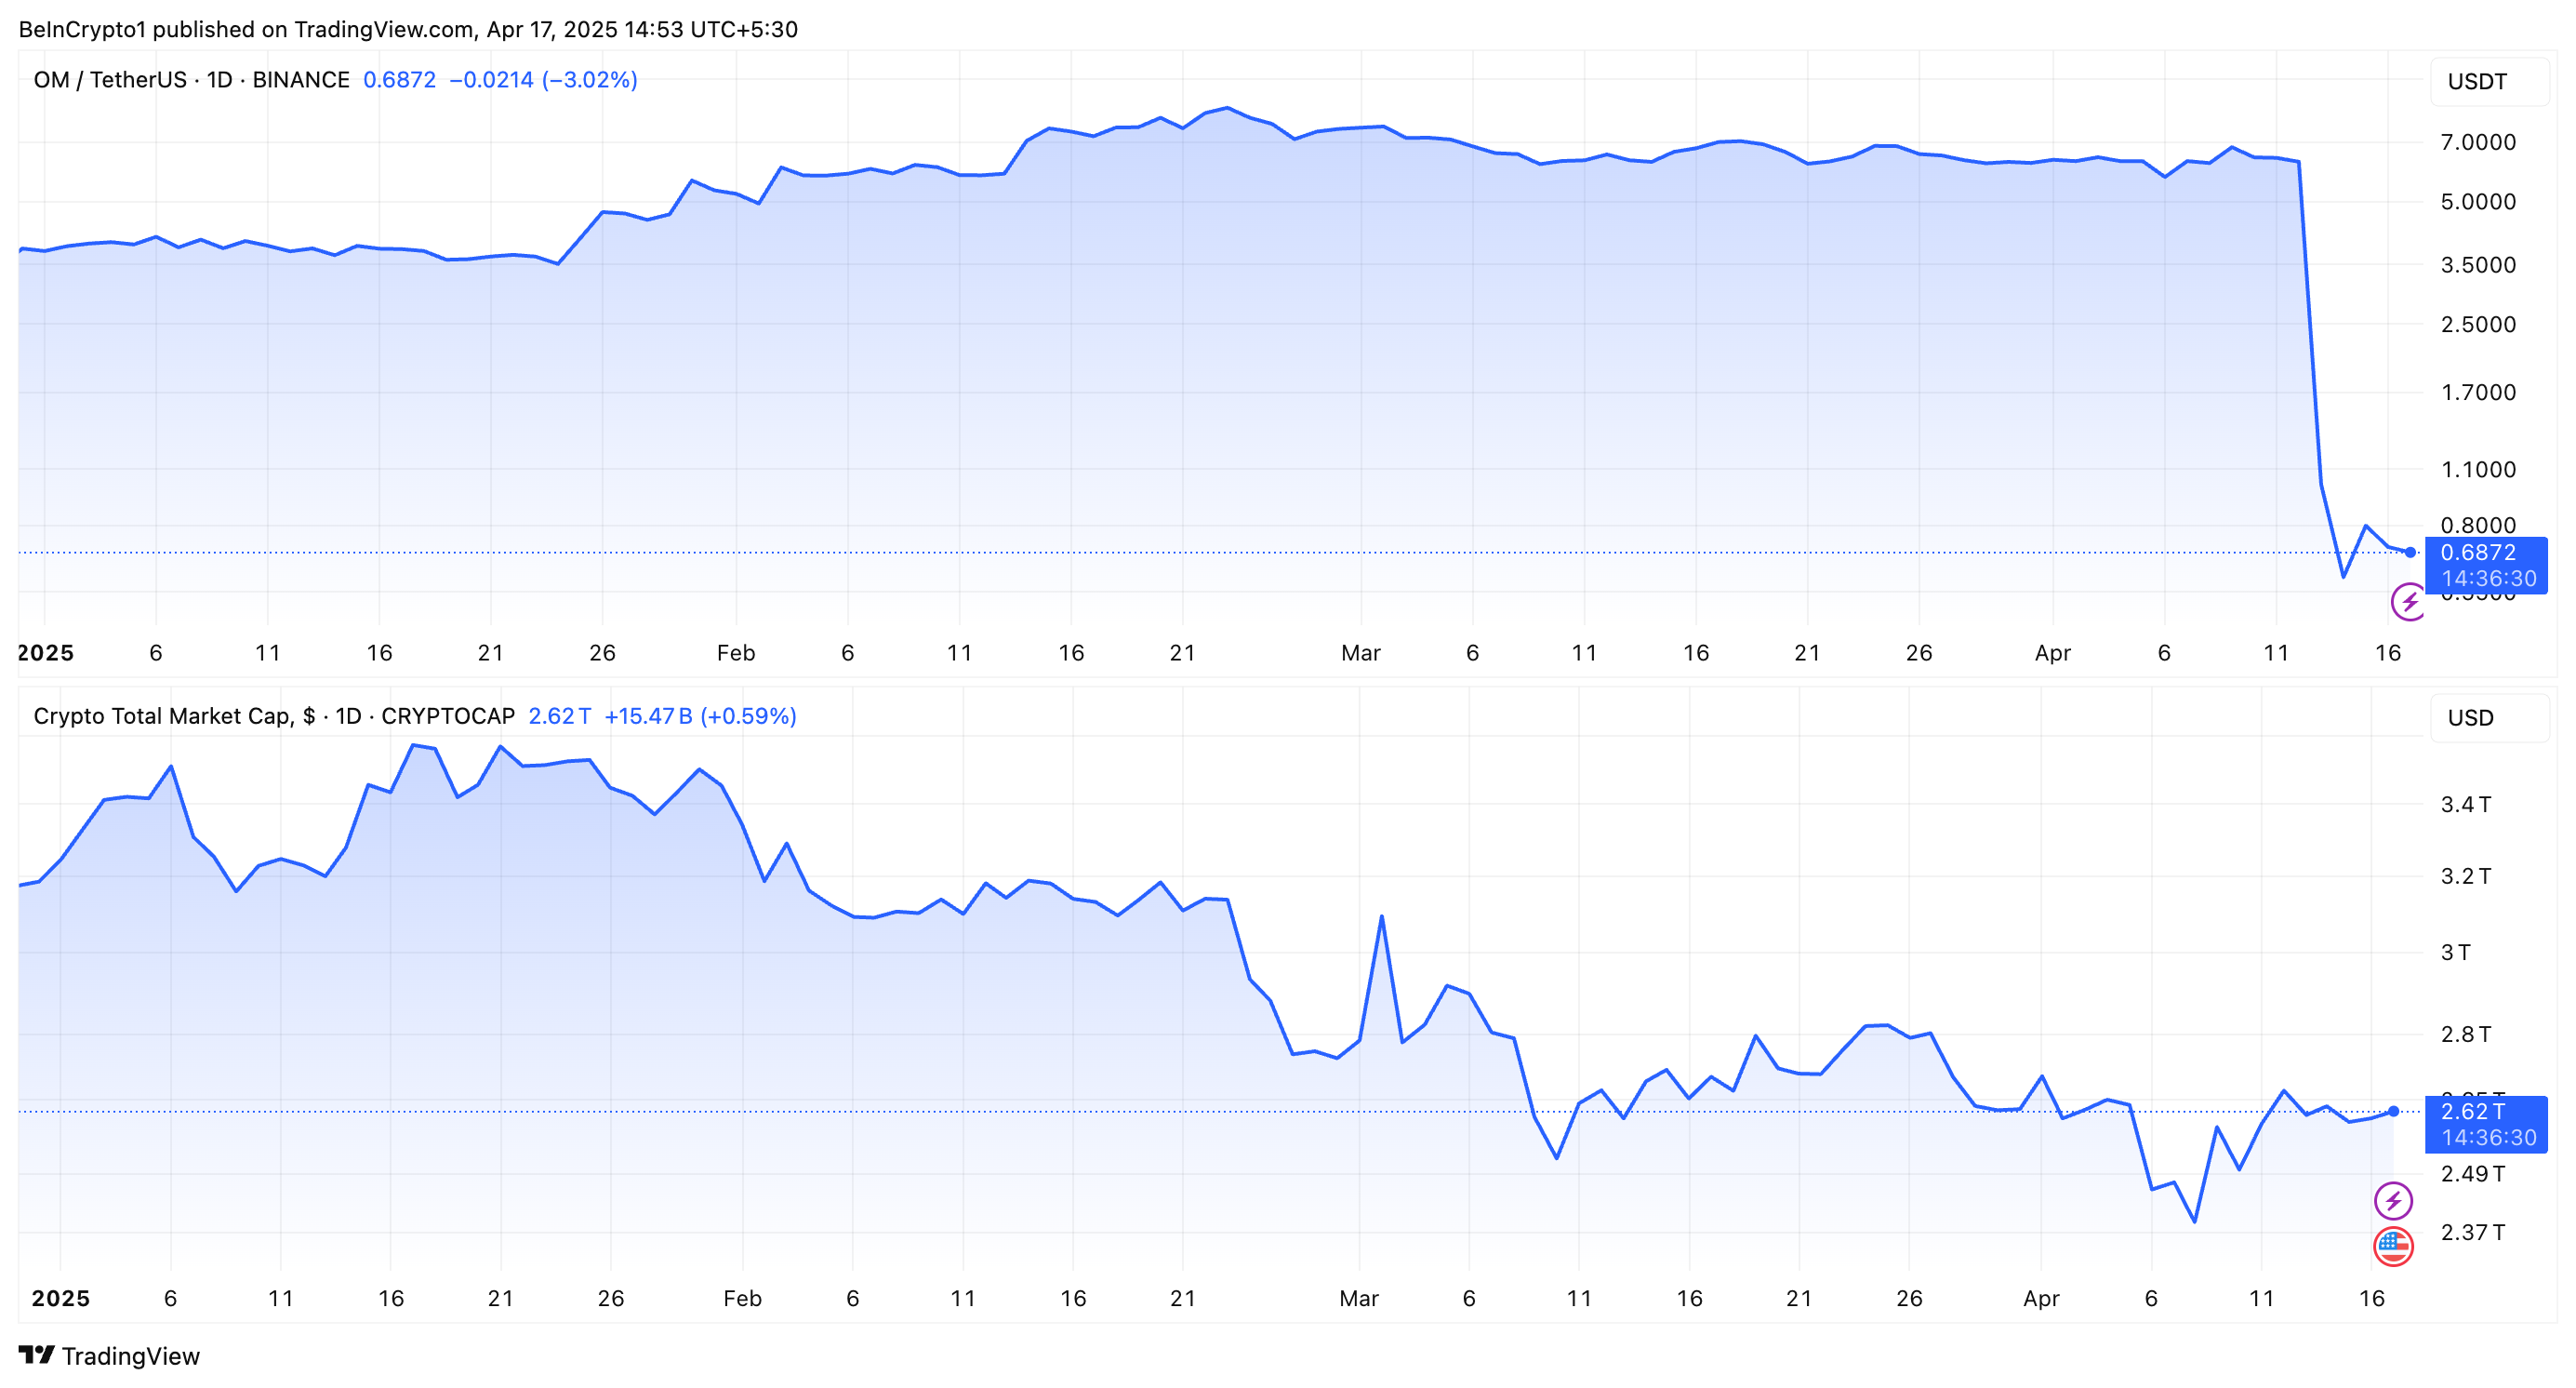
“The biggest red flag was simply the price action. The whole market was going down, and nobody cared about MANTRA, and yet its token price somehow kept pumping in unnatural patterns – pump, flat, pump, flat again,” Jean Rausis disclosed.
He added that this was a clear sign of a potential issue or problem with the project. Nevertheless, he noted that identifying the differentiating price action would require some technical analysis know-how. Thus, investors lacking the knowledge would have easily missed it.
Despite this, Rausis highlighted that even the untrained eye could find other signs that something was off, ultimately leading to the crash.
Strategies to Protect Yourself
While investors remained optimistic about OM’s resilience amid a market downturn, this ended up costing them millions. Eric He, LBank’s Community Angel Officer, and Risk Control Adviser emphasized the importance of proactive risk management to avoid OM-style collapses.
“First, diversification is key—spreading capital across projects limits single-token exposure. Stop-loss triggers (e.g., 10-20% below buy price) can automate damage control in volatile conditions,” Eric shared with BeInCrypto.
Ming Wu had a similar perspective, emphasizing the importance of avoiding over-allocation to a single token. The executive explained that a diversified investment strategy helps mitigate risk and enhances overall portfolio stability.
“Investors can use perpetual futures as a risk management tool to hedge against potential price declines in their holdings,” Wu remarked.
Meanwhile, Phil Fogel advised focusing on a token’s liquidity. Key factors include the float size, price sensitivity to sell orders, and who can significantly impact the market.
3. Project Fundamentals
Experts also highlighted major discrepancies in MANTRA’s TVL. Eric He pointed out a significant gap between the token’s fully diluted valuation (FDV) and the TVL. OM’s FDV reached $9.5 billion, while its TVL was only $13 million, indicating a potential overvaluation.
“A $9.5 billion valuation against $13 million TVL, screamed instability,” Forest Bai, co-founder of Foresight Ventures, stated.
Notably, several issues were also raised regarding the airdrop. Jean Rausis called the airdrop a “mess.” He cited many issues, including delays, frequent changes to eligibility rules, and the disqualification of half the participants. Meanwhile, suspected bots were not removed.
“The airdrop disproportionately favored insiders while excluding genuine supporters, reflecting a lack of fairness,” Phil Fogel reiterated.
The criticism expanded further as Fogel pointed out the team’s alleged associations with questionable entities and ties to questionable initial coin offerings (ICOs), raising doubts about the project’s credibility. Eric He also suggested that MANTRA was allegedly tied to gambling platforms in the past.
Strategies to Protect Yourself
Forest Bai underscored the importance of verifying the project team’s credentials, reviewing the project roadmap, and monitoring on-chain activity to ensure transparency. He also advised investors to assess community engagement and regulatory compliance to gauge the project’s long-term viability.
Ming Wu also stressed distinguishing between real growth and artificially inflated metrics.
“It’s important to differentiate real growth from activity that’s artificially inflated through incentives or airdrops, unsustainable tactics like ‘selling a dollar for 90 cents’ may generate short-term metrics but don’t reflect actual engagement,” Wu informed BeInCrypto.
Finally, Wu recommended researching the background of the project’s team members to uncover any history of fraudulent activity or involvement in questionable ventures. This would ensure that investors are well-informed before committing to any project.
4. Whale Movements
As BeInCrypto reported earlier, before the crash, a whale wallet reportedly associated with the MANTRA team deposited 3.9 million OM tokens into the OKX exchange. Experts highlighted that this wasn’t an isolated incident.
“Large OM transfers (43.6 million tokens, ~$227 million) to exchanges days prior were a major warning of potential sell-offs,” Forest Bai conveyed to BeInCrypto.
Ming Wu also explained that investors should pay close attention to such large transfers, which often act as warning signals. Moreover, analysts at CryptoQuant also outlined what investors should look out for.
“OM transfers into exchanges amounted to as much as $35 million in just an hour. This represented an alert sign as: Transfers into exchanges are below $8 million in a typical hour (excluding transfers into Binance, which are typically large given the size of the exchange). Transfers into exchanges represented more than a third of the total OM transferred, which indicates a high transfer volume into exchanges,” CryptoQuant informed BeInCrypto.
Strategies to Protect Yourself
CryptoQuant stated that investors need to monitor the flows of any token into exchanges, as it could indicate increasing price volatility in the near future.
Meanwhile, Risk Control Adviser Eric He outlined four strategies to stay up-to-date when it comes to large transfers.
- Chain Sleuthing: Tools like Arkham and Nansen allow investors to track large transfers and monitor wallet activity.
- Set Alerts: Platforms like Etherscan and Glassnode notify investors of unusual market movements.
- Track Exchange Flows: Users need to track large flows into centralized exchanges.
- Check Lockups: Dune Analytics helps investors determine if team tokens are being released earlier than expected.
He also recommended focusing on the market structure.
“OM’s crash proved market depth is non-negotiable: Kaiko data showed 1% order book depth collapsed 74% before the fall. Always check liquidity metrics on platforms like Kaiko; if 1% depth is below $500,000, that’s a red flag,” Eric revealed to BeInCrypto.
Additionally, Phil Fogel underlined the importance of monitoring platforms like X (formerly Twitter) for any rumors or discussions about possible dumps. He stressed the need to analyze liquidity to assess whether a token can handle sell pressure without causing a significant price drop.
5. Centralized Exchange Involvement
After the crash, MANTRA CEO JP Mullin was quick to blame centralized exchanges (CEXs). He said the crash was triggered by “reckless forced closures” during low-liquidity hours, alleging negligence or intentional positioning. Yet Binance pointed to cross-exchange liquidations.
Interestingly, experts were slightly divided on how CEXs contributed to OM’s crash. Forest Bai claimed that CEX liquidations during low-liquidity hours worsened the crash by triggering cascading sell-offs. Eric He corroborated this sentiment.
“CEX liquidations played a major role in the OM crash, acting as an accelerant. With thin liquidity—1% depth falling from $600,000 to $147,000—forced closures triggered cascading liquidations. Over $74.7 million was wiped in 24 hours,” he mentioned.
Yet, Ming Wu called Mullin’s explanation “just an excuse.”
“Analyzing the open interest in the OM derivatives market reveals that it was less than 0.1% of OM’s market capitalization. However, what’s particularly interesting is that during the market collapse, open interest in OM derivatives actually increased by 90%,” Wu expressed to BeInCrypto.
According to the executive, this challenges the idea that liquidations or forced closures caused the price drop. Instead, it indicates that traders and investors increased their short positions as the price fell.
Strategies to Protect Yourself
While the involvement of CEXs remains debatable, the experts did address the key point of investor protection.
“Investors can limit leverage to avoid forced liquidations, choose platforms with transparent risk policies, monitor open interest for liquidation risks, and hold tokens in self-custody wallets to reduce CEX exposure,” Forest Bai recommended.
Eric He also advised that investors should mitigate risks by adjusting leverage dynamically based on volatility. If tools like ATR or Bollinger Bands signal turbulence, exposure should be reduced.
He also recommended avoiding trading during low-liquidity periods, such as midnight UTC, when slippage risks are highest.
The MANTRA (OM) collapse is a powerful reminder of the importance of due diligence and risk management in cryptocurrency investments. Investors can minimize the risk of falling into similar traps by carefully assessing tokenomics, monitoring on-chain data, and diversifying investments.
With expert insights, these strategies will help guide investors toward smarter, more secure decisions in the crypto market.
Disclaimer
In adherence to the Trust Project guidelines, BeInCrypto is committed to unbiased, transparent reporting. This news article aims to provide accurate, timely information. However, readers are advised to verify facts independently and consult with a professional before making any decisions based on this content. Please note that our Terms and Conditions, Privacy Policy, and Disclaimers have been updated.


Crypto whales are making bold moves heading into May 2025, and three tokens are standing out: Ethereum (ETH), Artificial Superintelligence Alliance (FET), and Onyxcoin (XCN). All three have seen a noticeable uptick in large-holder accumulation over the last week, signaling growing interest from big players despite recent volatility.
While ETH and XCN are both coming off sharp corrections, whale buying suggests confidence in a potential rebound. Meanwhile, FET is riding renewed momentum in the AI sector, with whale activity accelerating alongside rising prices.
Ethereum (ETH)
The number of Ethereum crypto whales—wallets holding between 1,000 and 10,000 ETH—has been steadily climbing since April 15. Back then, there were 5,432 such addresses.
That number has now risen to 5,460, the highest count since August 2023. At the same time, the concentration of ETH held by these whales is also hitting new highs, signaling growing accumulation by large holders.
While this can be interpreted as confidence in Ethereum’s long-term value, it also raises concerns about centralization and potential selling pressure if whales decide to take profits.

Ethereum price is currently down more than 19% over the last 30 days. If the correction continues, the price could retest support at $1,535. Losing that level might send ETH toward deeper support at $1,412 or even $1,385.
However, if the trend reverses, key resistance zones lie at $1,669 and $1,749—with a potential push toward $1,954 if bullish momentum builds.
In this context, the growing dominance of whales could act as either a stabilizing force or a looming risk, depending on how they respond to market shifts.
Artificial Superintelligence Alliance (FET)
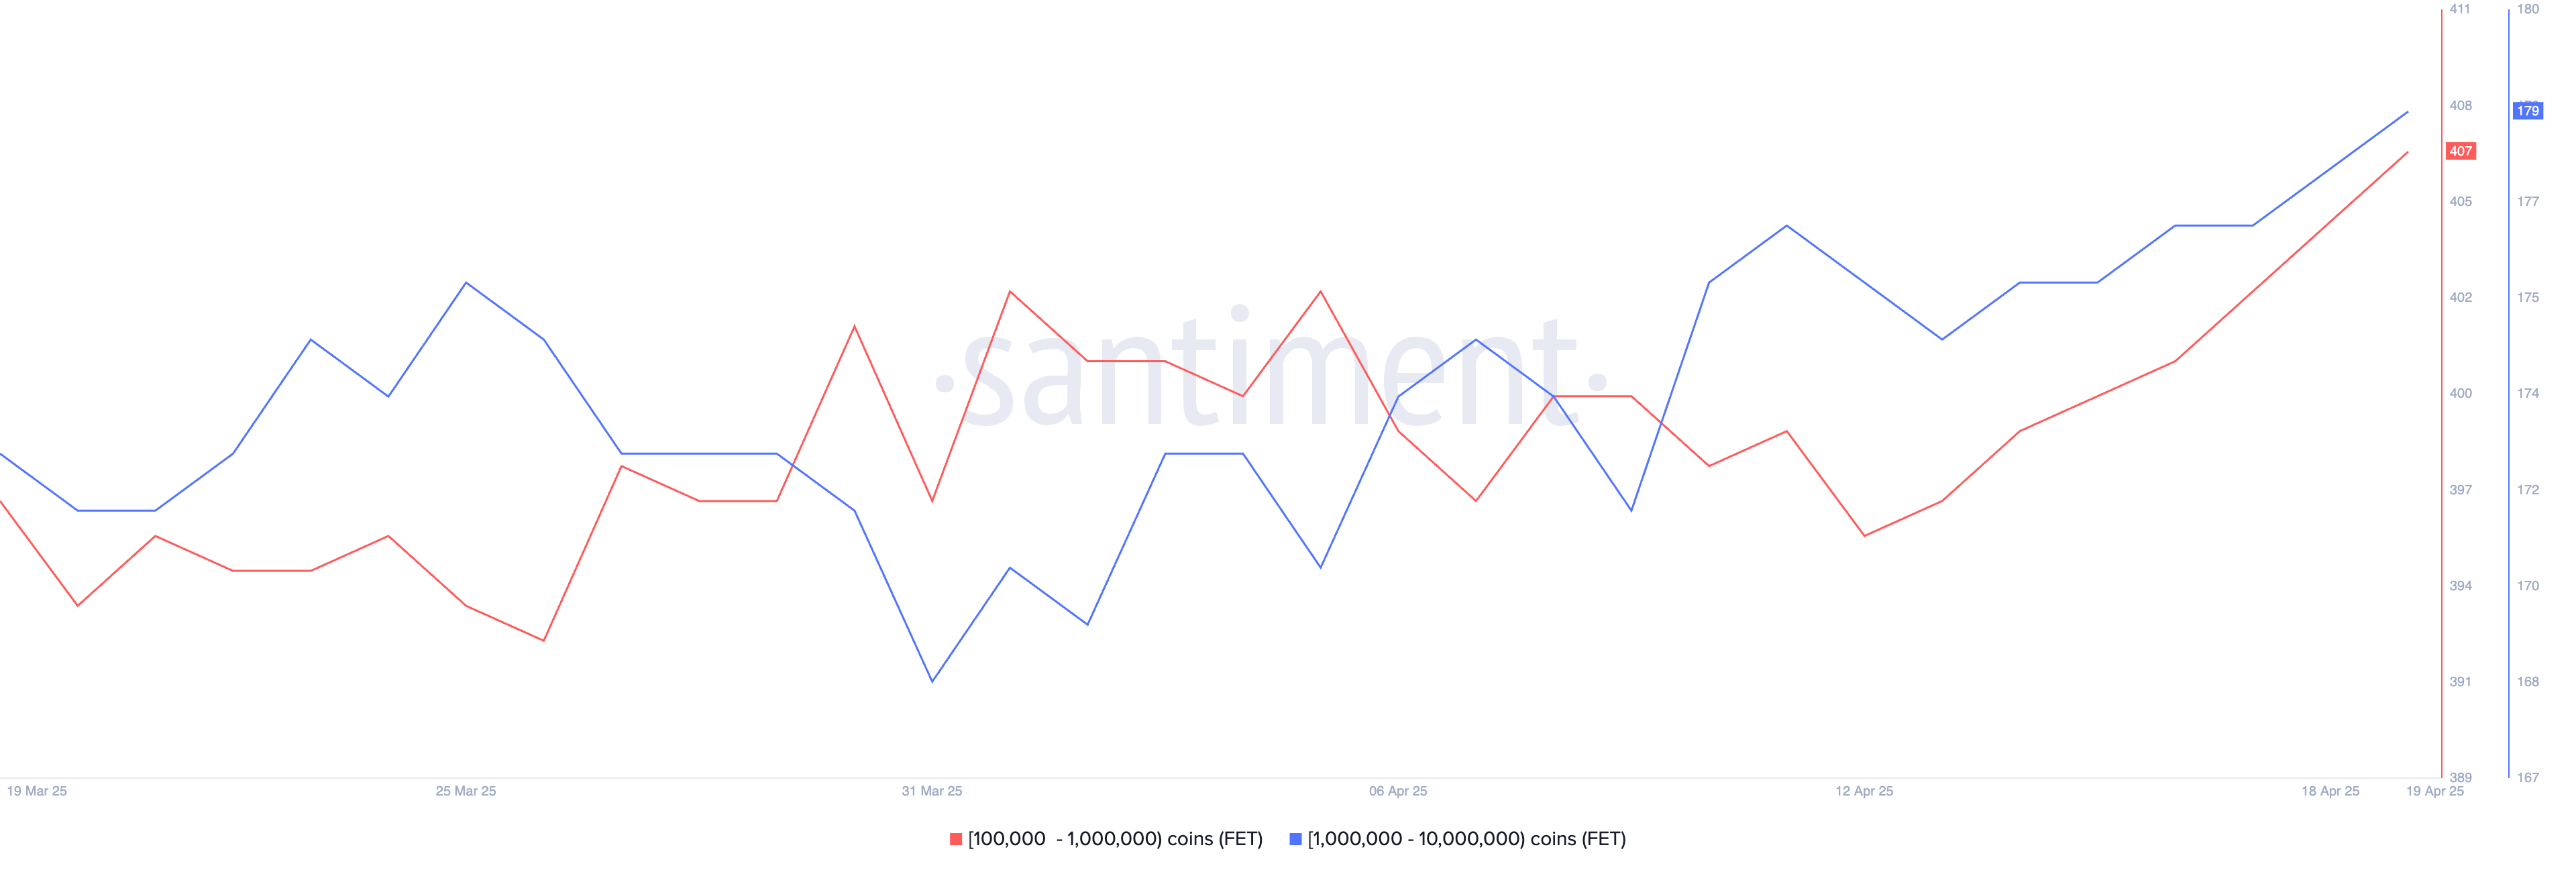
The number of FET whales—wallets holding between 10,000 and 1,000,000 tokens—increased from 572 on April 13 to 586 by April 19.
This steady growth in large holders points to rising confidence among bigger players. It comes at a time when the broader AI crypto narrative is showing signs of a rebound.
Key AI coins like FET, TAO, and RENDER have all increased over 9% in the last seven days, with FET itself gaining more than 8% in the past 24 hours and 13.5% over the week. This suggests a possible comeback for the artificial intelligence narrative in crypto.
If this momentum continues, FET could push toward resistance at $0.659. A clean breakout from that level could open the door to further gains, with $0.77 and $0.82 as the next potential targets.
On the flip side, if the rally stalls, FET might drop back to test support at $0.54. A breakdown below that could send it as low as $0.44.
With whale activity heating up and the AI sector showing renewed strength, FET’s next move could be a key signal for where the narrative heads next.
Onyxcoin (XCN)
Onyxcoin was one of the standout performers in January, but its momentum has faded in recent months. After a strong bounce—up of over 57% in the last 30 days, the token is now correcting, down 19% in the past seven days.
Despite this pullback, accumulation continues. The number of crypto whales holding between 1 million and 10 million XCN has grown from 528 on April 16 to 541, suggesting some large holders may be buying the dip.

If the correction deepens, XCN could lose support at $0.0165. A drop below that may open the door to further declines toward $0.0139 and $0.0123.
But if the trend flips back upward, the token could first test resistance at $0.020. A strong breakout from there might lead to a move toward $0.027. With whale activity on the rise and volatility returning, XCN’s next move could be decisive.
Disclaimer
In line with the Trust Project guidelines, this price analysis article is for informational purposes only and should not be considered financial or investment advice. BeInCrypto is committed to accurate, unbiased reporting, but market conditions are subject to change without notice. Always conduct your own research and consult with a professional before making any financial decisions. Please note that our Terms and Conditions, Privacy Policy, and Disclaimers have been updated.

Bitcoin (BTC) is now one year past its most recent halving, and this cycle is shaping up to be unlike any before it. Unlike previous cycles where explosive rallies followed the halving, BTC has seen a far more muted gain, up just 31%, compared to 436% over the same timeframe in the last cycle.
At the same time, long-term holder metrics like the MVRV ratio are signaling a sharp decline in unrealized profits, pointing to a maturing market with compressing upside. Together, these shifts suggest Bitcoin may be entering a new era, defined less by parabolic peaks and more by gradual, institution-driven growth.
A Year After the Bitcoin Halving: A Cycle Unlike Any Other
This Bitcoin cycle is unfolding noticeably differently than previous ones, signaling a potential shift in how the market responds to halving events.
In earlier cycles—most notably from 2012 to 2016 and again from 2016 to 2020—Bitcoin tended to rally aggressively around this stage. The post-halving period was often marked by strong upward momentum and parabolic price action, largely fueled by retail enthusiasm and speculative demand.
The current cycle, however, has taken a different route. Instead of accelerating after the halving, the price surge began earlier, in October and December 2024, followed by consolidation in January 2025 and a correction in late February.
This front-loaded behavior diverges sharply from historical patterns where halvings typically acted as the catalyst for major rallies.
Several factors are contributing to this shift. Bitcoin is no longer just a retail-driven speculative asset—it’s increasingly seen as a maturing financial instrument. The growing involvement of institutional investors, coupled with macroeconomic pressures and structural changes in the market, has led to a more measured and complex response.
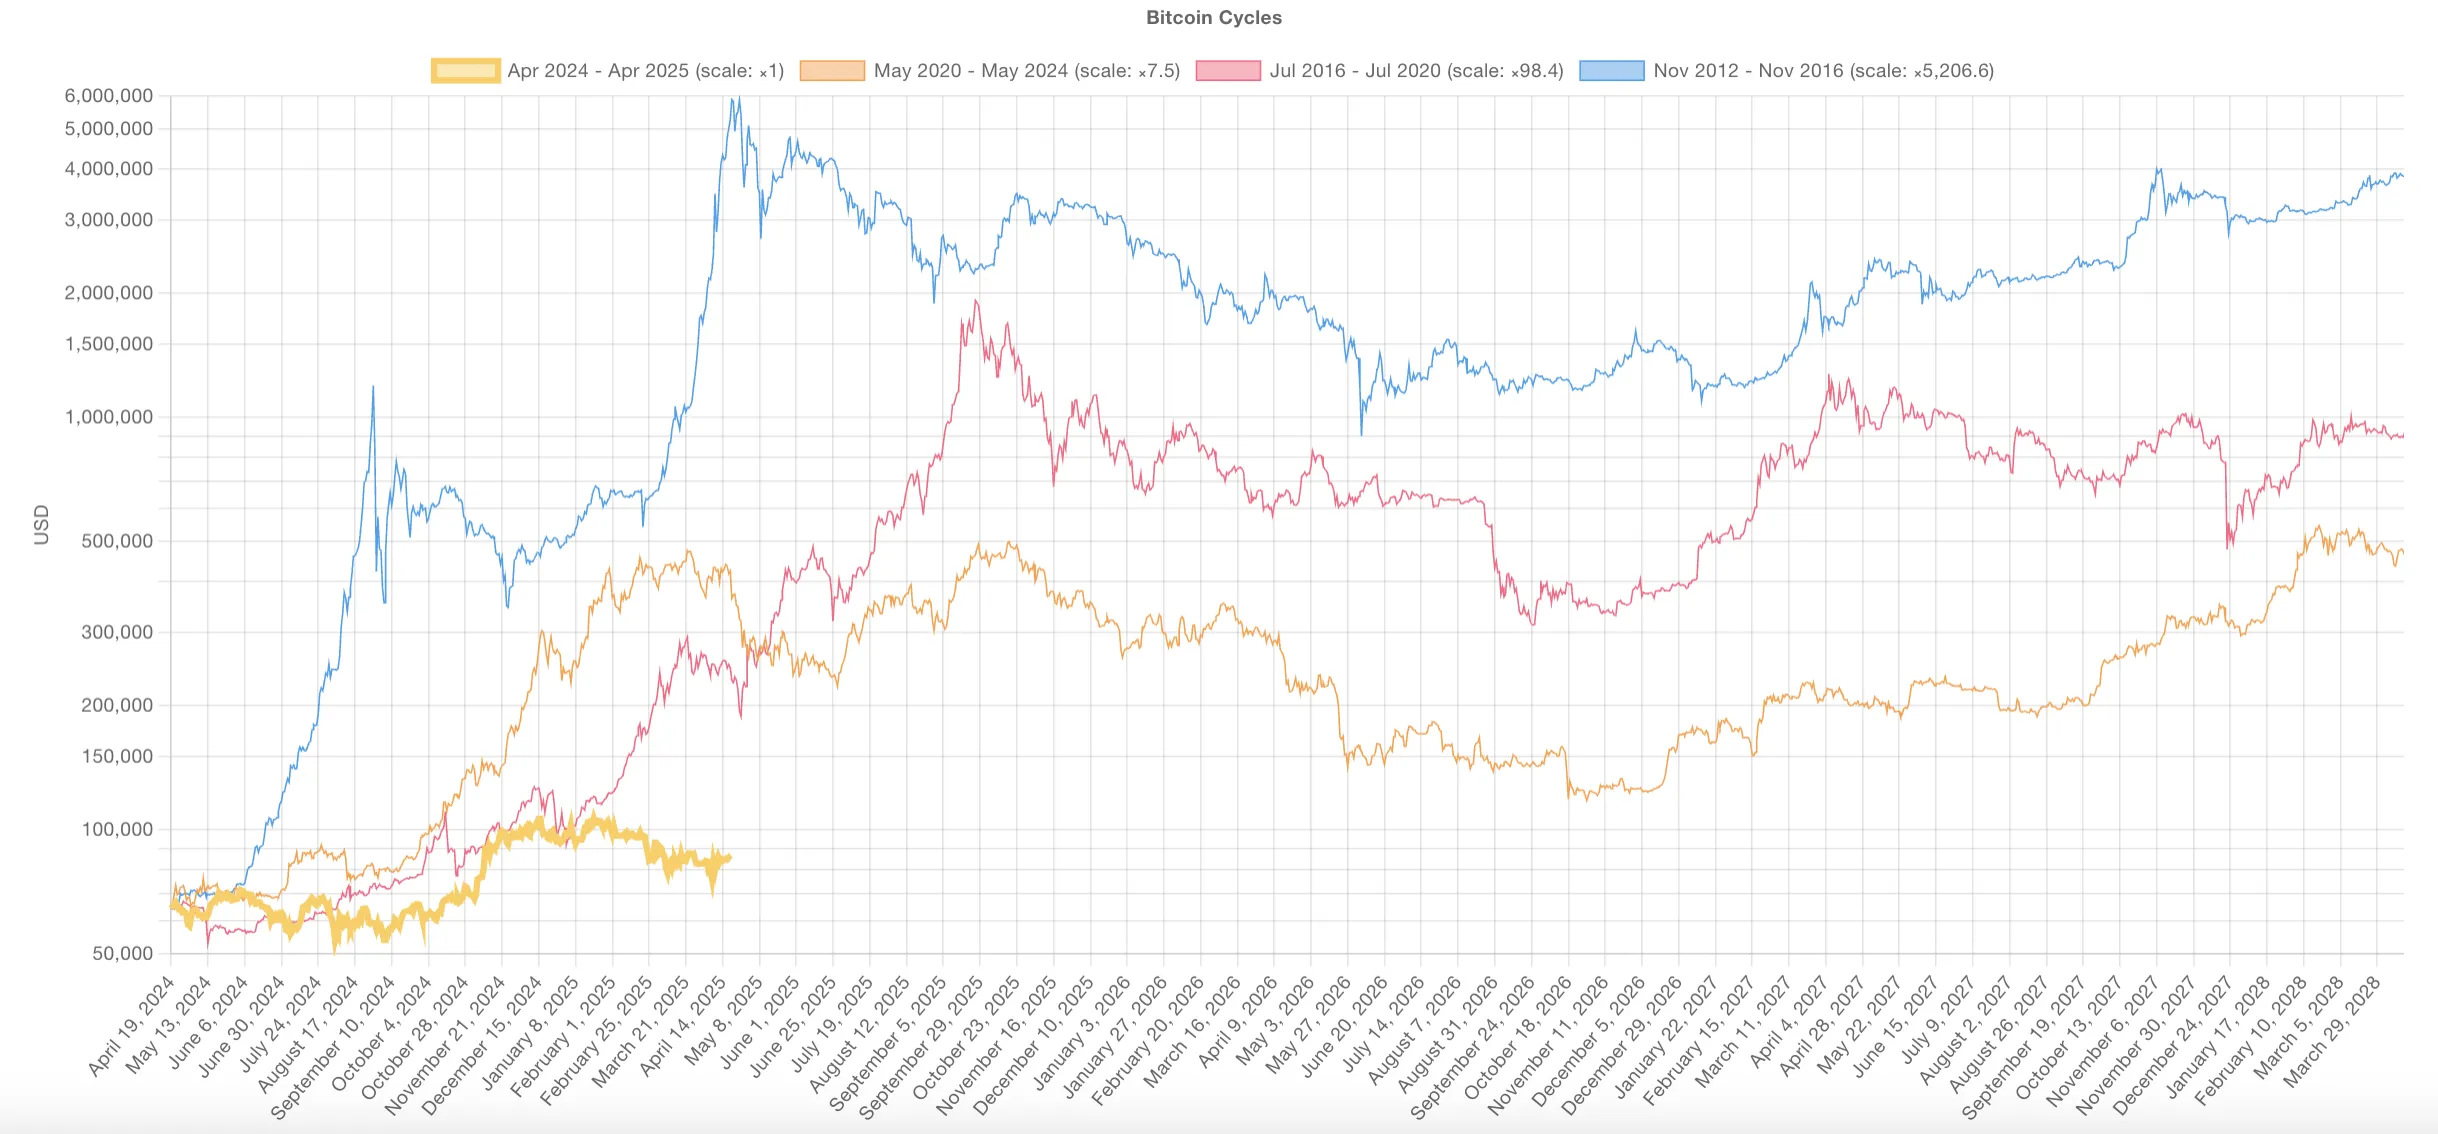
Another clear sign of this evolution is the weakening strength of each successive cycle. The explosive gains of the early years have become harder to replicate as Bitcoin’s market cap has grown. For instance, in the 2020–2024 cycle, Bitcoin had climbed 436% one year after the halving.
In contrast, this cycle has seen a much more modest 31% increase over the same timeframe.
This shift could mean Bitcoin is entering a new chapter. One with less wild volatility and more steady, long-term growth. The halving may no longer be the main driver. Other forces are taking over—rates, liquidity, and institutional money.
The game is changing. And so is the way Bitcoin moves.
Nonetheless, it’s important to note that previous cycles also featured periods of consolidation and correction before resuming their uptrend. While this phase may feel slower or less exciting, it could still represent a healthy reset before the next move higher.
That said, the possibility remains that this cycle will continue to diverge from historical patterns. Instead of a dramatic blow-off top, the outcome may be a more prolonged and structurally supported uptrend—less driven by hype, more by fundamentals.
What Long-Term Holder MVRV Reveals About Bitcoin’s Maturing Market
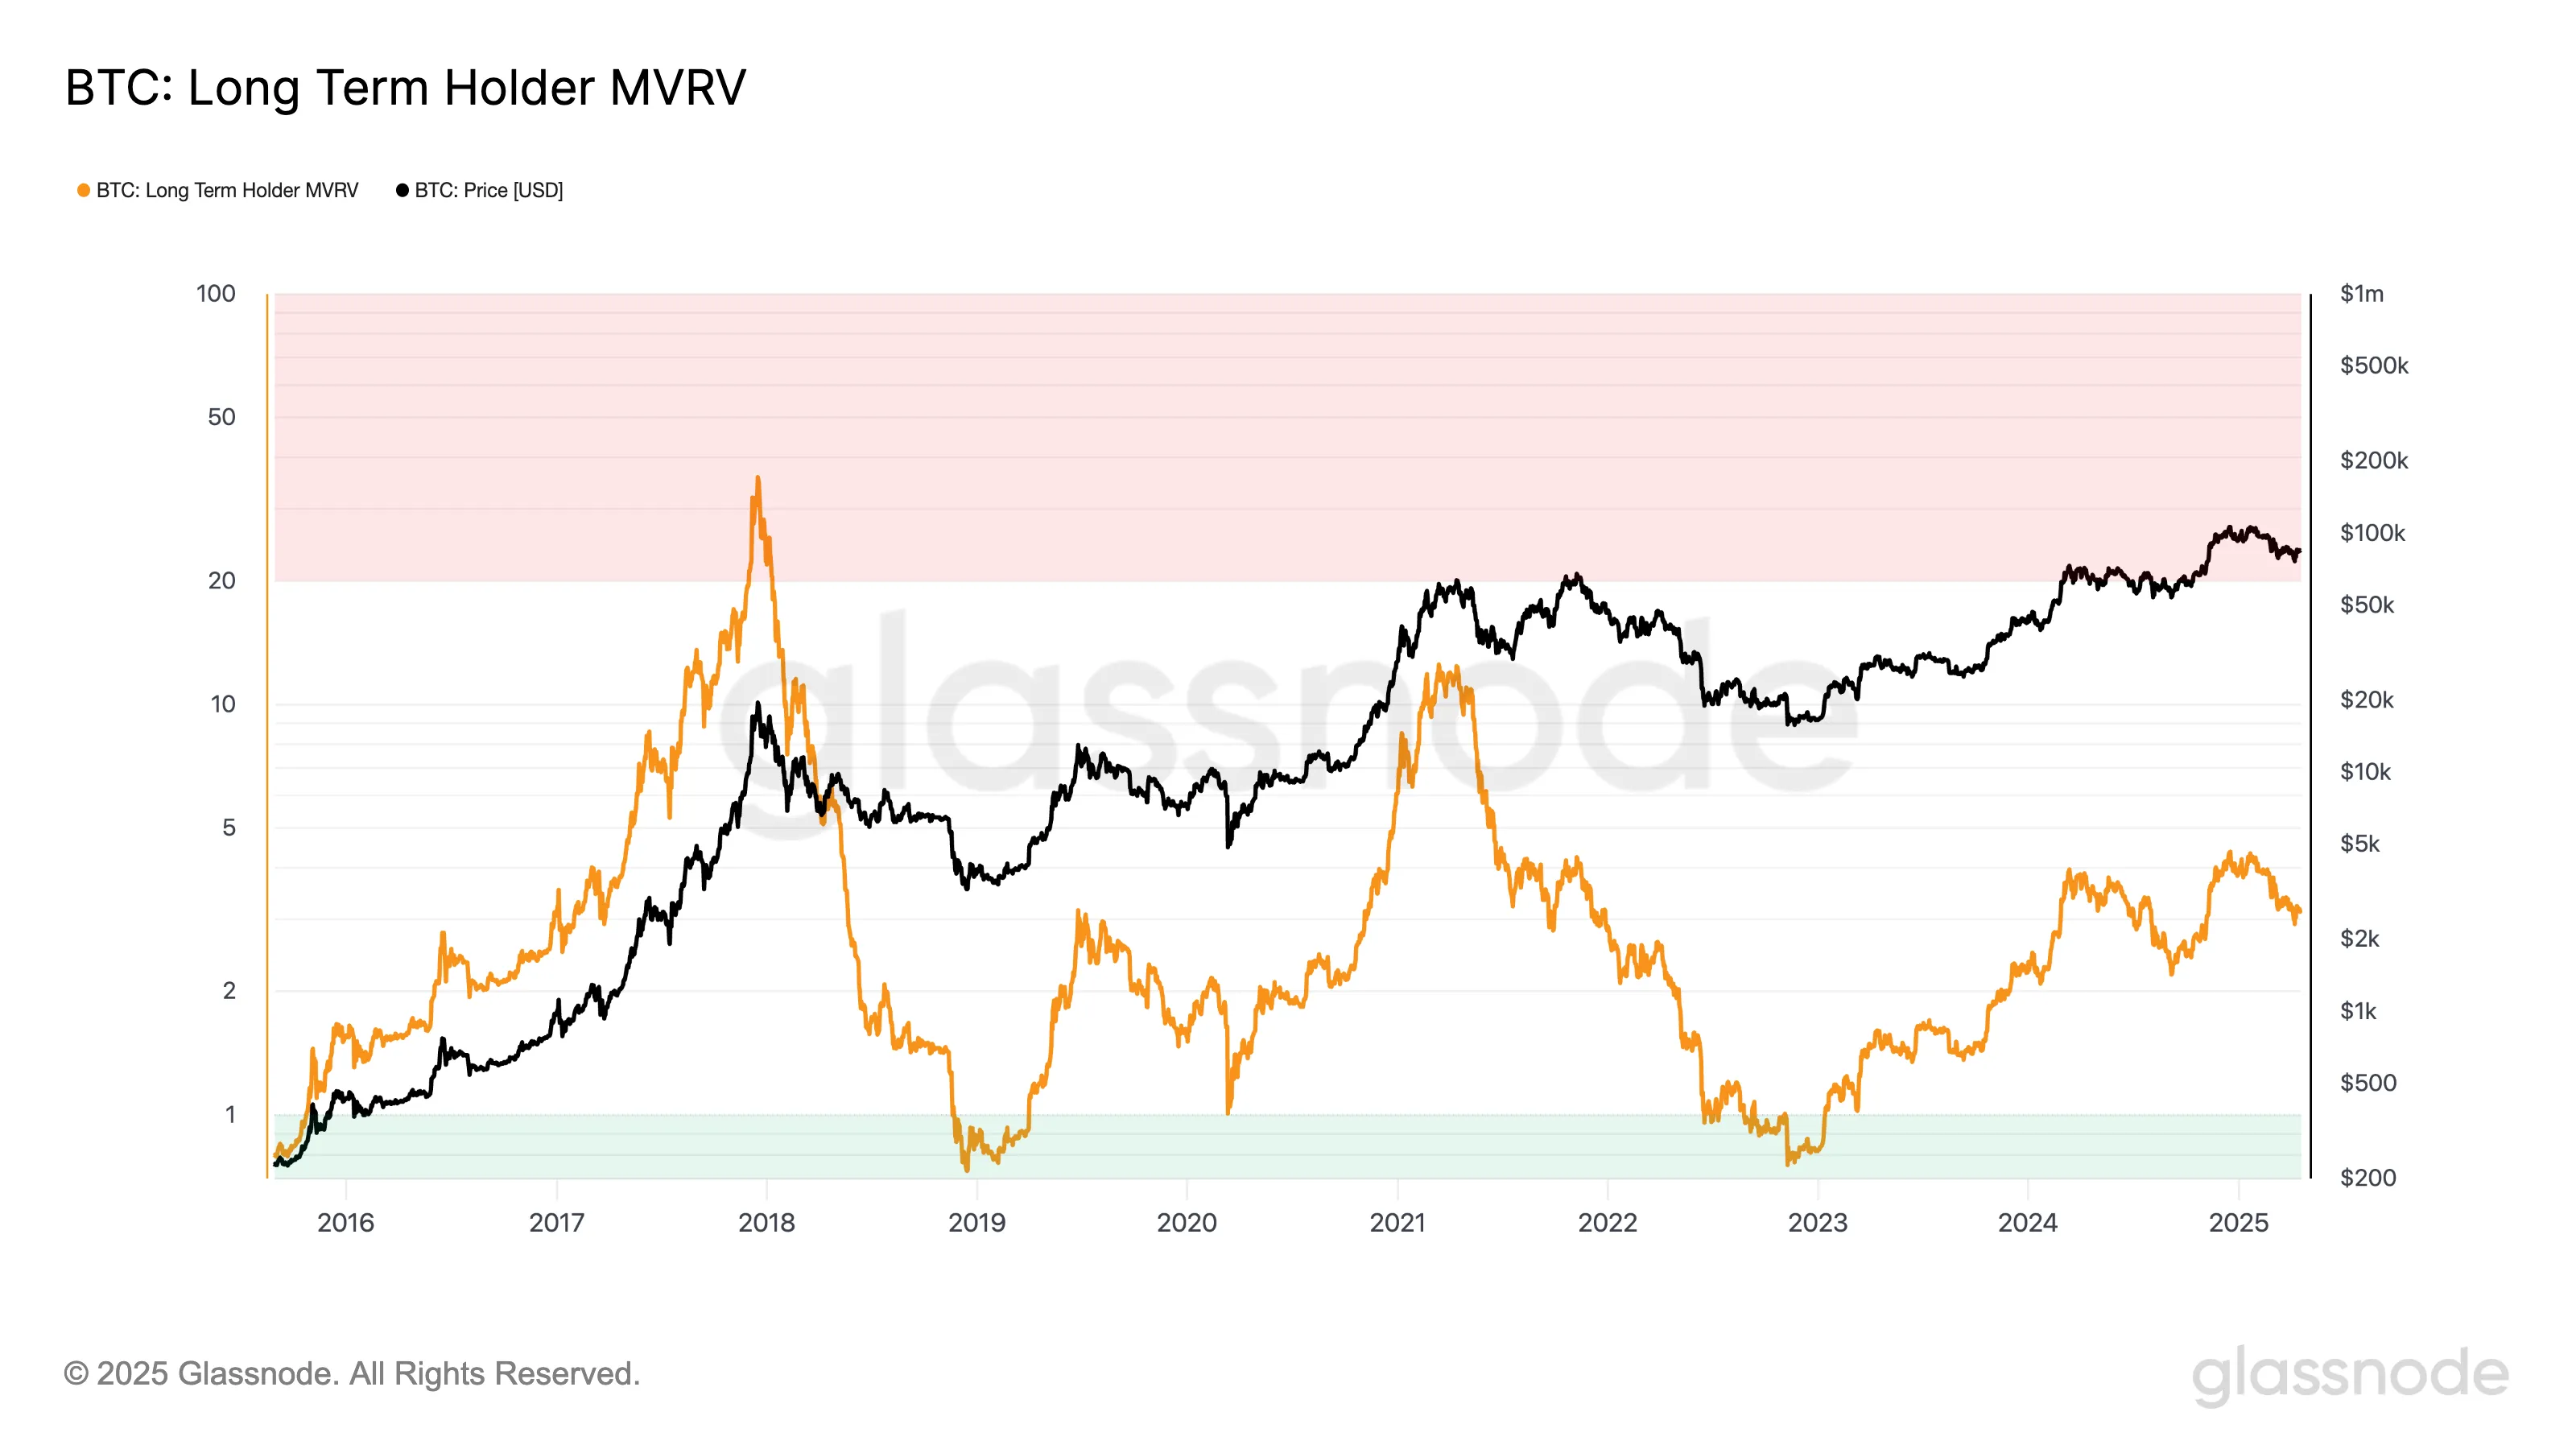
The Long-Term Holder (LTH) MVRV ratio has always been a solid measure of unrealized profits. It shows how much long-term investors are sitting on before they start selling. But over time, this number is falling.
In the 2016–2020 cycle, LTH MVRV peaked at 35.8. That signaled massive paper profits and a clear top forming. By the 2020–2024 cycle, the peak dropped sharply to 12.2. This happened even as Bitcoin price hit fresh all-time highs.
In the current cycle, the highest LTH MVRV so far is just 4.35. That’s a massive drop. It shows long-term holders aren’t seeing the same kind of gains. The trend is clear: each cycle delivers smaller multiples.
Bitcoin’s explosive upside is compressing. The market is maturing.
Now, in the current cycle, the highest LTH MVRV reading so far has been 4.35. This stark drop suggests long-term holders are experiencing much lower multiples on their holdings compared to previous cycles, even with substantial price appreciation. The pattern points to one conclusion: Bitcoin’s upside is compressing.
This isn’t just a fluke. As the market matures, explosive gains are naturally harder to come by. The days of extreme, cycle-driven profit multiples may be fading, replaced by more moderate—but potentially more stable—growth.
A growing market cap means it takes exponentially more capital to move the price significantly.
Still, it’s not definitive proof that this cycle has already topped out. Previous cycles often included extended periods of sideways movement or modest pullbacks before new highs were reached.
With institutions playing a larger role, accumulation phases could stretch longer. Therefore, peak profit-taking may be less abrupt than in earlier cycles.
However, if the trend of declining MVRV peaks continues, it could reinforce the idea that Bitcoin is transitioning away from wild, cyclical surges and toward a more subdued but structured growth pattern.
The sharpest gains may already be behind, especially for those entering late in the cycle.
Disclaimer
In line with the Trust Project guidelines, this price analysis article is for informational purposes only and should not be considered financial or investment advice. BeInCrypto is committed to accurate, unbiased reporting, but market conditions are subject to change without notice. Always conduct your own research and consult with a professional before making any financial decisions. Please note that our Terms and Conditions, Privacy Policy, and Disclaimers have been updated.

Voxies (VOXEL), a little-known gaming token, surged by over 200% within 24 hours on April 20 following a suspected malfunction in Bitget’s trading system.
The unexpected glitch led to an explosive spike in activity, pushing the VOXEL/USDT contract’s trading volume to an eye-watering $12.7 billion. According to Coingecko data, this significantly outpaces Bitcoin’s $4.76 billion volume on the same platform.
Bitget Trading Error Reportedly Lets Users Earn Six-Figure Profits
The unprecedented spike drew attention across the crypto space, particularly given that VOXEL is a relatively obscure free-to-play blockchain game token with a market cap under $30 million.
According to on-chain analyst Dylan, the Bitget bot repeatedly executed trades within the narrow $0.125 to $0.138 price range. Savvy traders quickly caught on, using just $100 to scalp profits exceeding six figures.
Reports suggest that the glitch allowed some users to walk away with tens or even hundreds of thousands of USDT in a matter of hours.
In response, Bitget’s spokesperson Xie Jiayin confirmed the platform was aware of the irregular activity and has launched an internal investigation. The company also noted that affected accounts may face temporary restrictions, urging users to contact in-app support for further assistance.
“Every platform, at every stage of development, may encounter challenges and uncertainties, yet these are an inevitable part of the journey. Bitget will provide the event details and resolution within 24 hours,” Jiayin added.
Meanwhile, the incident has sparked criticism from market experts and traders, many of whom question Bitget’s internal safeguards and technical maturity.
Several community members have criticized Bitget’s response to the issue. Some have claimed that the exchange’s decision to forcibly settle VOXEL contracts at discounted rates breached user trust. Bitget’s hybrid custody model is also receiving backlash following the incident.
“The platform’s product design reveals concerning flaws: a hybrid custody risk pool exposes users to systemic risks, and unrestricted position sizes open the door to manipulation. If these issues are not addressed, more altcoins could be weaponized against Bitget—potentially making it the next catastrophic failure in the crypto space,” one analyst stated.
Meanwhile, the timing of the incident is also notable. VOXEL is currently listed on Binance’s “Vote to Delist” program. The campaign aims to improve transparency and give the community a voice in token listings.
Overall, the Bitget incident has amplified concerns about potential market manipulation involving the token and highlighted the broader risks tied to centralized exchanges.
Disclaimer
In adherence to the Trust Project guidelines, BeInCrypto is committed to unbiased, transparent reporting. This news article aims to provide accurate, timely information. However, readers are advised to verify facts independently and consult with a professional before making any decisions based on this content. Please note that our Terms and Conditions, Privacy Policy, and Disclaimers have been updated.

Tokens Big Players Are Buying
1 Year After Bitcoin Halving: What’s Different This Time?

VOXEL Climbs 200% After Suspected Bitget Bot Glitch

Binance Traders Go Big On Dogecoin—Majority Holding Long Positions

How Token Launch Frenzy Is Delaying 2025 Altcoin Season

XRP Leads Crypto Shopping List For Latin America Ahead Of ETH, SOL—Report

2.52 Million Altcoins Are Ruining Crypto’s Future

Animoca Brands Valuation Tanks 75% In Two Years, Here’s Why

Crypto exchange BingX hacked for $43 million

Are The Big Players Losing Interest?

Hong Kong’s Securities Association Tips Authorities On Crypto Self-Regulation

Coinbase cbBTC Set to go Live on Solana
2.52 Million Altcoins Are Ruining Crypto’s Future
Animoca Brands Valuation Tanks 75% In Two Years, Here’s Why
Crypto exchange BingX hacked for $43 million
Are The Big Players Losing Interest?
Hong Kong’s Securities Association Tips Authorities On Crypto Self-Regulation
Coinbase cbBTC Set to go Live on Solana
-

 Altcoin20 hours ago
Cardano Bulls Secure Most Important Signal To Drive Price Rally
-
 Altcoin18 hours ago
Ripple Expands In Asia With Debut XRP Investment Tool
-

 Bitcoin15 hours ago
Analyst Says Bitcoin Price Might Be Gearing Up For Next Big Move — What To Know
-

 Bitcoin23 hours ago
Swiss Supermarket Chain Welcomes Crypto Payments
-
 Altcoin15 hours ago
Expert Reveals Why Consensus 2025 Will Be Pivotal For Pi Network
-
 Altcoin12 hours ago
Uniswap Founder Urges Ethereum To Pursue Layer 2 Scaling To Compete With Solana
-

 Market21 hours ago
SUI Ranks 5th in DEX Volume, But Rally Lacks Strength
-

 Regulation22 hours ago
John Deaton Lays Out 5 To-Do List