
Market
5 Artificial Intelligence (AI) Altcoins to Watch in June 2024
The world of artificial intelligence (AI) is rapidly evolving, and the integration of blockchain technology is fueling a new wave of innovation known as AI tokens.
These tokens power various projects aiming to revolutionize how AI is developed, accessed, and utilized.
Exploring AI Tokens: Technical Outlook for Bittensor, The Graph, and More
This analysis dives into the exciting world of AI tokens, exploring some of the leading players like Bittensor (TAO), The Graph (GRT), SingularityNET (AGIX), Ocean Protocol (Ocean), and Fetch.ai (FET).
We’ll analyze their technical outlook using the Ichimoku Cloud indicator to see if these projects’ current hype translates to potential buying opportunities.
Bittensor (TAO)
Bittensor aims to create a decentralized network for machine learning. It is a peer-to-peer network where users can create, train, share, and trade machine learning models, fostering a collaborative AI environment.
Bittensor aspires to form a collective intelligence like a global brain by connecting various models globally. Utilizing blockchain technology built on the Substrate framework, Bittensor ensures a secure, transparent, and censorship-resistant platform.
Technical Outlook
TAO experienced a sharp correction, which still continues. The drop below $410 is a bearish signal since the $410 line represents a flat Ichimoku baseline plateau.
Read more: Top 9 Artificial Intelligence (AI) Cryptocurrencies in 2024
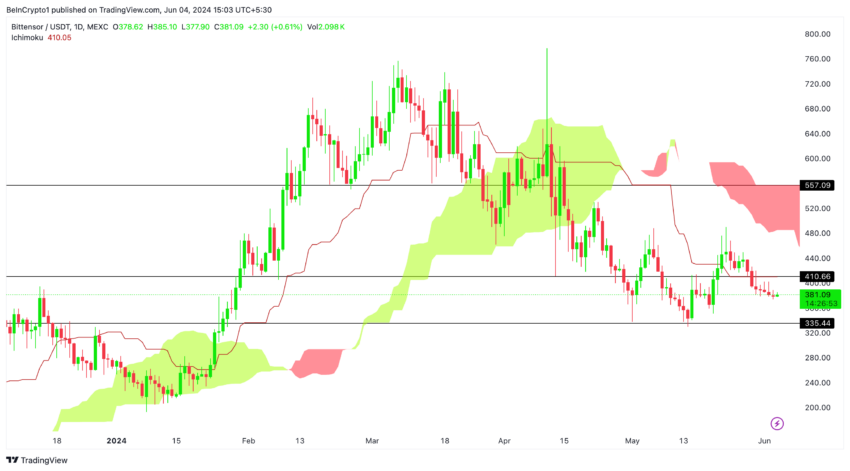
This could lead the price to continue the downtrend to $335. Buying TAO at these price levels is interesting. A break above $410 could lead TAO to reach the Ichimoku cloud, which is located between $480 and $550.
The Graph (GRT)
The Graph makes blockchain data accessible by acting as an intermediary, allowing AI developers to easily search for, find, and retrieve relevant data from blockchains. This data is essential for training AI models across various fields, such as financial analysis, supply chain management, and creative applications.
Technical Outlook
GRT is down 40% from its local high of $0.49. The price currently trades inside the daily Ichimoku cloud, which ranges between $0.26 and $0.34, an important zone to watch.
Breaking above $0.34 could lead to the price appreciating and reaching the important resistance zone at $0.36, which has proven to be a significant price line for GRT.
Read More: The Graph (GRT) Price Prediction 2024/2025/2030
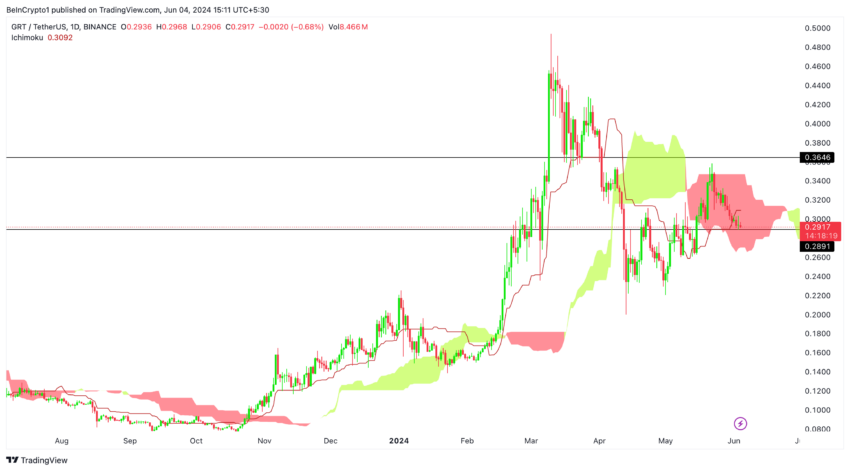
Buying GRT at these levels or lower could be advantageous. A break below the Ichimoku cloud could incentivize a further ongoing correction. Monitoring the cloud could be a good strategy to determine where to buy GRT.
SingularityNET (AGIX)
SingularityNET is a blockchain-based AI marketplace. It allows developers to create and share AI services, monetize their expertise by earning AGIX tokens, and users to find and use specific AI solutions.
Technical Outlook
AGIX is currently trading at the lower boundary of the daily Ichimoku cloud, indicating potential price indecision. If the price drops below the Ichimoku cloud, it could signal bearish momentum and push the price down to $0.84. Should the price break below the $0.84 support level, it could further decline to $0.65.
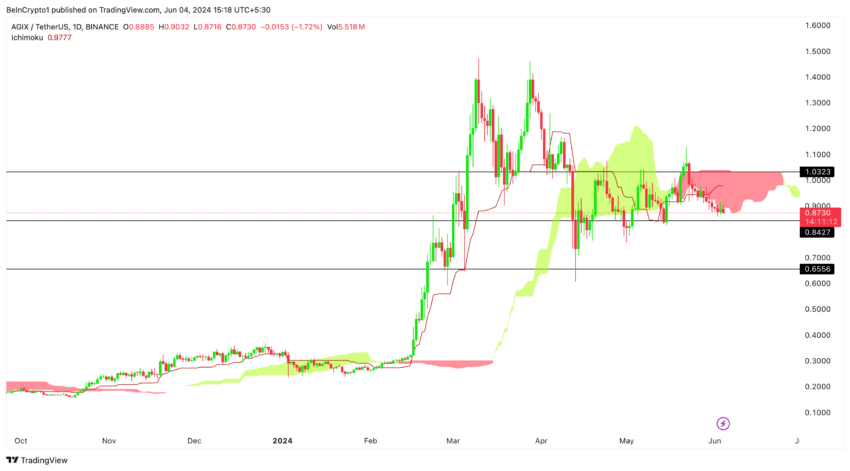
Buying AGIX between $0.84 and $0.65 might be a good investment entry point. Conversely, if the price moves above the cloud, this could indicate a trend reversal and an increase in price to the $1 resistance level, which marks the upper boundary of the cloud.
A breakout above this level could signal a bull run, driving AGIX to a local high of $1.46.
Ocean Protocol (OCEAN)
Ocean Protocol creates a secure and open marketplace for data sharing and monetization. It facilitates transactions using blockchain technology, allowing data owners to create tokens (DATs) representing access rights to their data. This enables controlled sharing and pricing while enhancing privacy and security.
Technical Outlook
Ocean’s price took a hit during a recent Bitcoin correction. When Bitcoin fell from $73,000 to $56,000, Ocean dropped from $1.60 to $0.62, representing a significant decrease of 62%. Currently, Ocean is trading at $0.88, right at the bottom of the daily Ichimoku Cloud.
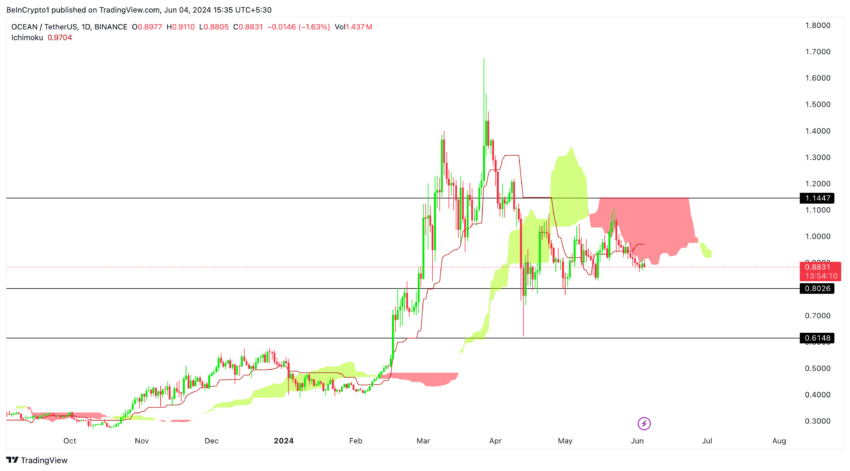
A break below the Ichimoku Cloud could trigger significant selling pressure, pushing the price down to the key support level of $0.80. If that level breaks, Ocean could fall further to its previous low of $0.62.
However, considering Bitcoin’s recent performance, buying Ocean at these levels could be an attractive option for long-term investors.
Fetch.ai (FET)
Fetch.ai combines AI and blockchain to create an autonomous agent economy. It envisions a future where software agents represent individuals, organizations, and devices interacting on a decentralized network.
Fetch.ai provides developers with tools to build agents with specific capabilities, ensuring secure and transparent interactions within its ecosystem. The native token, FET, is used for transactions within the network, including agent communication and data access.
Technical Outlook
Fetch.ai’s (FET) price is currently testing a crucial support level, attempting to break below the Ichimoku Cloud on the daily chart. If this downward trend continues and FET fails to revisit the cloud’s lower boundary, a further price decline to $1.8 is possible.
This $1.8 level acts as significant support and a break beneath it could trigger a steeper drop to $1.5.
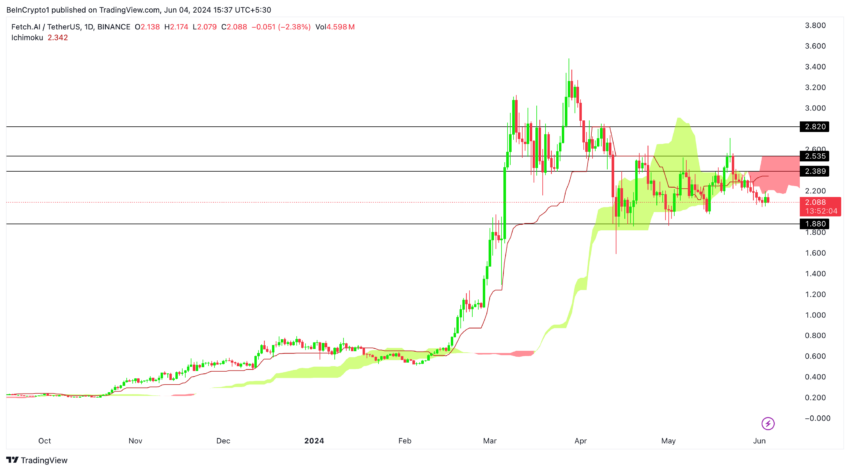
However, this price range between $1.5 and $2 for long-term investors could present a good buying opportunity. Despite the volatility inherent to FET, a potential upside exists if Bitcoin manages to break its all-time high of $73,800, which could lead to a swift recovery in FET’s price.
Conclusion: Long-Term Potential and the Bitcoin Factor
The AI token market presents a fascinating opportunity for investors with a long-term perspective. These projects are at the forefront of a technological revolution that could reshape various industries. While short-term volatility is to be expected, successful AI projects have the potential to generate significant returns for investors who believe in their long-term vision.
Here’s where Bitcoin comes in. The cryptocurrency market often exhibits a domino effect, with Bitcoin’s price movements influencing the prices of altcoins, including AI tokens.
Read More: 4 Biggest Crypto Predictions for June 2024
A potential surge in Bitcoin’s price, especially towards the often-discussed $100,000 mark and beyond during a bull market, could catalyze significant gains in the AI token space.
Disclaimer
In line with the Trust Project guidelines, this price analysis article is for informational purposes only and should not be considered financial or investment advice. BeInCrypto is committed to accurate, unbiased reporting, but market conditions are subject to change without notice. Always conduct your own research and consult with a professional before making any financial decisions. Please note that our Terms and Conditions, Privacy Policy, and Disclaimers have been updated.


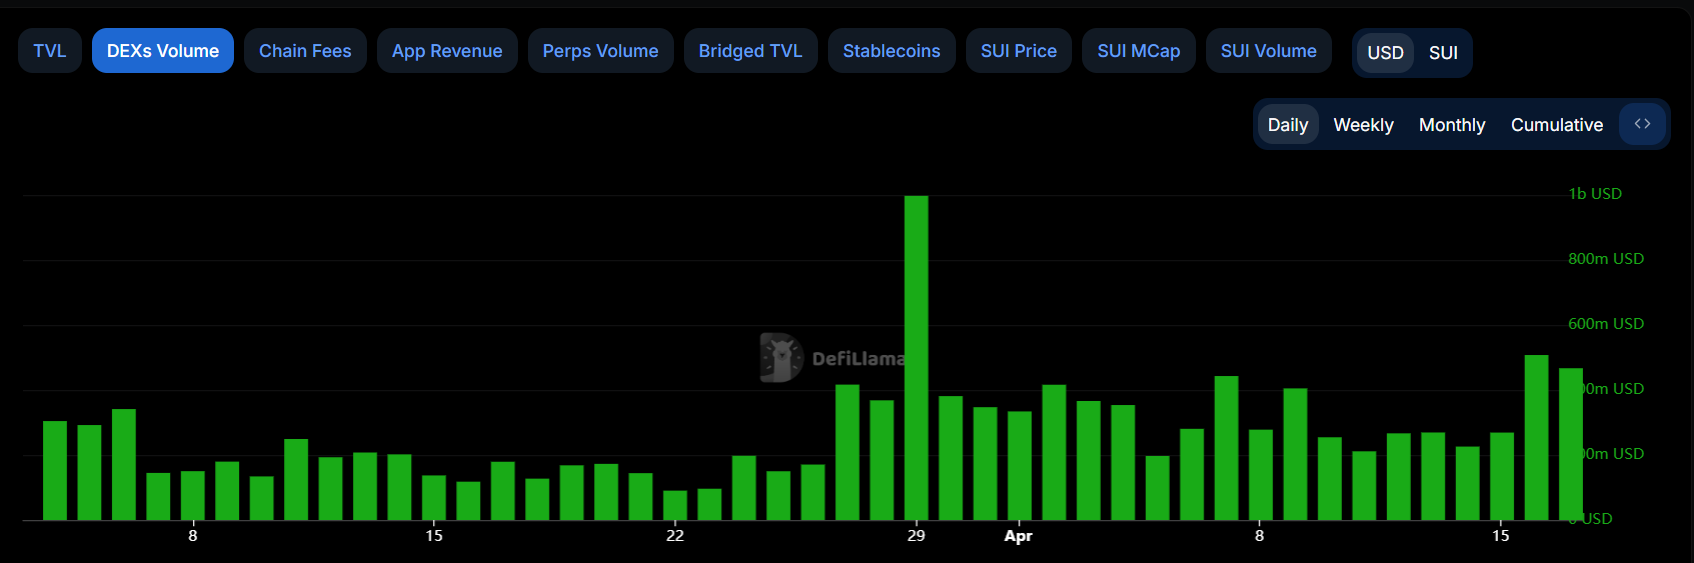
Sui meme coins, not typically seen at the forefront of the sector, are surging in volume recently. Their market cap is far smaller than Solana meme coins, but it’s also growing fast.
LOFI, a meme coin deployed on the blockchain, surged by over 186% in a week. If fresh DEX trading volumes start flowing into these assets, Sui could be the next emerging ecosystem for meme coins.
Are Sui Meme Coins About to Explode?
Meme coins based on Solana have been getting a lot of attention lately, with surging trade volumes and token prices. This has fueled speculation that Solana’s poised to lead a new meme coin boom, especially as the sector is exposed to new risks.
However, Sui meme coins are gaining some unexpected traction, and DEX volumes are noticeably soaring.
Sui is a high-performance Layer-1 blockchain that shares many similarities with Solana but several key differences.
Its design focuses on scalability, using parallel transaction processing and an object-centric transaction model to achieve this aim. Sui’s ecosystem is much less mature than Solana’s, but this could present opportunities for meme coins.
Sui’s developers are constantly working on upgrades to encourage new projects, some of which are explicitly geared towards meme coins. Solana’s 6.3 billion meme coin market cap grew by 2.4% in the previous 24 hours, while Sui’s increased by 4.6%.
LOFI grew 184.5% in the last week, highlighting its dedicated community.
LOFI’s impressive rise stands out, but several other projects on the layer-1 network have also attracted speculative interest. Meme coins thrive on community hype, and the blockchain’s DEX volumes are soaring.
If this high performance and committed enthusiasm connect with fresh investors, it could present an explosive opportunity.
For now, Sui’s meme coin ecosystem has a ways to go, with a total market cap of $123 million. However, this sector moves fast, and the Sui ecosystem could be poised to make some major growth soon, if meme coin enthusiasts continue to trade.
Disclaimer
In adherence to the Trust Project guidelines, BeInCrypto is committed to unbiased, transparent reporting. This news article aims to provide accurate, timely information. However, readers are advised to verify facts independently and consult with a professional before making any decisions based on this content. Please note that our Terms and Conditions, Privacy Policy, and Disclaimers have been updated.
AI coins continue to draw attention as April nears its end, with Render (RENDER), Story Protocol (IP), and CLANKER standing out. RENDER has led the pack, surging nearly 17% this week and reclaiming a $2 billion market cap.
In contrast, Story (IP) is down 6.5%, the worst performer among the top 10 AI tokens, while CLANKER dropped over 7% in the last 24 hours. With momentum shifting across the sector, all three tokens are positioned at key technical levels that could define their next move.
RENDER
Render Network provides decentralized GPU computing power for creators, developers, and artificial intelligence applications. Its infrastructure supports rendering for 3D graphics, visual effects, and artificial intelligence model training.

RENDER, the network’s native token, has surged nearly 17% over the past week, pushing its market cap back above $2 billion. It was the top performer among the ten largest AI coins in the market.
If the bullish momentum holds, RENDER could test resistance levels at $4.065 and $4.21, and a breakout could open the path to $4.63.
However, if the trend reverses, key support lies at $3.82 and $3.68—losing these could trigger a deeper decline toward $3.47 or even $3.14 in a stronger correction.
Story (IP)
Story Protocol is a decentralized infrastructure designed to manage and monetize intellectual property (IP) on-chain, with a strong focus on artificial intelligence.
It allows creators to register stories, characters, and other digital assets, enabling collaborative development, licensing, and programmable royalties—all while integrating AI into the creation and distribution process.
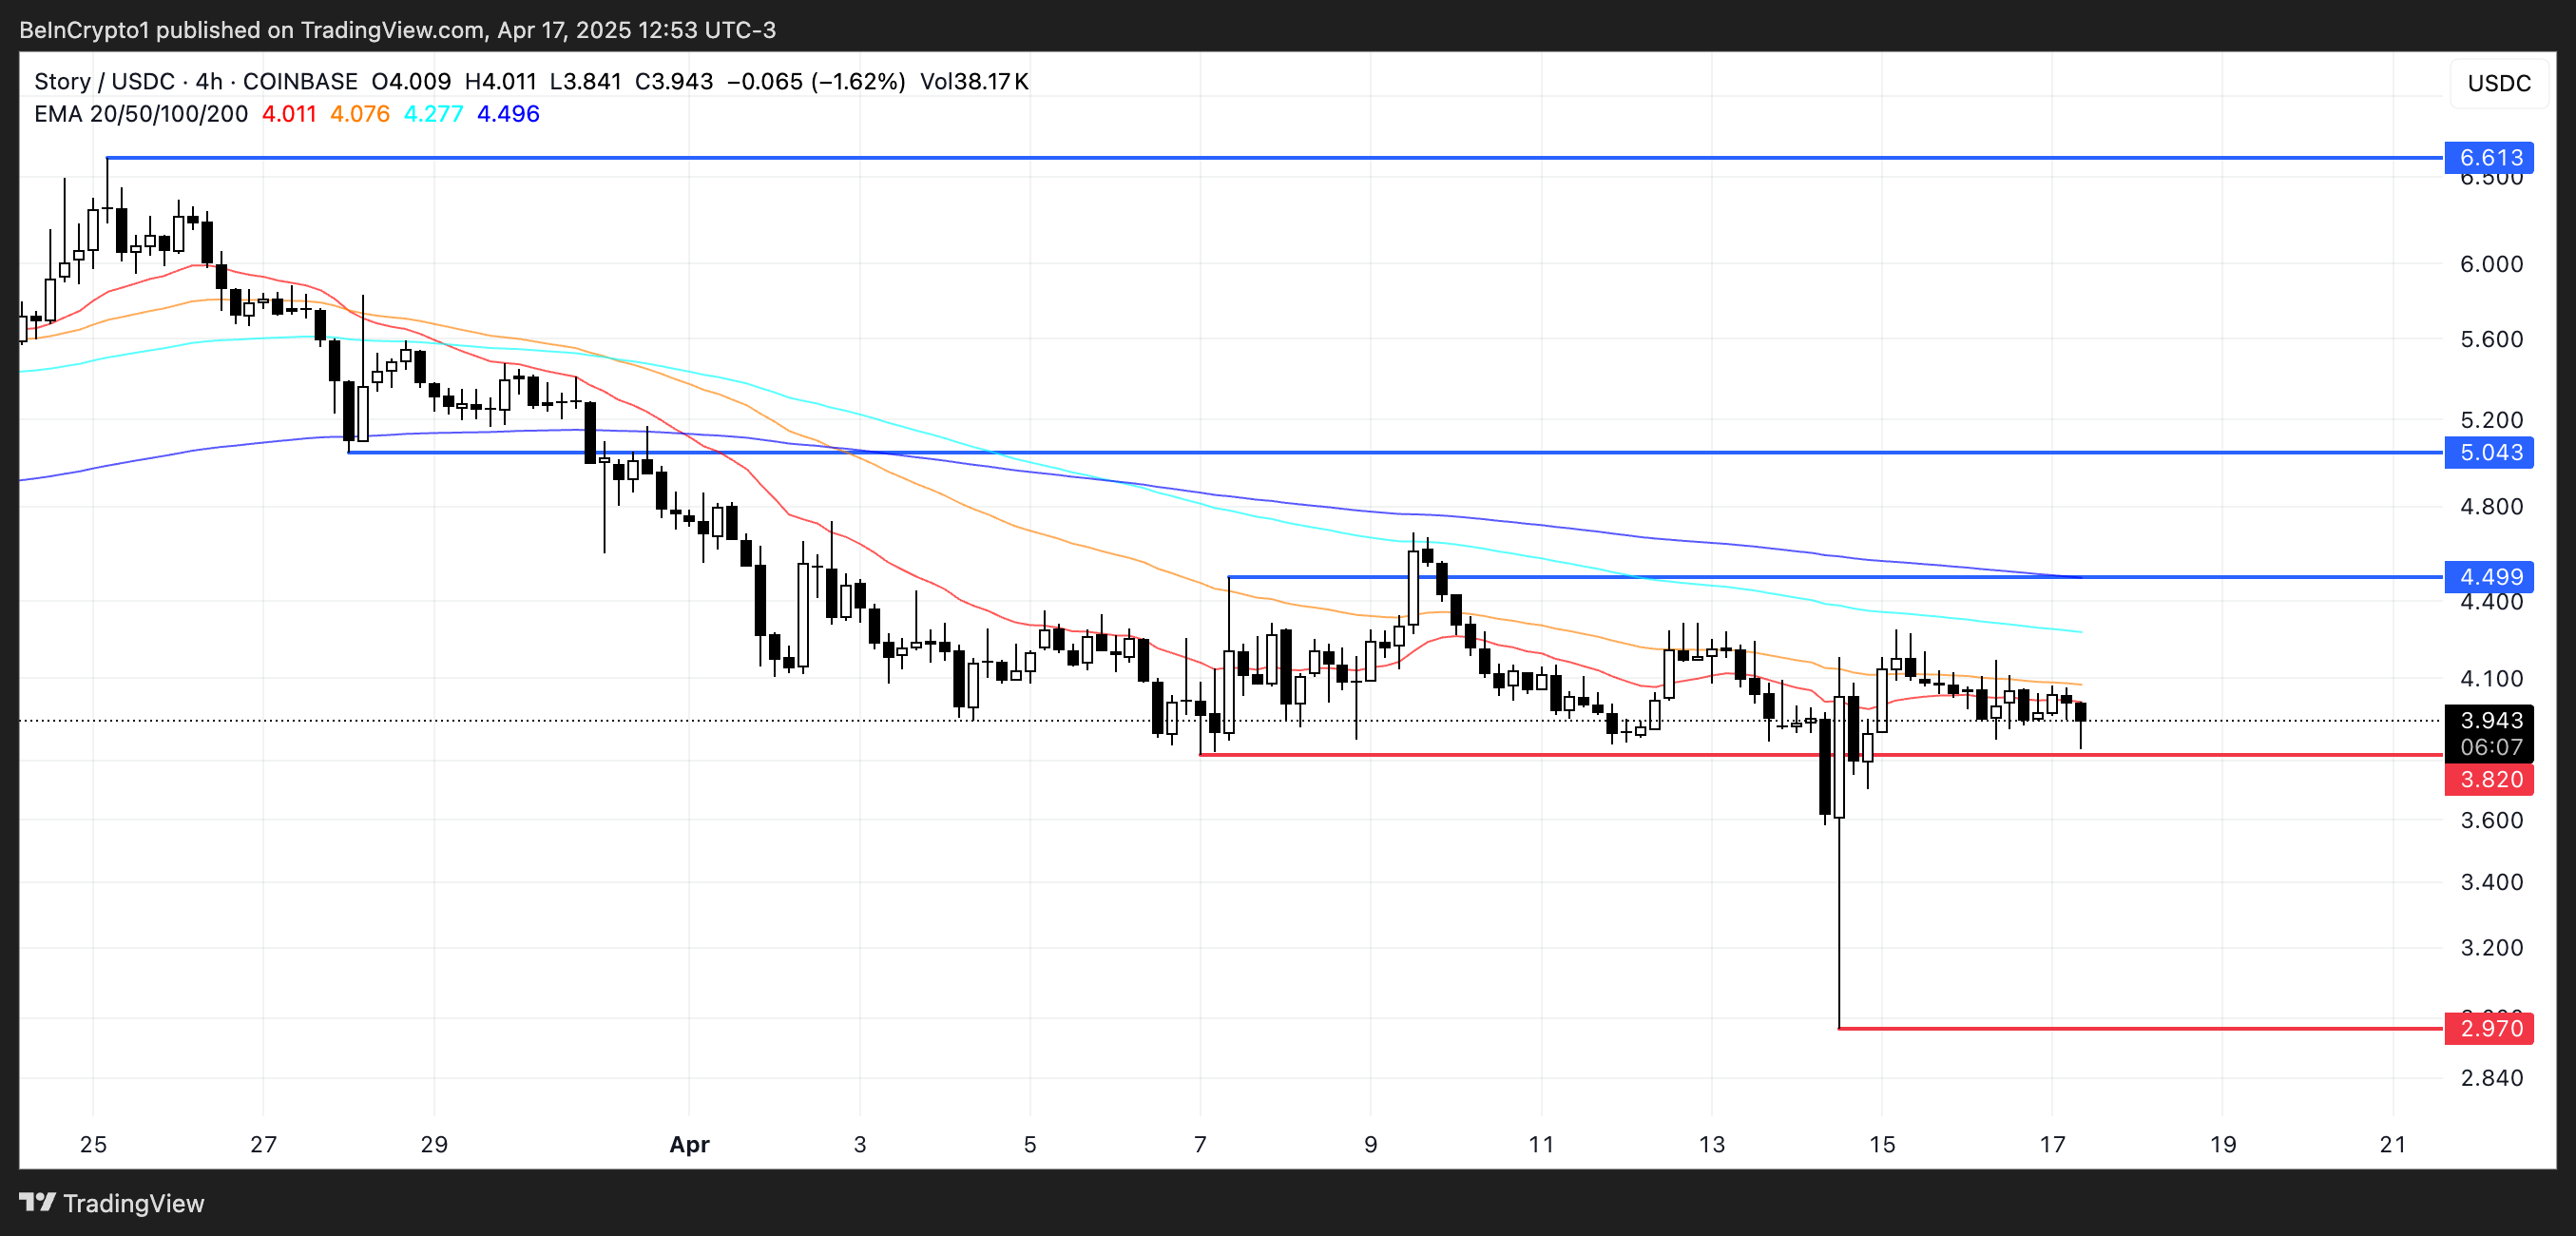
Despite its explosive 477% rally between February 16 and 26, Story’s native token, IP, is down 6.5% over the last seven days—the largest drop among the top 10 AI coins.
If the current correction continues, IP could test support at $3.82, and a break below that may push the price under $3. However, if bullish momentum returns, IP could retest resistance at $4.49 and then aim for $5.04.
A strong rebound could eventually lift the token back toward the $6.61 zone, reclaiming some of its earlier hype.
tokenbot (CLANKER)
Tokenbot is a coin launchpad built on the Base chain. Its native token, CLANKE, has been down over 7% in the last 24 hours.
Notably, Base has climbed to the fourth spot in weekly DEX volume, reaching $4.7 billion—just behind BNB, Ethereum, and Solana—although its volume is down 7.73% in the last week.
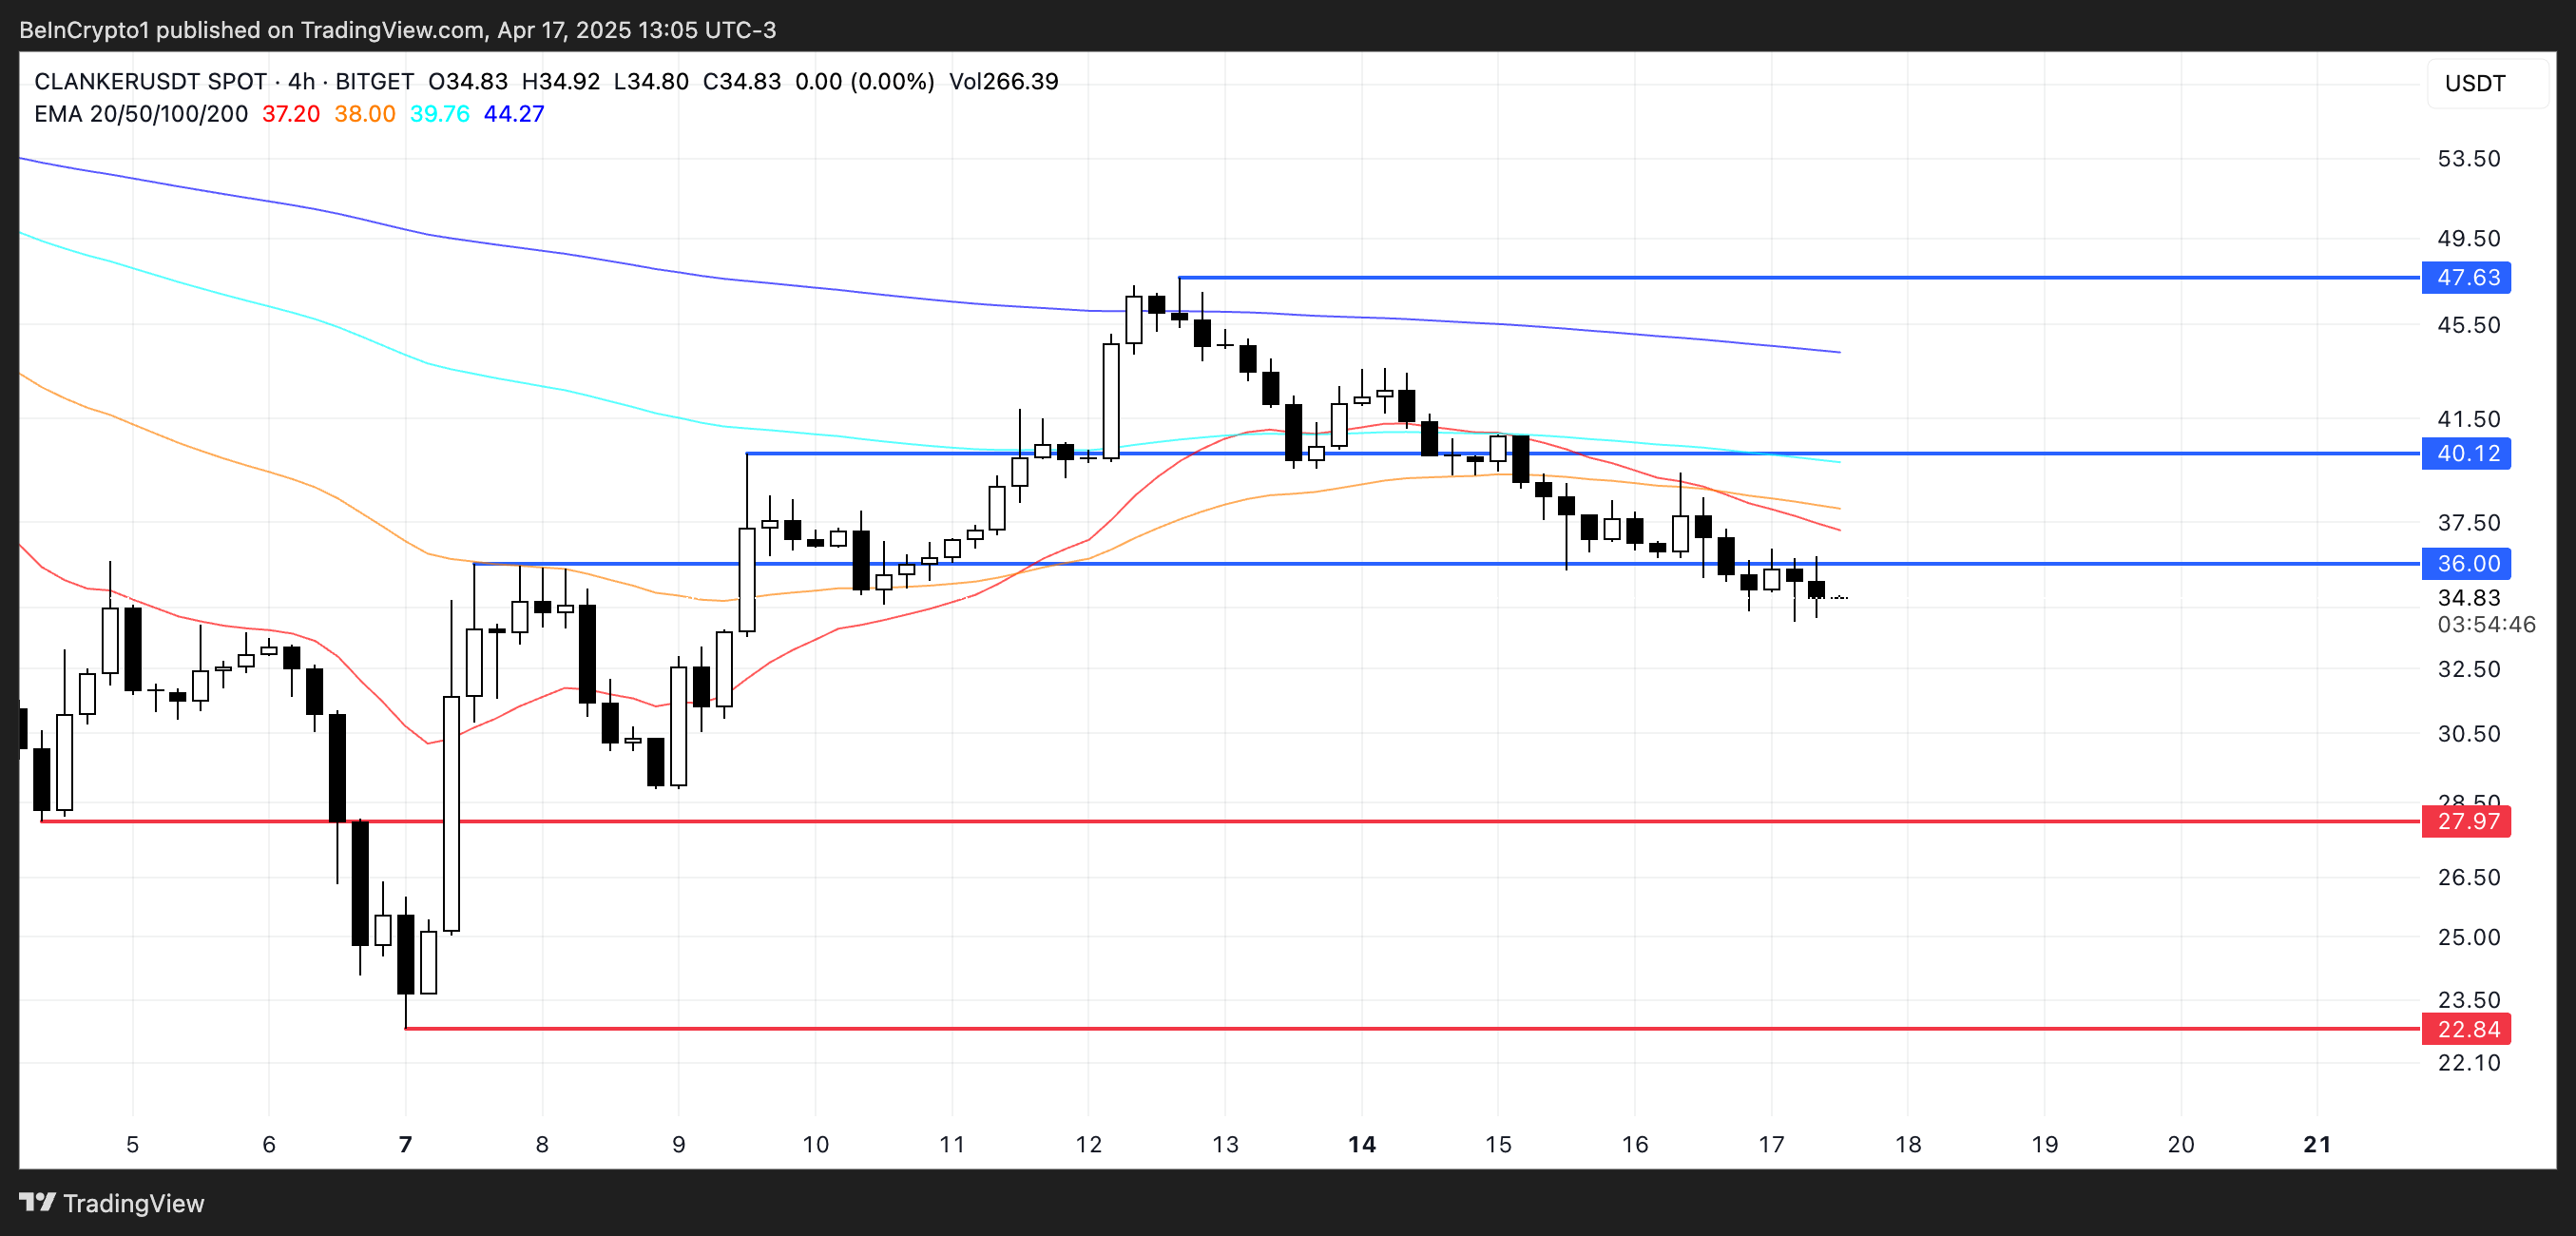
Interest remains around Base’s recent push into “Content Coins,” with the community watching closely to see how the narrative evolves.
If CLANKER’s current downtrend deepens, it could test support at $27.97 and potentially fall to $22.84, dropping below $25 for the first time since April 6.
On the upside, a recovery could lead to a test of the $36 resistance, followed by $40. If sentiment around Base tokens strengthens, CLANKER could rally toward $47 as momentum builds.
Disclaimer
In line with the Trust Project guidelines, this price analysis article is for informational purposes only and should not be considered financial or investment advice. BeInCrypto is committed to accurate, unbiased reporting, but market conditions are subject to change without notice. Always conduct your own research and consult with a professional before making any financial decisions. Please note that our Terms and Conditions, Privacy Policy, and Disclaimers have been updated.

Hedera (HBAR) is up more than 5% in the last 24 hours, showing signs of short-term relief after a rough start to April.
Despite the bounce, technical indicators still point to a weak overall trend, with bearish EMA alignment and a flat ADX reading. Momentum remains uncertain, but bulls have managed to defend key support levels so far.
Hedera Shows Early Signs of Bullish Shift, But Trend Still Weak
Hedera’s DMI indicator shows its ADX at 19.8—slightly up from 18.49 two days ago but down from a recent high of 21.94 earlier today.
The ADX (Average Directional Index) measures the strength of a trend, regardless of its direction. Values below 20 typically indicate a weak or consolidating market, while readings above 25 suggest a strong trend is developing.
HBAR’s current ADX near 20 suggests momentum is still relatively soft, with no clear directional strength in place.

Looking at the directional indicators, the +DI (Directional Indicator) has risen from 13.42 to 14.2, showing a slight increase in bullish pressure. Meanwhile, the -DI has declined from 19.89 to 17.15, indicating weakening bearish momentum.
This narrowing gap between +DI and -DI may signal a potential shift in favor of the bulls, but with ADX still under 25, the trend remains unconfirmed.
If +DI continues to climb and crosses above -DI, Hedera could attempt a short-term reversal—but for now, the market remains in a cautious, sideways phase.
HBAR Enters Cloud Zone as Trend Momentum Stalls
The Ichimoku Cloud chart for HBAR reflects a mostly neutral to slightly bearish trend.
The price is currently trading below the Kijun-sen (red line) and very close to the Tenkan-sen (blue line), indicating weak short-term momentum and a lack of clear direction.
Both lines are flat, which often signals consolidation and market indecision.

Looking ahead, the Kumo (cloud) is relatively thick and bearish, with the Senkou Span A below the Senkou Span B. However, price action has entered the cloud zone, suggesting possible trend exhaustion or transition.
The Chikou Span (lagging green line) is overlapping with recent price candles, reinforcing the sideways outlook.
Unless HBAR breaks cleanly above the cloud and reclaims the Kijun-sen, the market is likely to remain in a holding pattern.
Hedera Holds Key Supports, But Bearishness Still Lingers
Hedera’s EMA lines are currently showing a bearish structure, with short-term averages positioned below the long-term ones—typically a sign of ongoing downward momentum.
Despite this, HBAR price has recently tested and held support at both $0.156 and $0.153, signaling that buyers are still defending key levels. If the trend reverses from here, HBAR could begin a recovery move, first targeting resistance at $0.168.
A break above that level could open the path to $0.178, and if bullish momentum strengthens further, a move toward $0.201 could follow.

On the flip side, if selling pressure resumes, Hedera could retest the same support zones at $0.156 and $0.153.
Losing these levels would weaken the technical structure significantly and could trigger a deeper drop.
In that case, the next major support comes all the way down near $0.124, which would represent a substantial decline and reinforce the current bearish trend.
Disclaimer
In line with the Trust Project guidelines, this price analysis article is for informational purposes only and should not be considered financial or investment advice. BeInCrypto is committed to accurate, unbiased reporting, but market conditions are subject to change without notice. Always conduct your own research and consult with a professional before making any financial decisions. Please note that our Terms and Conditions, Privacy Policy, and Disclaimers have been updated.

Analysts Predict XRP Price to Hit $6 as Wave 2 Correction Nears End

Sui Meme Coins Surge With Rising DEX Volumes

Tron Founder Justin Sun Reveals Plan To HODL Ethereum Despite Price Drop

Top 3 AI Coins To Watch: RENDER, IP, and CLANKER

Ethereum Investors Suffer More Losses Than Bitcoin Amid Ongoing Market Turmoil

Dogecoin Price Breakout in view as Analyst Predicts $5.6 high

2.52 Million Altcoins Are Ruining Crypto’s Future

Animoca Brands Valuation Tanks 75% In Two Years, Here’s Why

Crypto exchange BingX hacked for $43 million

Are The Big Players Losing Interest?

Hong Kong’s Securities Association Tips Authorities On Crypto Self-Regulation

Coinbase cbBTC Set to go Live on Solana
2.52 Million Altcoins Are Ruining Crypto’s Future
Animoca Brands Valuation Tanks 75% In Two Years, Here’s Why
Crypto exchange BingX hacked for $43 million
Are The Big Players Losing Interest?
Hong Kong’s Securities Association Tips Authorities On Crypto Self-Regulation
Coinbase cbBTC Set to go Live on Solana
-

 Market22 hours ago
Ethereum Price Struggles to Rebound—Key Hurdles In The Way
-

 Ethereum21 hours ago
77K Ethereum Moved to Derivatives—Is Another Price Crash Looming?
-
 Market21 hours ago
Bitcoin and Global M2 Money Supply: A Misleading Connection?
-

 Market24 hours ago
XRP Dips To $1.97 – A Golden Opportunity Before The Next Rally?
-

 Market23 hours ago
No Rate Cut Soon, Crypto Banking Rules to Ease
-

 Market16 hours ago
Bitcoin Whales Withdraw $280 Million: Bullish Signal?
-

 Bitcoin21 hours ago
Semler Scientific Files To Buy $500-M In Bitcoin
-

 Market14 hours ago
Expanding Blockspace and Enhancing Privacy
