
Market
32% Loss in a Week Amid Heavy Sell-Offs

PI has been in a persistent downtrend since the start of March. With bearish pressure intensifying over the past week, the token has shed 32% of its value in seven days.
Further losses appear likely as selling pressure strengthens among PI market holders.
PI Bulls Struggle as Trading Activity Plummets
PI currently trades at $1.17, noting a 1% price rise over the past day. Despite this modest uptick, PI’s declining trading volume suggests that the slight rebound is not backed by strong demand for the altcoin. It merely mirrors the broader market growth recorded over the past 24 hours.
During the review period, PI’s trading volume totals $366 million, down 37%. When an asset’s price rises while trading volume declines, it suggests that the upward movement lacks strong buyer participation, making the rally weak or unsustainable.
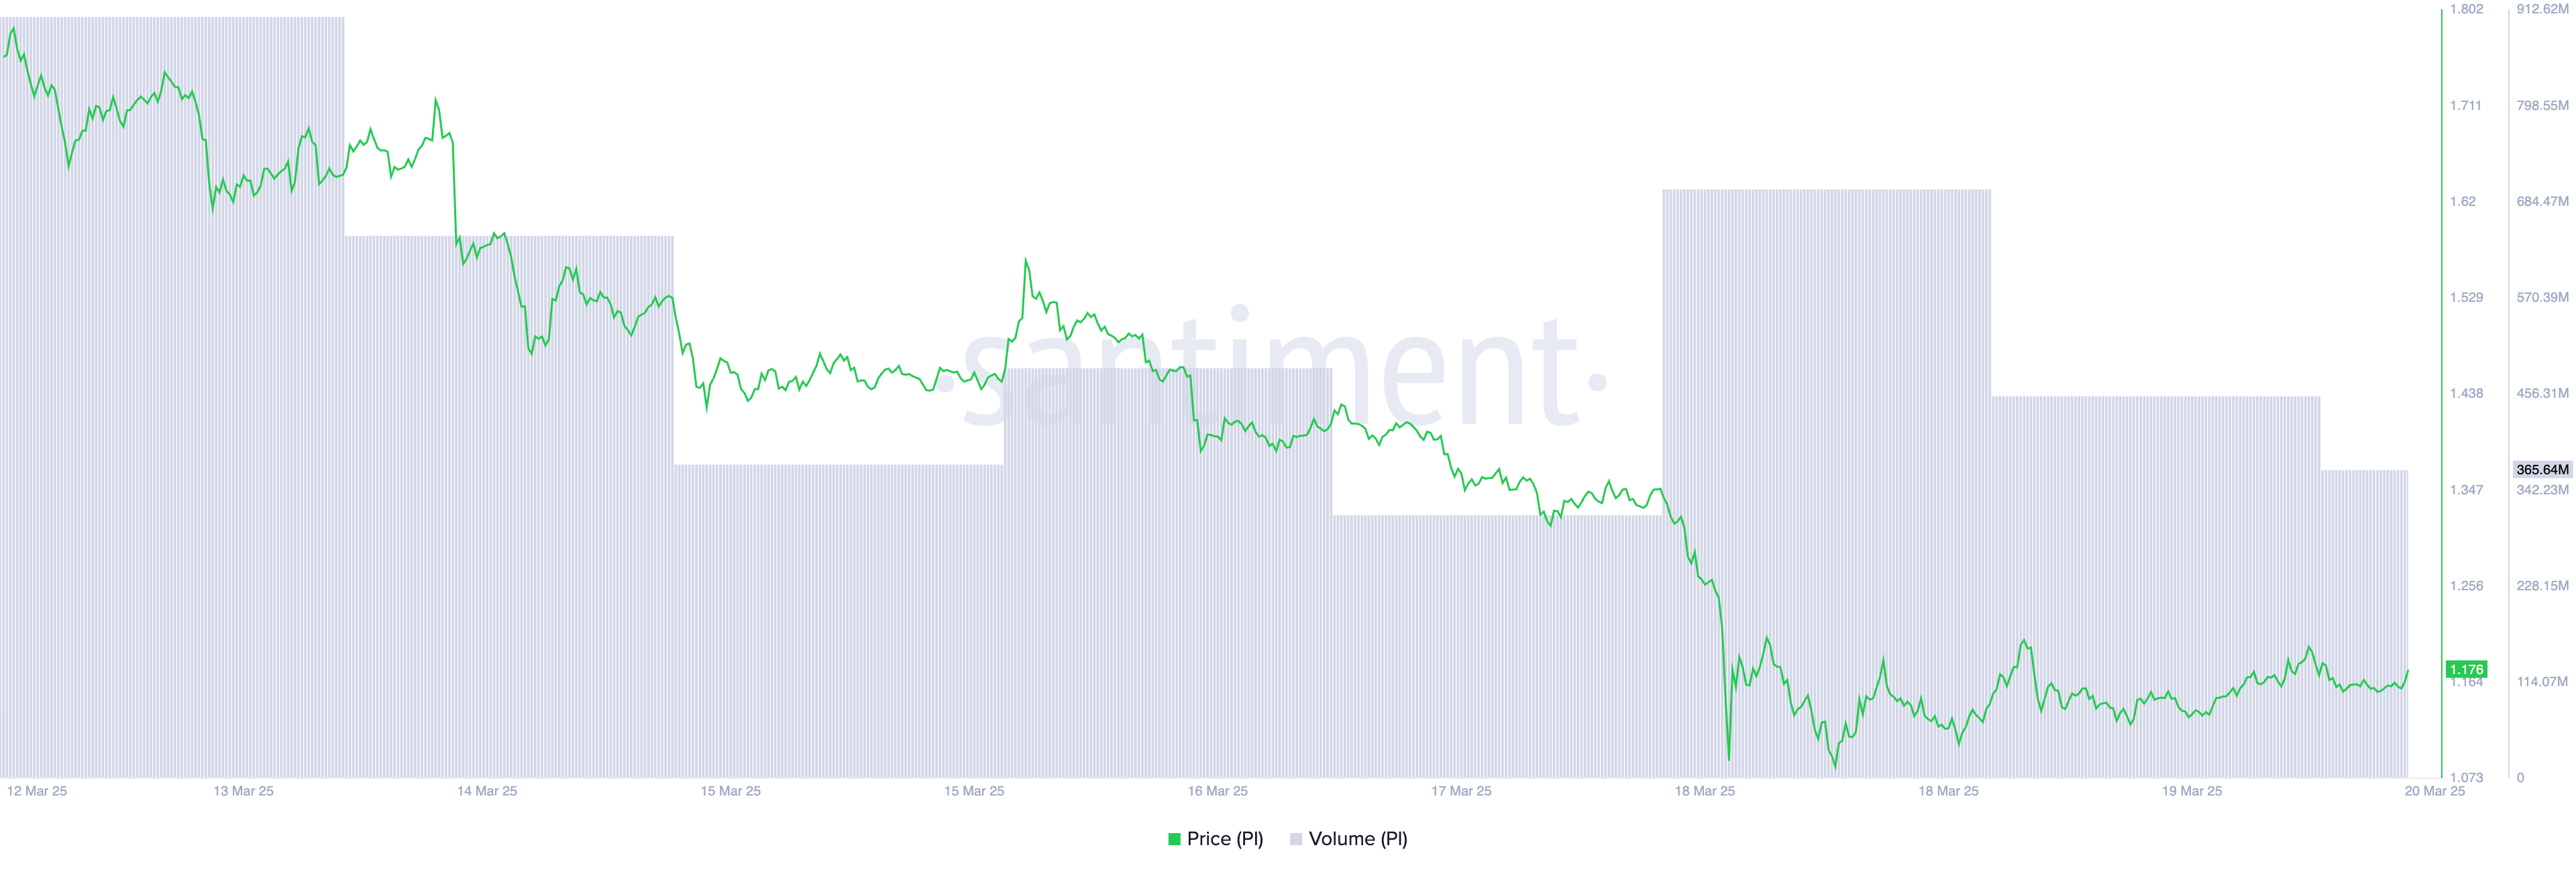
This indicates reduced market interest, as fewer PI traders are supporting the increase. If volume does not pick up, the token’s price may struggle to maintain its gains and could resume its decline.
Further reinforcing the negative outlook, PI’s BBTrend remains in the red, confirming that bearish forces are firmly in control. Observed on a four-hour chart, the momentum indicator is at -32.45, the lowest it has ever been since PI launched.
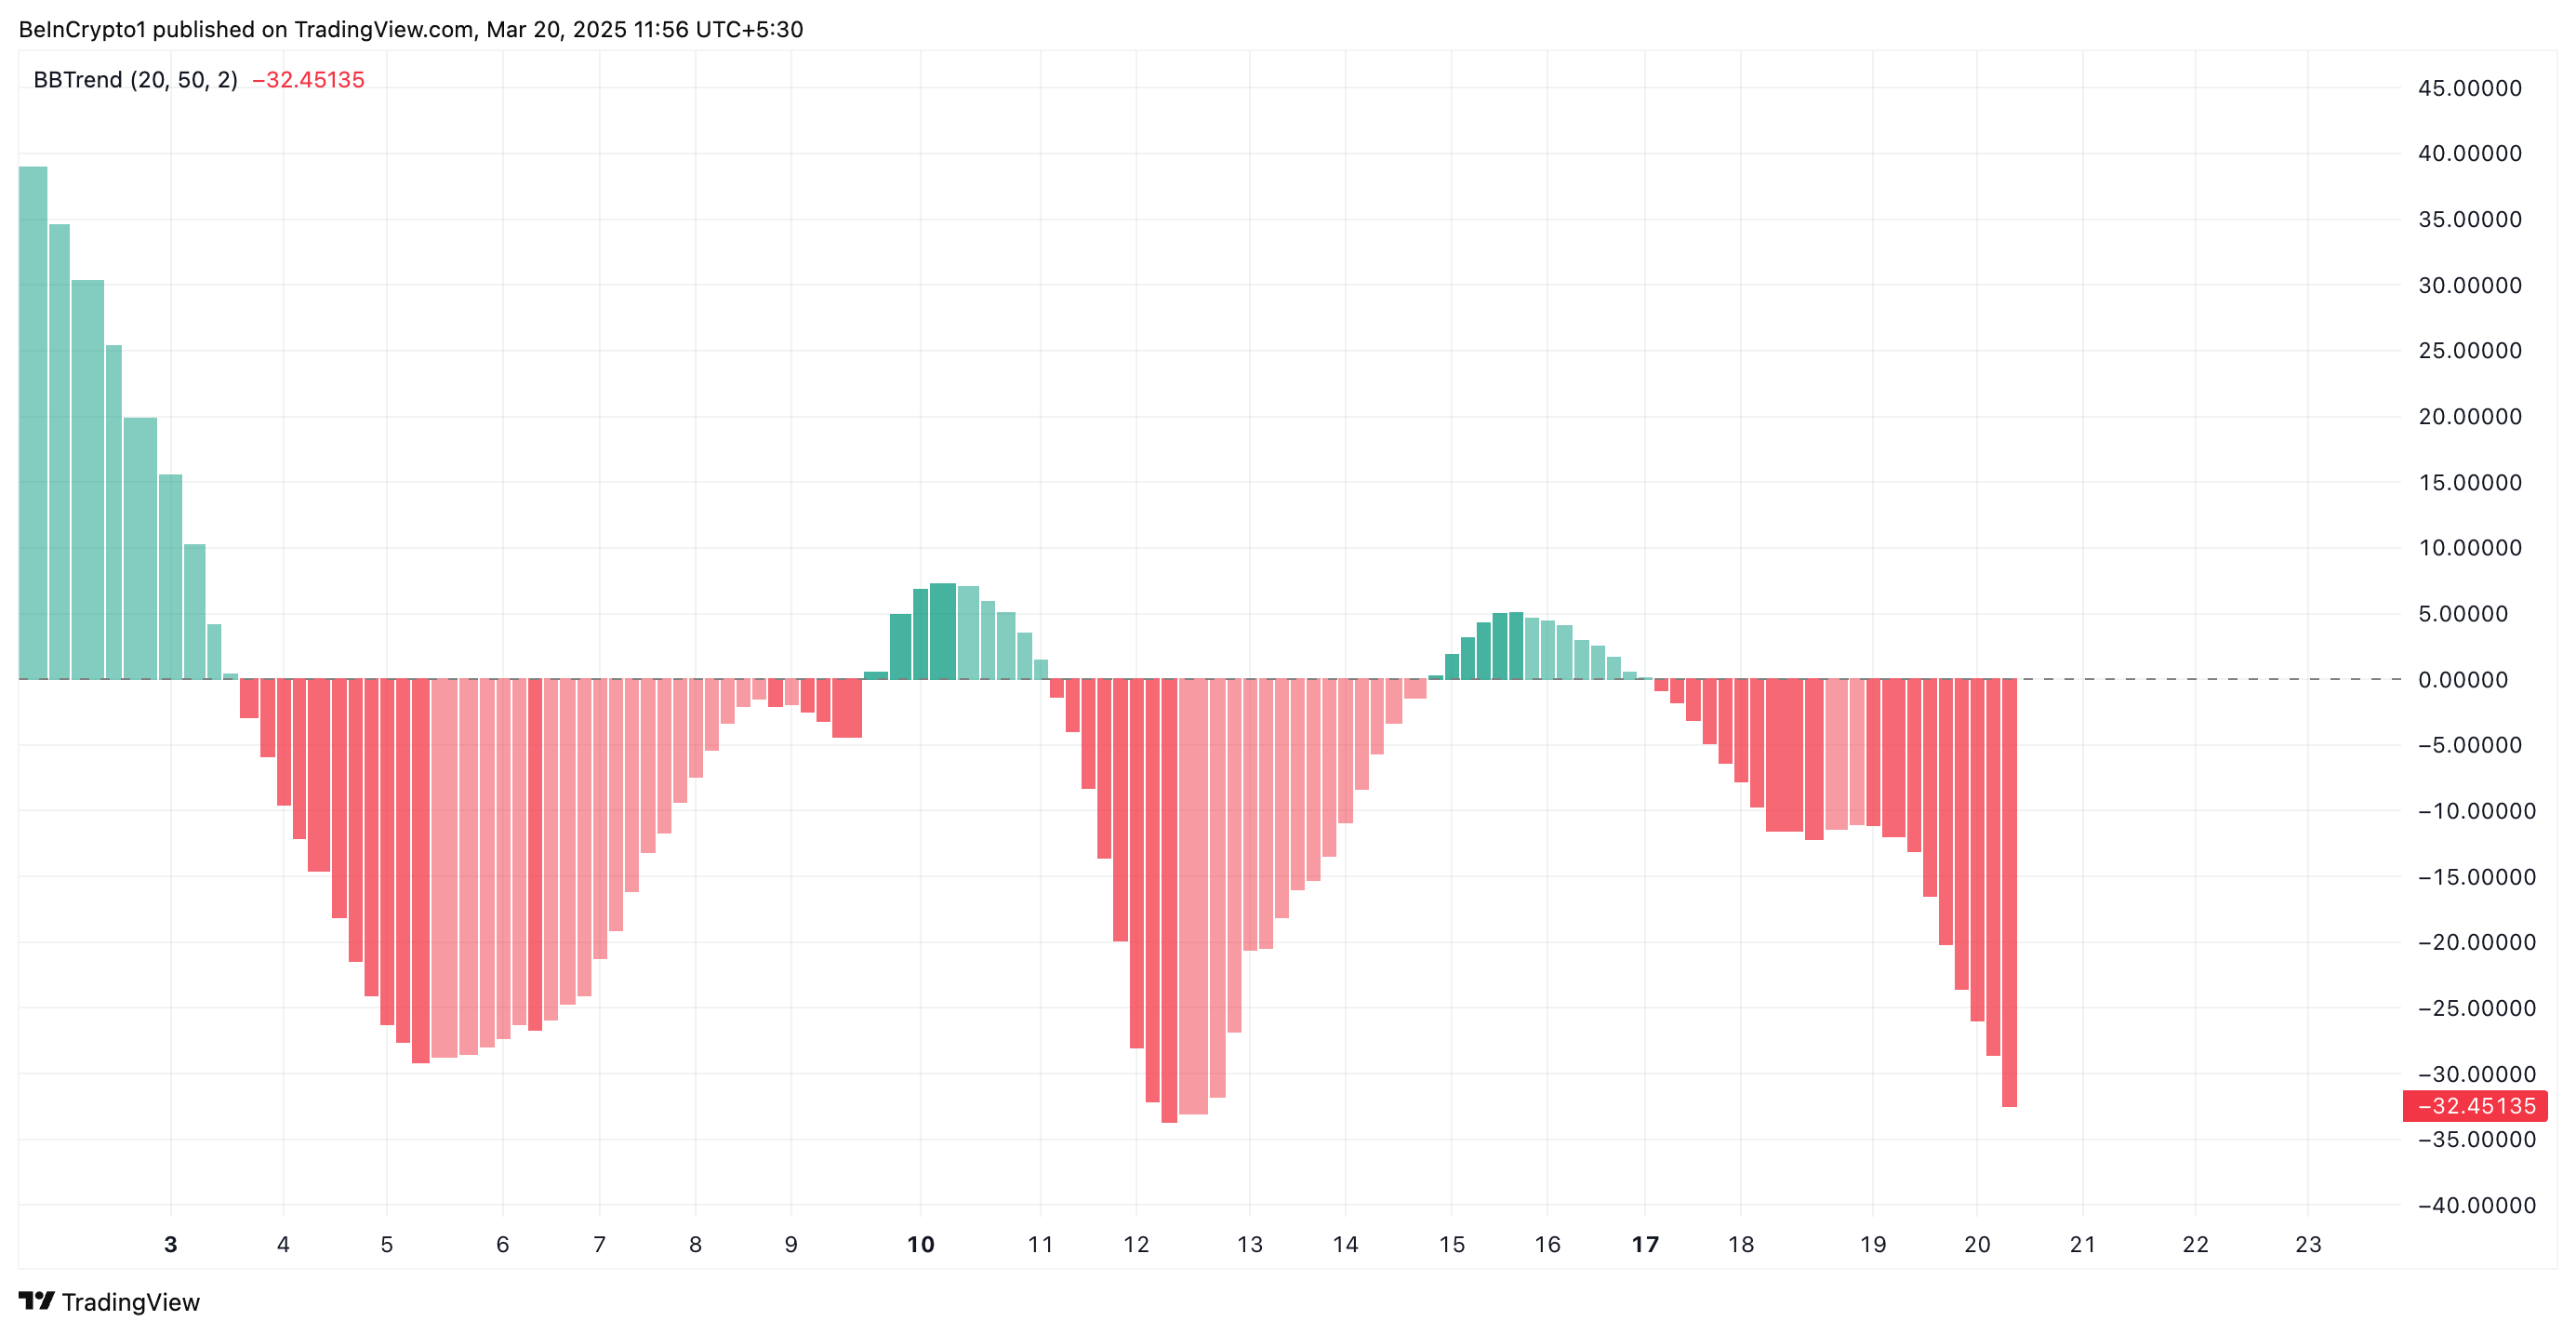
The BBTrend indicator measures the strength and direction of an asset’s price movement in relation to the Bollinger Bands. A positive BBTrend value signals an uptrend, indicating that prices are pushing toward the upper band with strong momentum.
Conversely, a negative BBTrend value indicates a downtrend, suggesting that the asset is trading closer to the lower band, with bearish pressure prevailing.
When an asset’s BBTrend is deep in negative territory like PI’s, it indicates a strong and persistent downtrend, with sellers firmly in control. This suggests that PI’s price declines are not just short-term corrections but part of a broader bearish trend accompanied by significant volatility.
PI Holds Critical $1.11 Support—Will Bulls Prevent a Drop to $0.87?
PI currently holds above the support formed at $1.11. If selloffs intensify, the bulls might be unable to defend this support floor, causing the token’s price to plummet to $0.87.
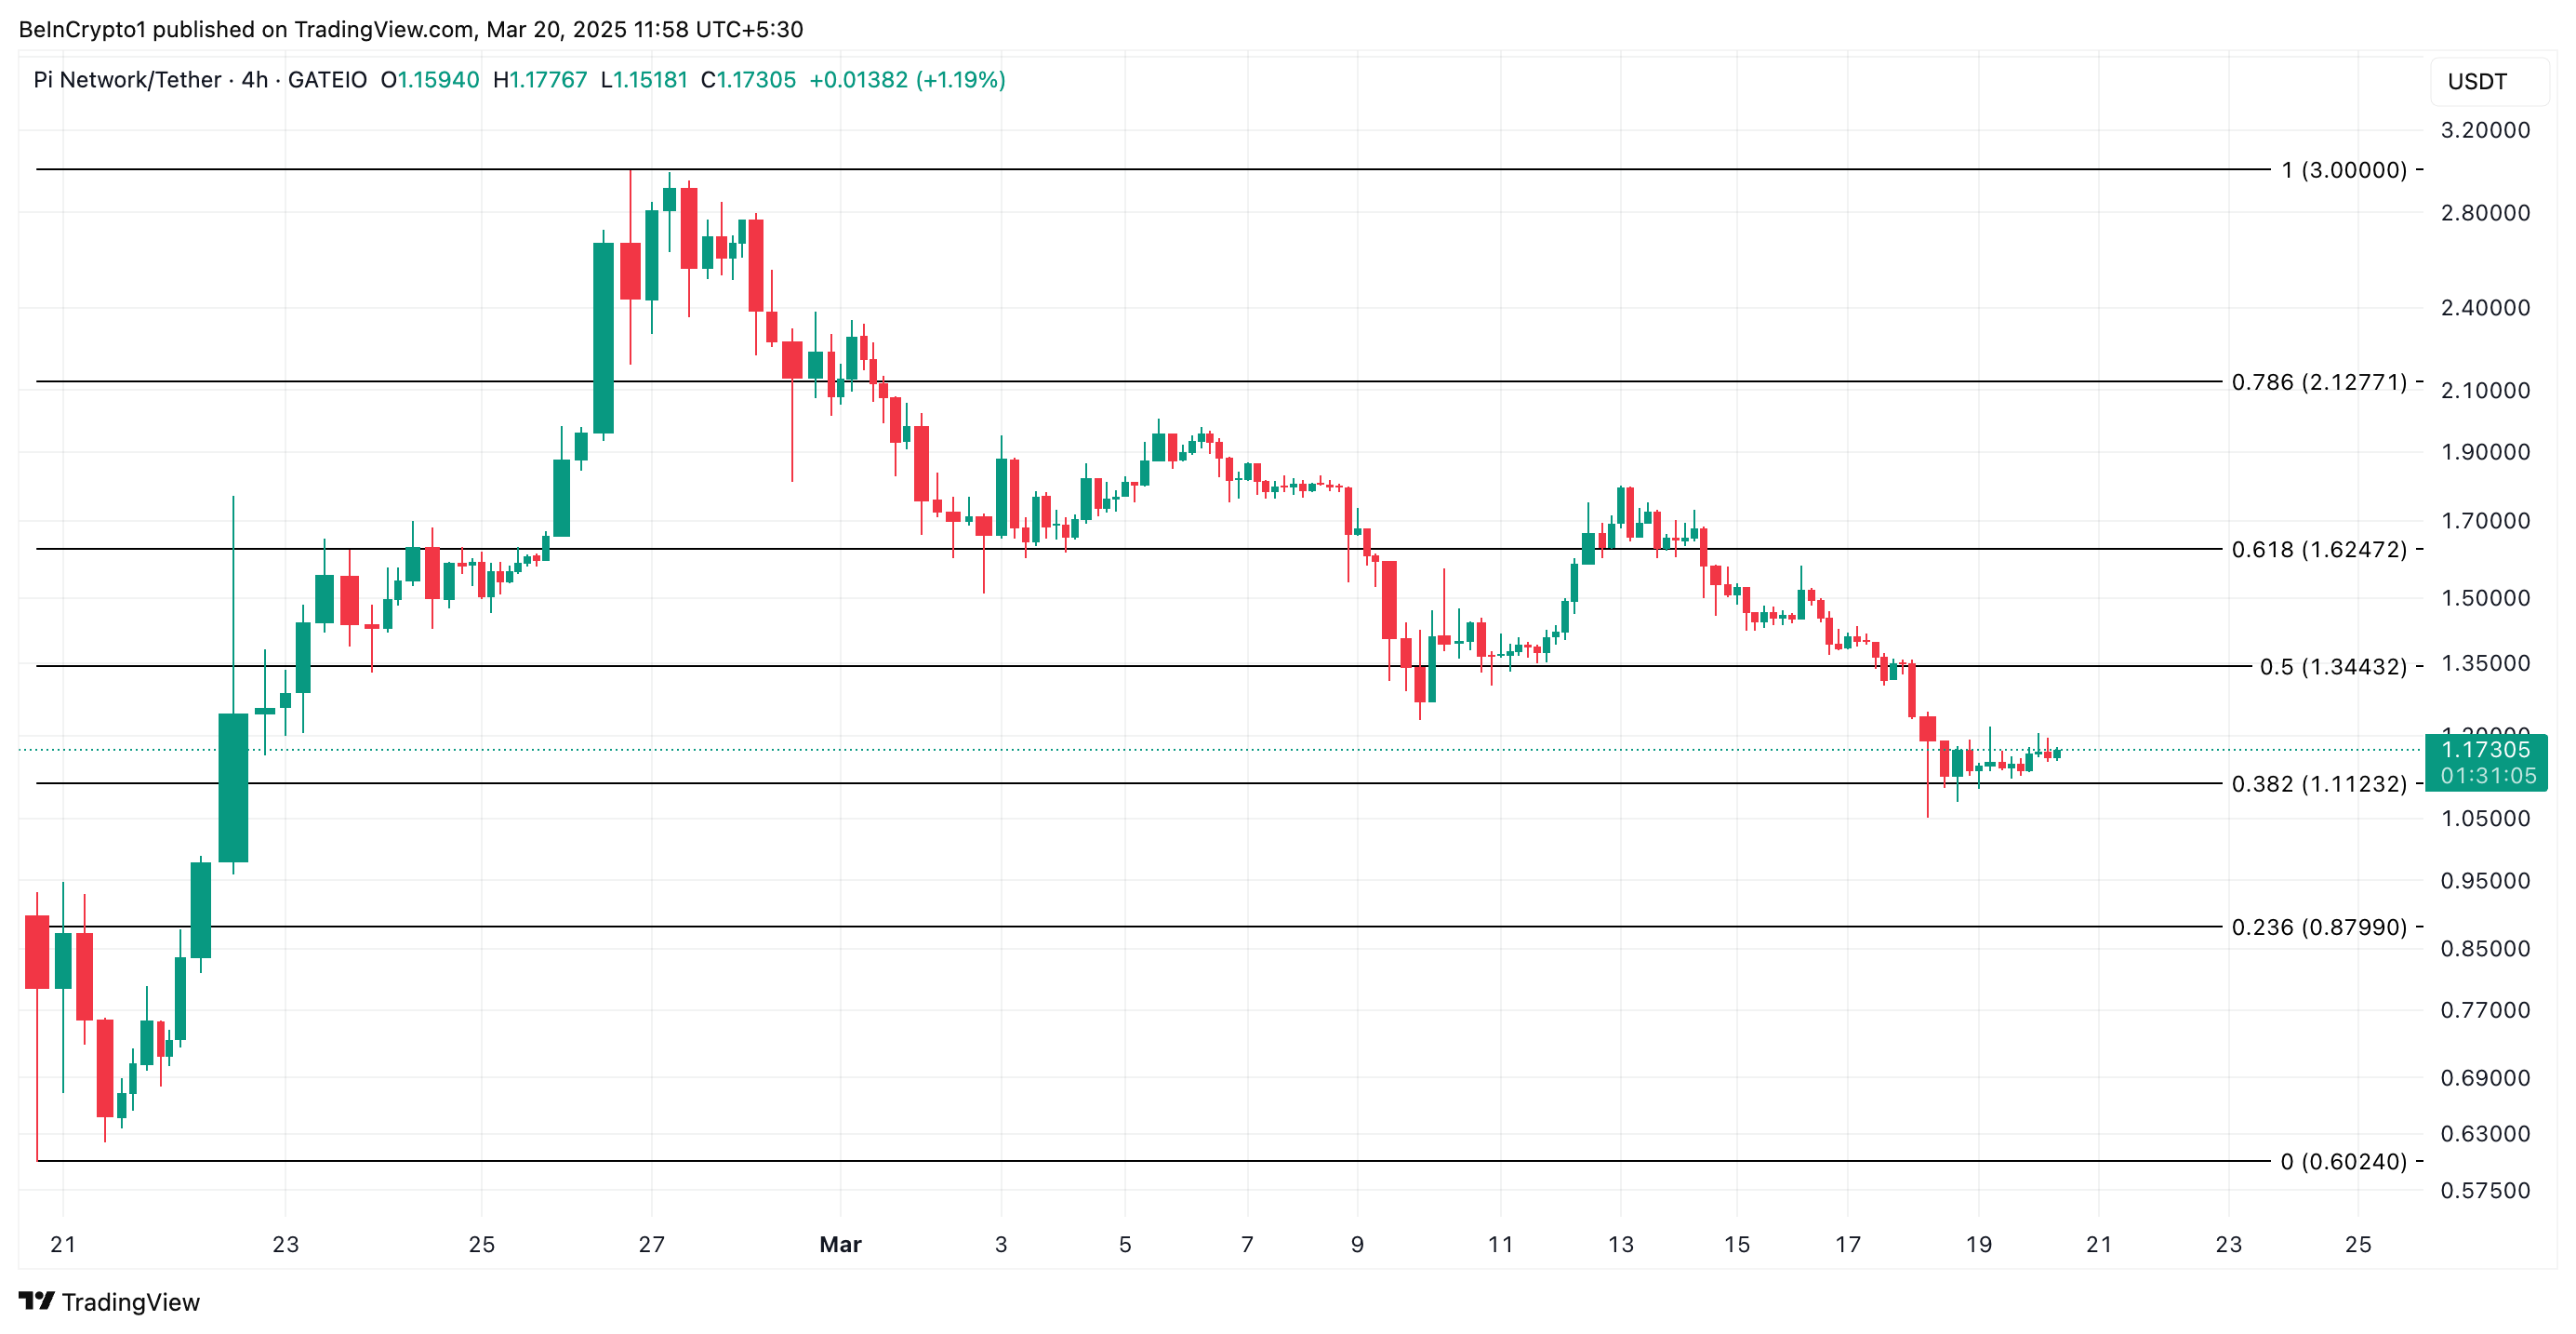
On the other hand, a positive shift in market sentiment and a resurgence in new demand for PI would invalidate this bullish projection. In that scenario, the token’s price could resume its rally and climb toward $1.34.
Disclaimer
In line with the Trust Project guidelines, this price analysis article is for informational purposes only and should not be considered financial or investment advice. BeInCrypto is committed to accurate, unbiased reporting, but market conditions are subject to change without notice. Always conduct your own research and consult with a professional before making any financial decisions. Please note that our Terms and Conditions, Privacy Policy, and Disclaimers have been updated.


Onyxcoin (XCN) has been under heavy selling pressure, dropping more than 11% in the last seven days and over 30% in the past month. Multiple indicators now reflect this sustained weakness, with momentum and trend signals leaning decisively bearish.
The RSI is nearing oversold levels, while the ADX shows the downtrend is gaining strength. Unless buyers step in soon, XCN could face deeper losses before any meaningful recovery attempt takes shape.
Onyxcoin RSI Is Almost Reaching Oversold Levels
Onyxcoin’s Relative Strength Index (RSI) has dropped sharply to 31.63, down from 48.72 just a day earlier. This significant decline brings it closer to the oversold threshold and highlights the growing bearish momentum.
The RSI has now remained below the neutral 50 mark for the past 12 consecutive days, signaling that bearish sentiment has been dominant throughout this period.
This ongoing weakness suggests that sellers continue to control the market, and the latest drop may indicate a deepening of the current downtrend.
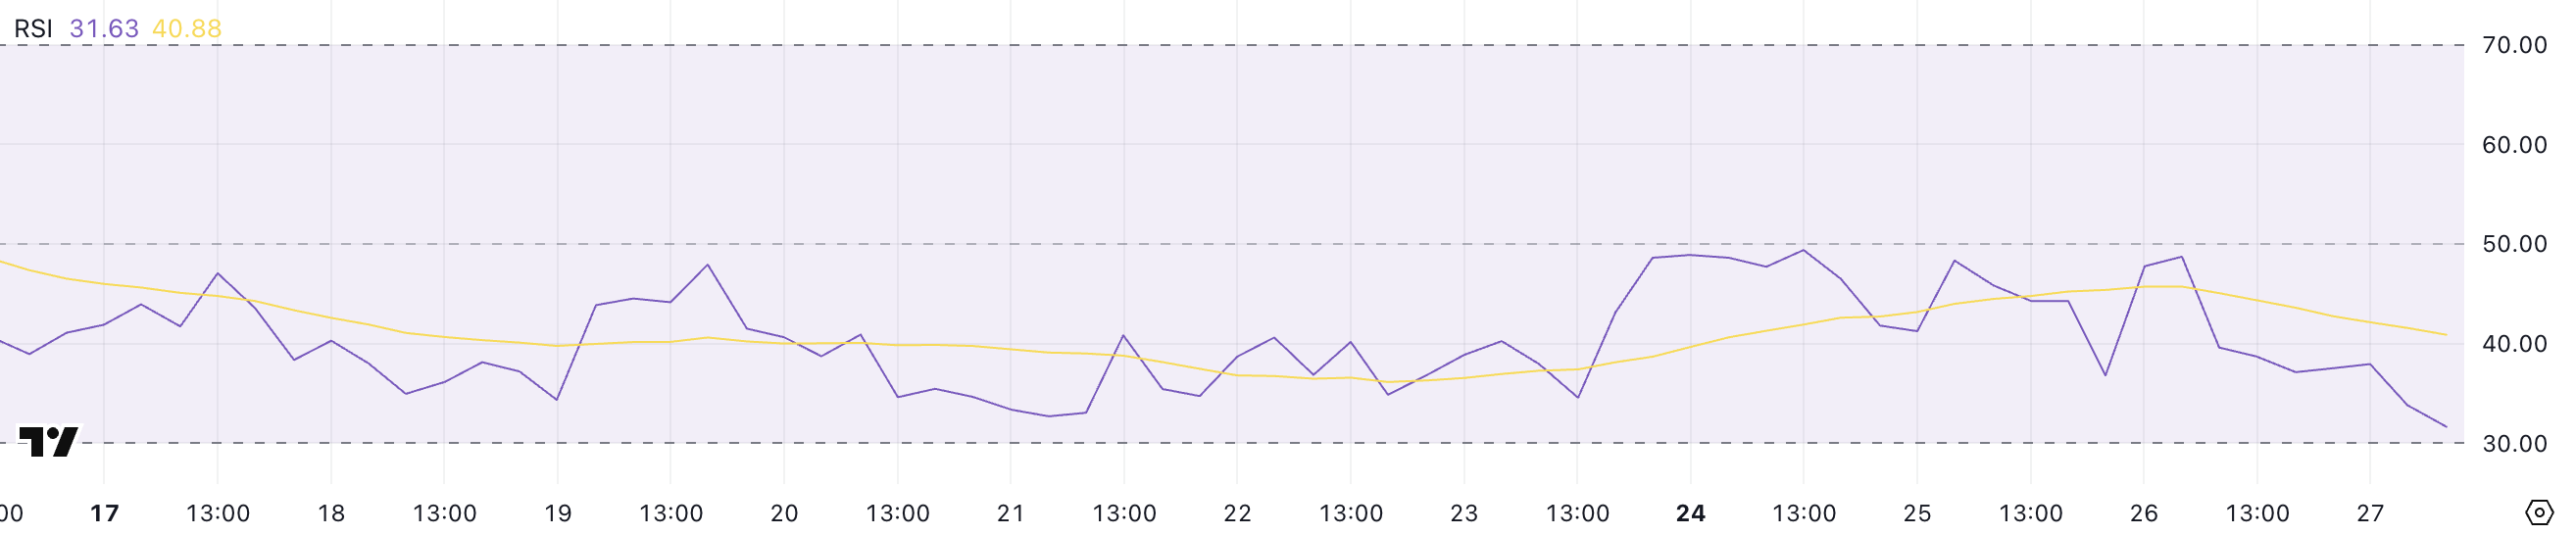
The RSI is a momentum oscillator that measures the speed and change of price movements on a scale from 0 to 100. Readings above 70 typically suggest an asset is overbought and may be due for a correction, while values below 30 indicate oversold conditions that could lead to a potential rebound.
XCN’s current RSI of 31.63 puts it just above oversold territory, which means a bounce is possible—but far from guaranteed. If bearish pressure persists and the RSI dips below 30, it could signal panic selling or capitulation.
On the other hand, a quick recovery in RSI above 40 could hint at fading selling pressure and the early signs of a trend reversal.
XCN ADX Shows The Downtrend Is Getting Stronger
Onyxcoin Average Directional Index (ADX) has surged to 24.17, up from 12.86 just a day ago, signaling a rapid increase in trend strength.
The ADX measures the intensity of a trend, regardless of its direction, and this sharp rise suggests that the current downtrend is gaining traction.
With XCN’s price already moving lower, the strengthening ADX reinforces the idea that bears are firmly in control, and the downward momentum may continue in the near term.
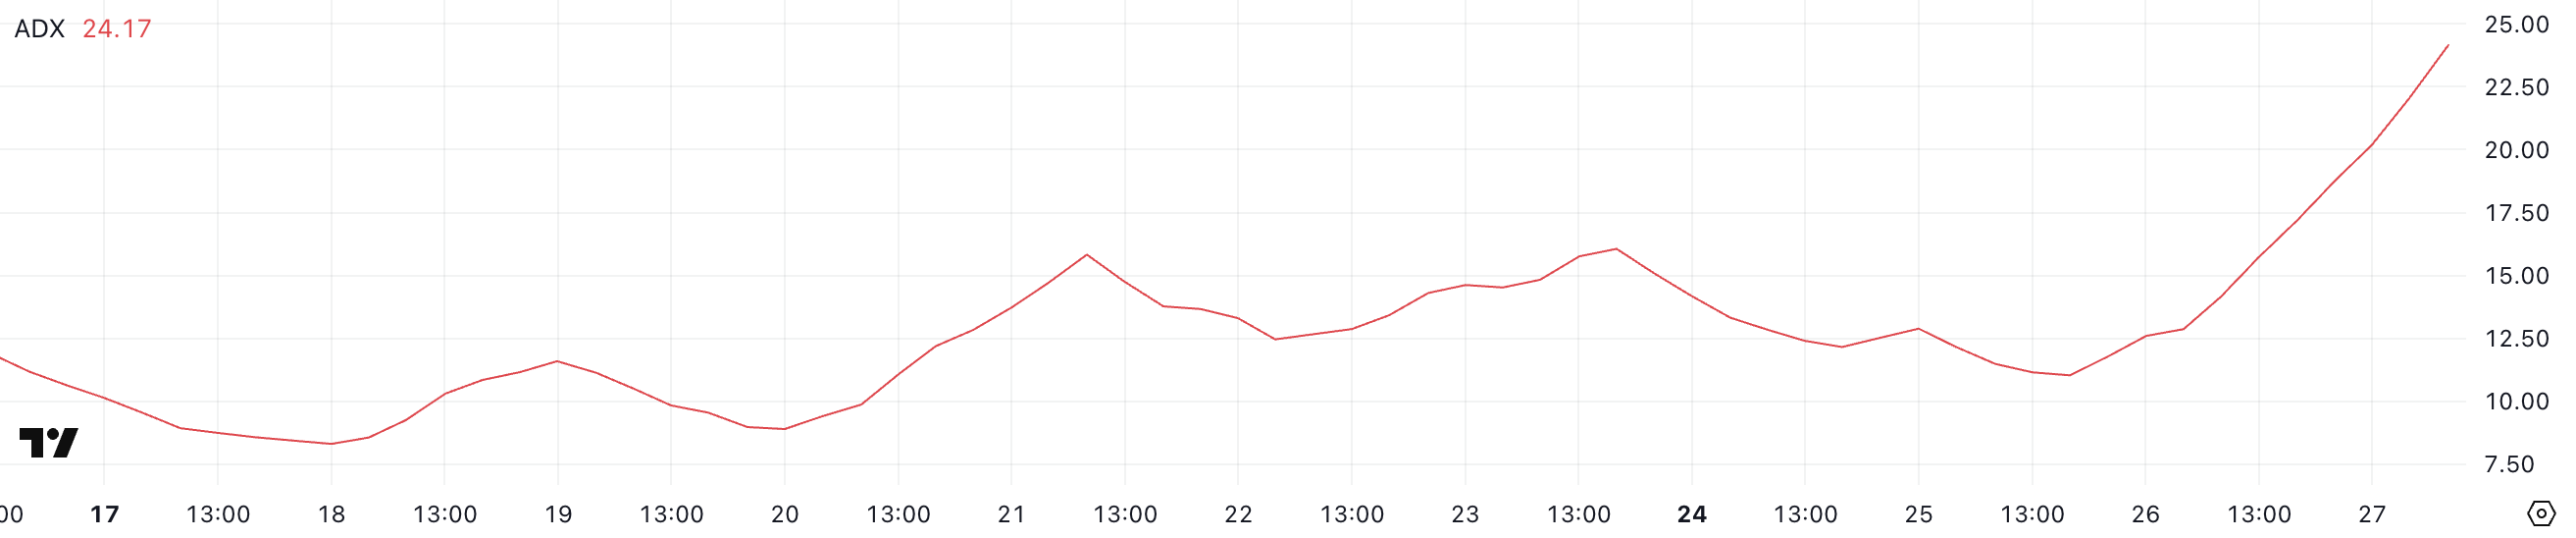
The ADX operates on a scale from 0 to 100, with readings below 20 typically indicating a weak or non-existent trend. Values between 20 and 25 point to a trend that may be starting to build, while anything above 25 signals a strong, established trend.
XCN’s current ADX at 24.17 is right on the edge of this critical threshold, suggesting that the downtrend is transitioning from early-stage to potentially stronger territory.
If the ADX continues rising above 25 while the price stays in decline, it would confirm that sellers are driving a more powerful move lower, and any bullish reversal attempt could face strong resistance.
Onyxcoin Correction Could Continue
Onyxcoin EMA lines are currently aligned in a bearish formation, suggesting that the downtrend may persist in the short term.
If the bearish momentum continues, XCN could retest the support level at $0.0083, a critical zone that previously acted as a floor.
A breakdown below this level would likely expose the token to further downside, potentially causing it to fall to $0.0051, its lowest price since January 17.
The current EMA structure highlights weakening bullish pressure and increasing vulnerability to additional selling.
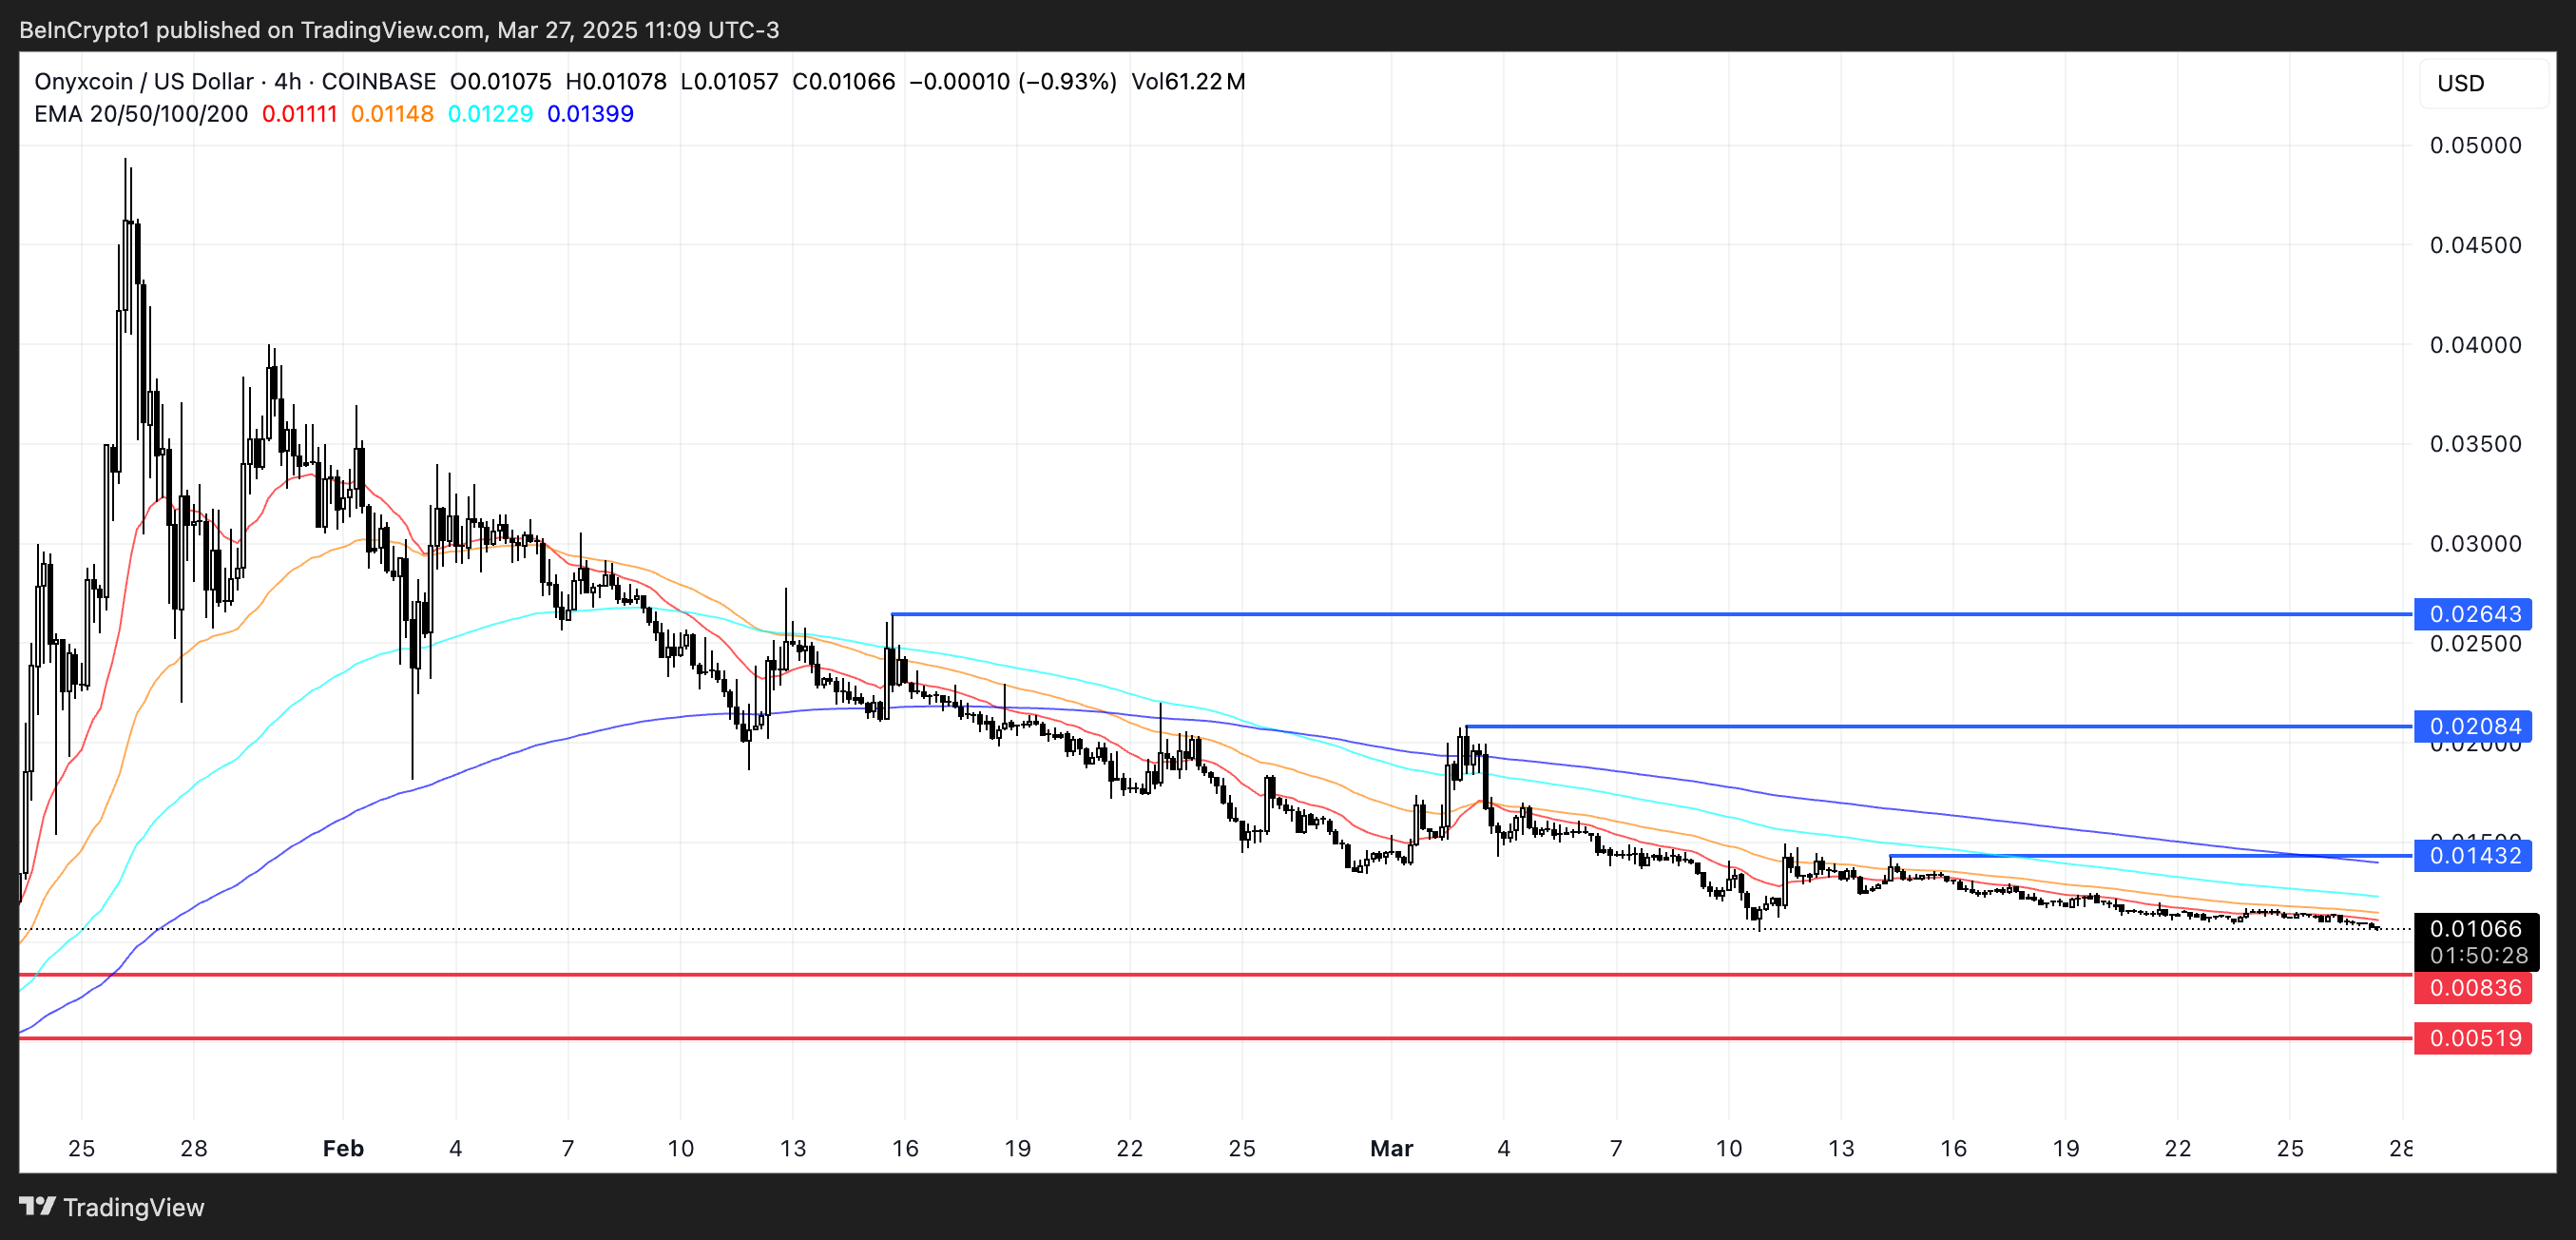
However, there’s still a path to recovery if Onyxcoin can regain the strong momentum it showed at the end of January, when it was one of the most talked-about altcoins in the market.
A reversal could take XCN back to test the resistance at $0.014, and a successful breakout above that would signal renewed bullish strength.
If buyers push further, price targets at $0.020 and even $0.026 will become relevant—levels not seen since mid-February.
Disclaimer
In line with the Trust Project guidelines, this price analysis article is for informational purposes only and should not be considered financial or investment advice. BeInCrypto is committed to accurate, unbiased reporting, but market conditions are subject to change without notice. Always conduct your own research and consult with a professional before making any financial decisions. Please note that our Terms and Conditions, Privacy Policy, and Disclaimers have been updated.

Binance announced the results of its first community listing vote. The exchange will list four meme coins tomorrow. It was expected to launch only two, and the value of BROCCOLI, Tutorial, and BANANAS31 rallied.
However, Bananas for Scale only had a small gain, and Mubarak actually experienced a sharp decline. This may reveal fatigue in the meme coin space or a saturation of CZ-related assets.
Binance, the world’s largest crypto exchange, is trying out a new solution to determine token listings. After the vote to list Pi Network, the firm introduced a vote-based system for listings and delistings.
Binance’s first listing vote began last week, and today, the company announced the winners:
“Following the Vote to List results and completion of due diligence, Binance will list Mubarak (MUBARAK), CZ’S Dog (BROCCOLI714), Tutorial (TUT), and Banana For Scale (BANANAS31) and open trading for the following spot trading pairs at 2025-03-27 21:00 (UTC),” Binance claimed via press release.
At first, Binance claimed that only two of nine candidates in the first vote would get listings, but four of them are receiving this treatment. Typically, tokens spike when they are listed on Binance, and today, that trend largely continued.
Three of the four meme coins did well, including Broccoli, which was named after CZ’s dog.
BROCCOLI rose 65%, and Banana for Scale went up by 11%. Tutorial was the best performer, gaining over 200% in value.
However, Mubarak, an up-and-coming meme coin, actually dropped after Binance announced that it won the vote. It’s still posting net gains from the last 24 hours, but this immediate drop suggests that the news was already priced in.
Despite prominent social media buzz, Mubarak’s price has mostly stagnated in the last ten days, and it was launched 11 days ago. The meme coin market is showing signs of fatigue, and Binance’s vote may not be enough to change it.
Some users on social media have pointed out a simpler explanation. Of the four vote winners, three are either related to or connected to CZ, the former CEO of Binance. This might limit the assets’ broader market appeal.
It’s important not to overstate the case here. Mubarak dropped after the announcement, but it was largely expected to be listed. Indeed, most of the winners were fine, although BANANAS31’s 11% gains are not particularly encouraging.
If Binance keeps holding listing votes as planned, fewer winners and more unique offerings might help stave off investor fatigue.
Disclaimer
In adherence to the Trust Project guidelines, BeInCrypto is committed to unbiased, transparent reporting. This news article aims to provide accurate, timely information. However, readers are advised to verify facts independently and consult with a professional before making any decisions based on this content. Please note that our Terms and Conditions, Privacy Policy, and Disclaimers have been updated.

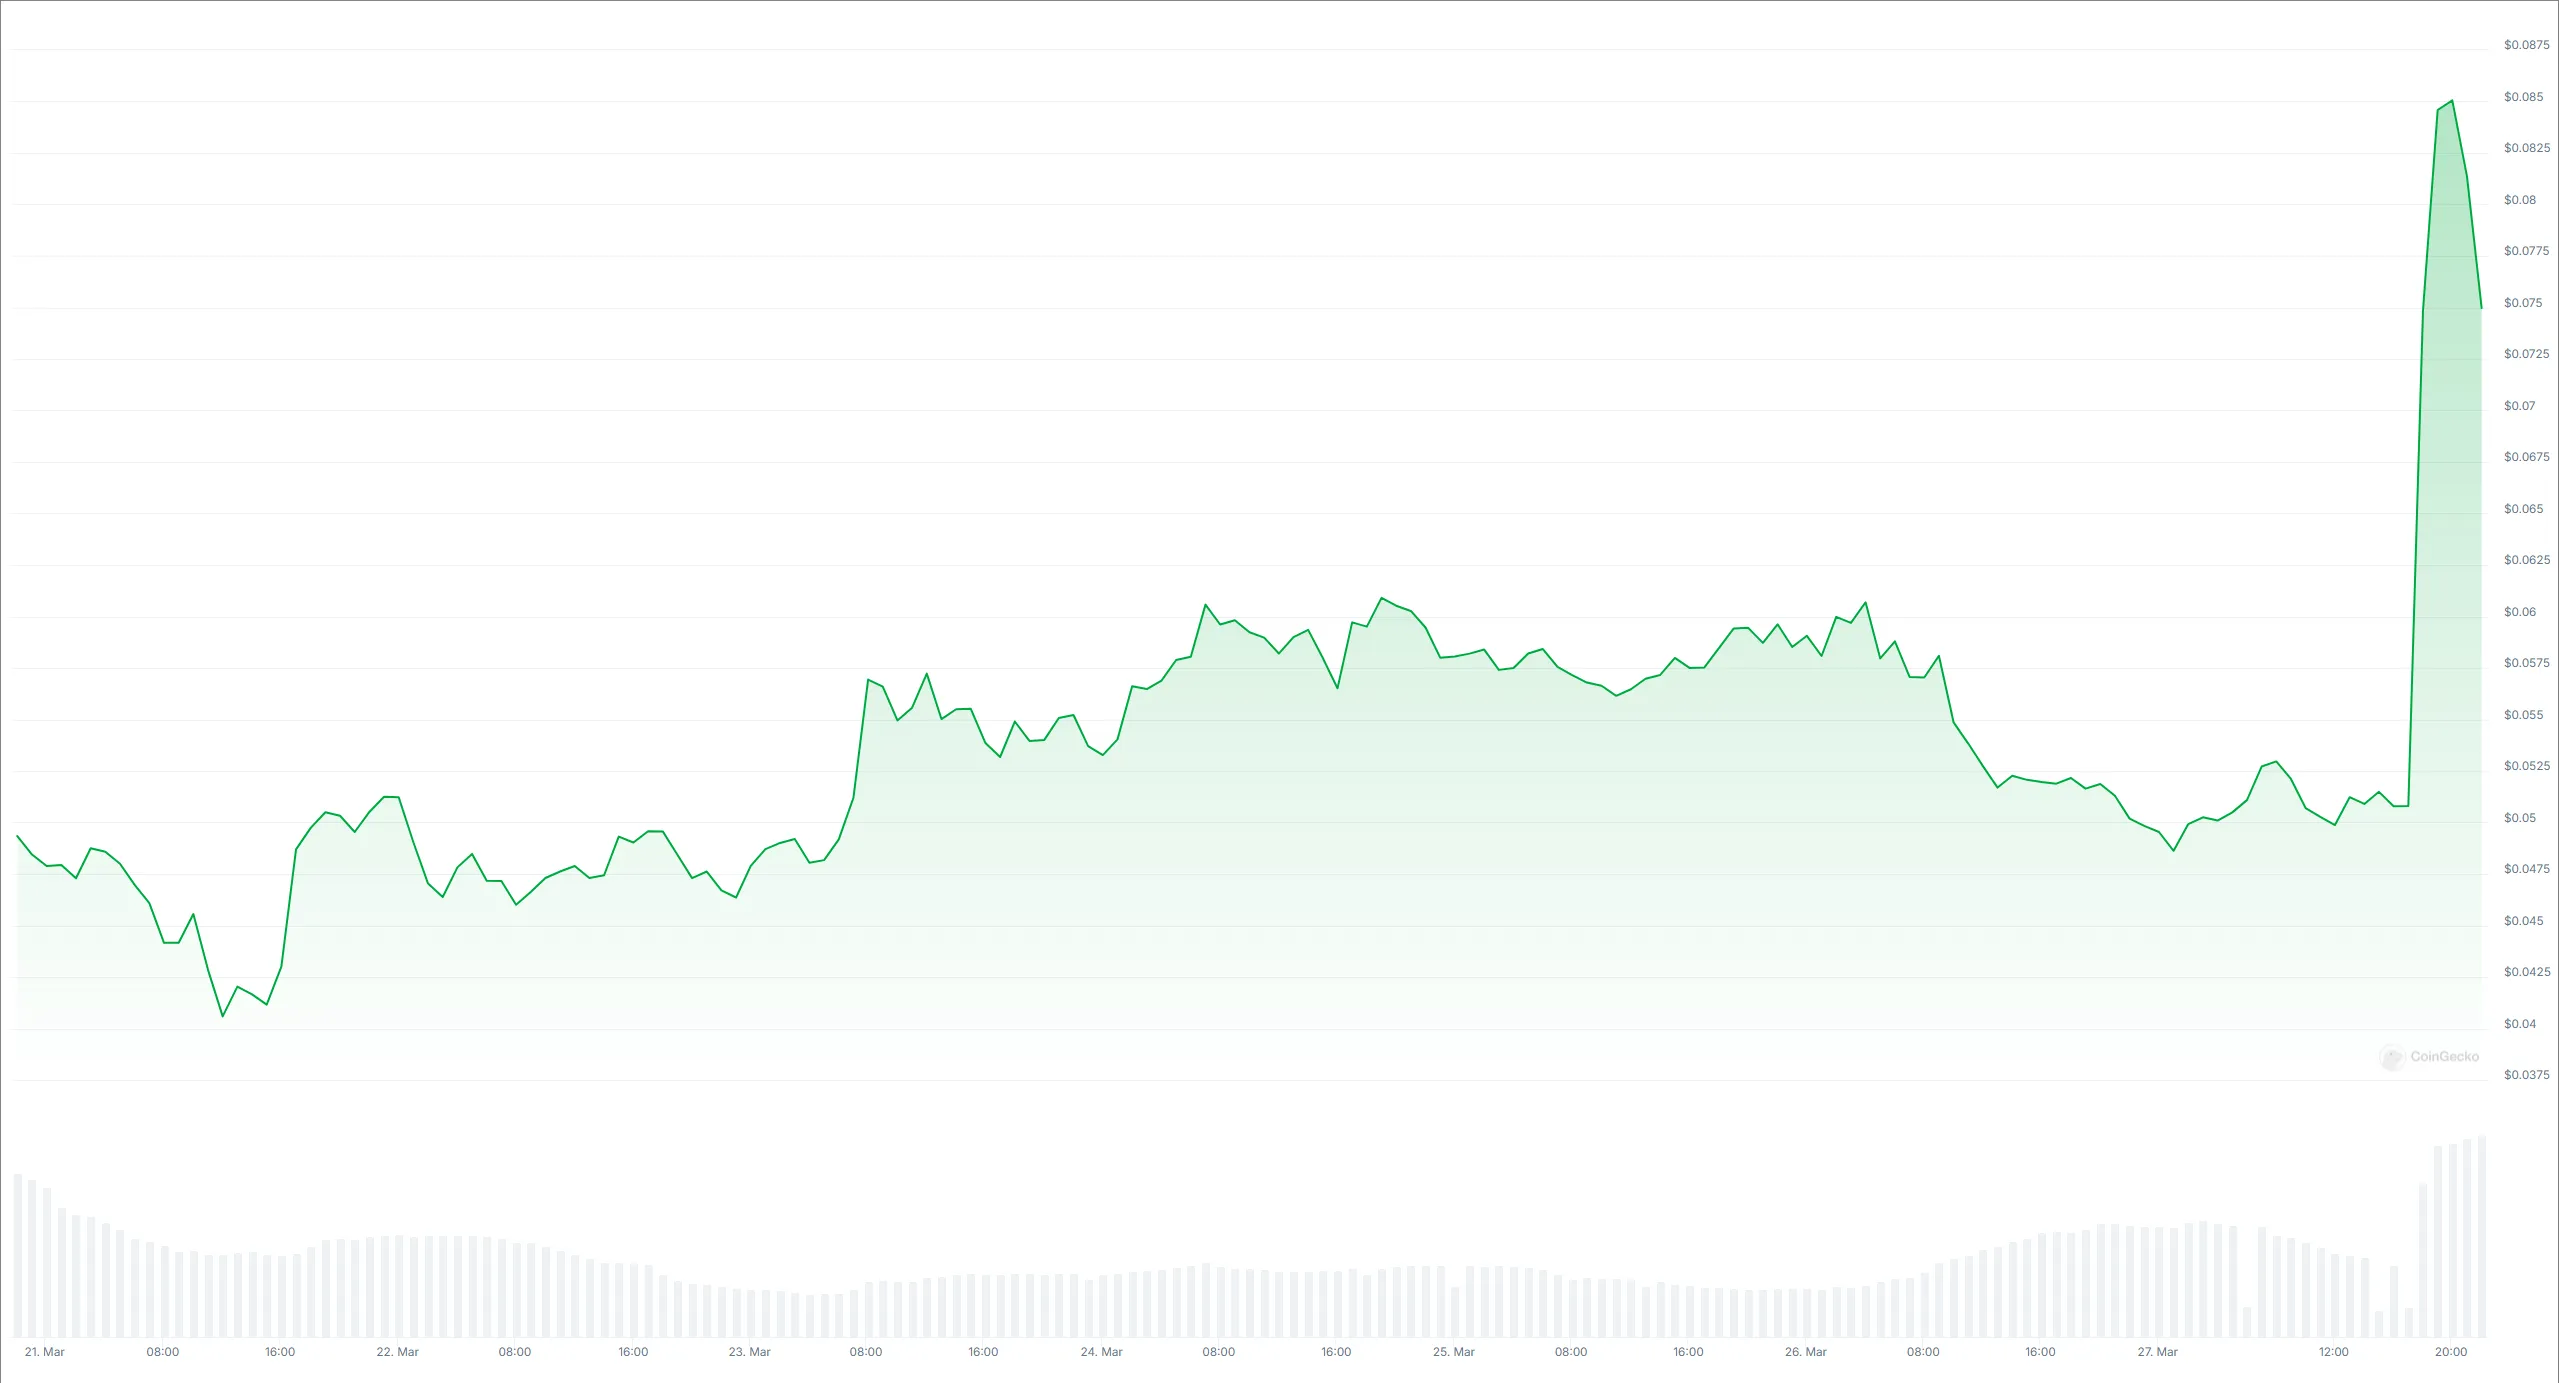
Movement Network (MOVE) has been gaining attention after announcing a $38 million buyback in response to improper activity by a Binance market maker. Despite the corrective phase that followed its sharp price spike, MOVE is still up over 13% in the last seven days.
Key indicators like RSI and DMI suggest that bullish momentum is cooling off. However, depending on market sentiment, a new trend could still develop.
Is MOVE Overbought in the Market?
MOVE’s Relative Strength Index (RSI) is currently at 56, down significantly from 83 just two days ago when its price experienced a sharp spike. That happened after the company behind it announced a $38 million buyback after discovering improper activity by a Binance market maker.
The RSI is a momentum oscillator that measures the speed and magnitude of price movements on a scale from 0 to 100.
Readings above 70 indicate overbought conditions that could lead to a pullback. Readings below 30 suggest oversold conditions that may precede a bounce. Values between 30 and 70 are considered neutral, with 50 acting as the midpoint.
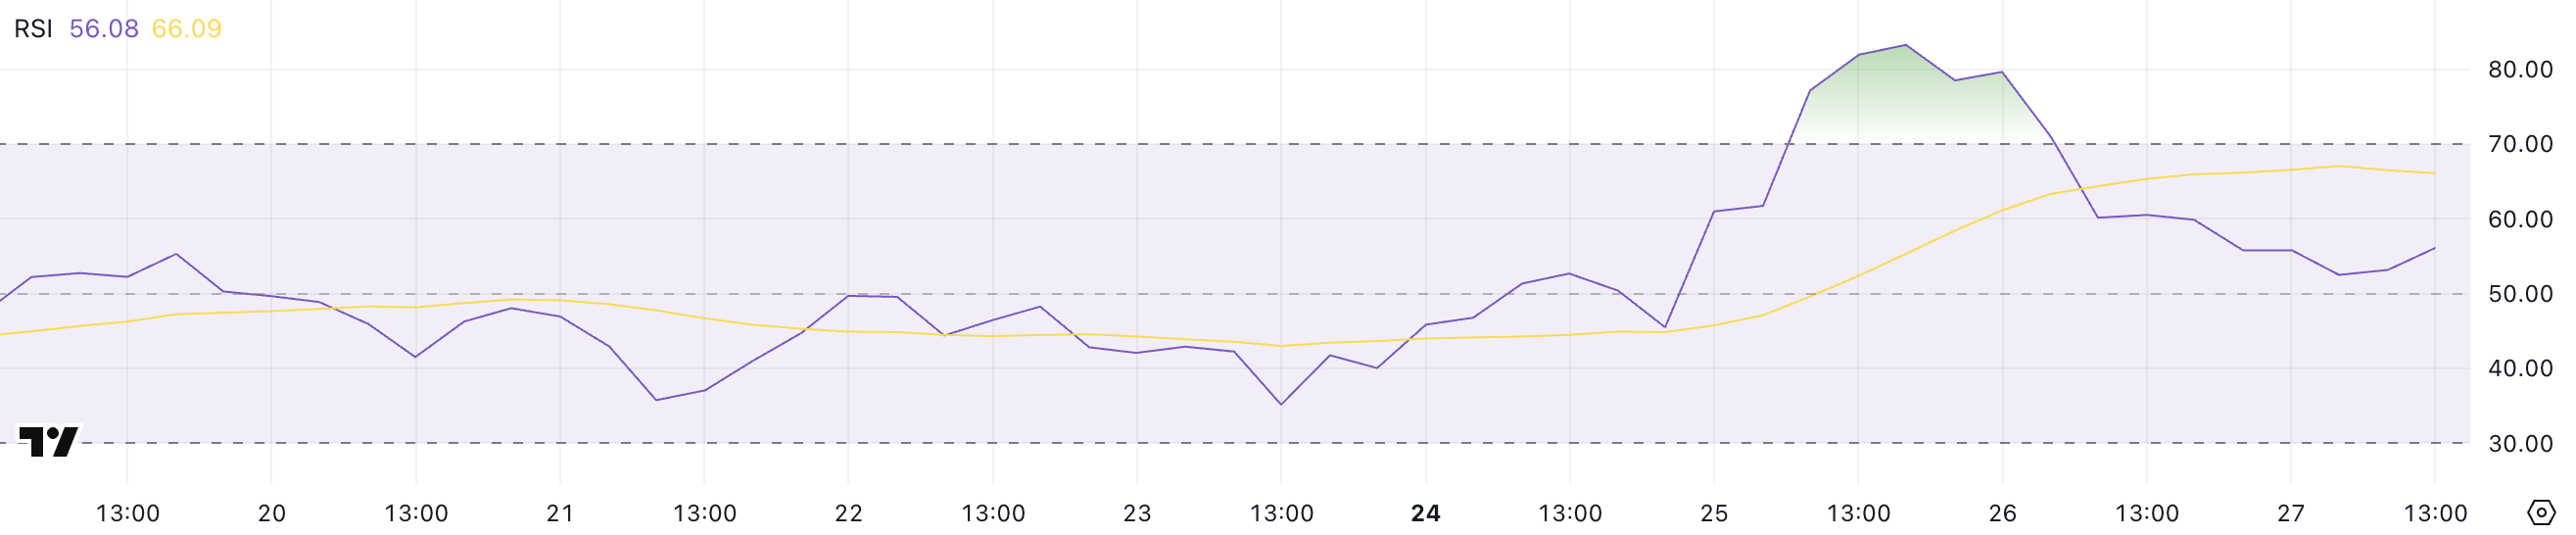
Prior to its recent surge, MOVE’s RSI hovered in the neutral zone for 23 consecutive days. That reflects a period of low momentum and price stability.
The sudden spike that pushed RSI into overbought territory was followed by this pullback to 56. That signals that the extreme bullish momentum is cooling off.
While 56 remains in neutral territory, it still leans slightly bullish and suggests that the altcoin may be consolidating before its next move. If buying interest returns, the current RSI level gives it room to push higher without being technically overbought.
Movement DMI Shows Buyers Could Lose Control In The Next Days
MOVE’s DMI chart shows that its Average Directional Index (ADX) is currently at 32.97, holding steady since yesterday after surging from just 9.74 two days ago.
The ADX is a key indicator used to measure the strength of a trend on a scale from 0 to 100. Readings below 20 suggest a weak or nonexistent trend. Values between 20 and 25 hint at a trend starting to form, and anything above 25 confirms a strong trend.
With MOVE’s ADX now firmly above 30, it signals that the recent price movement has established a solid trend.
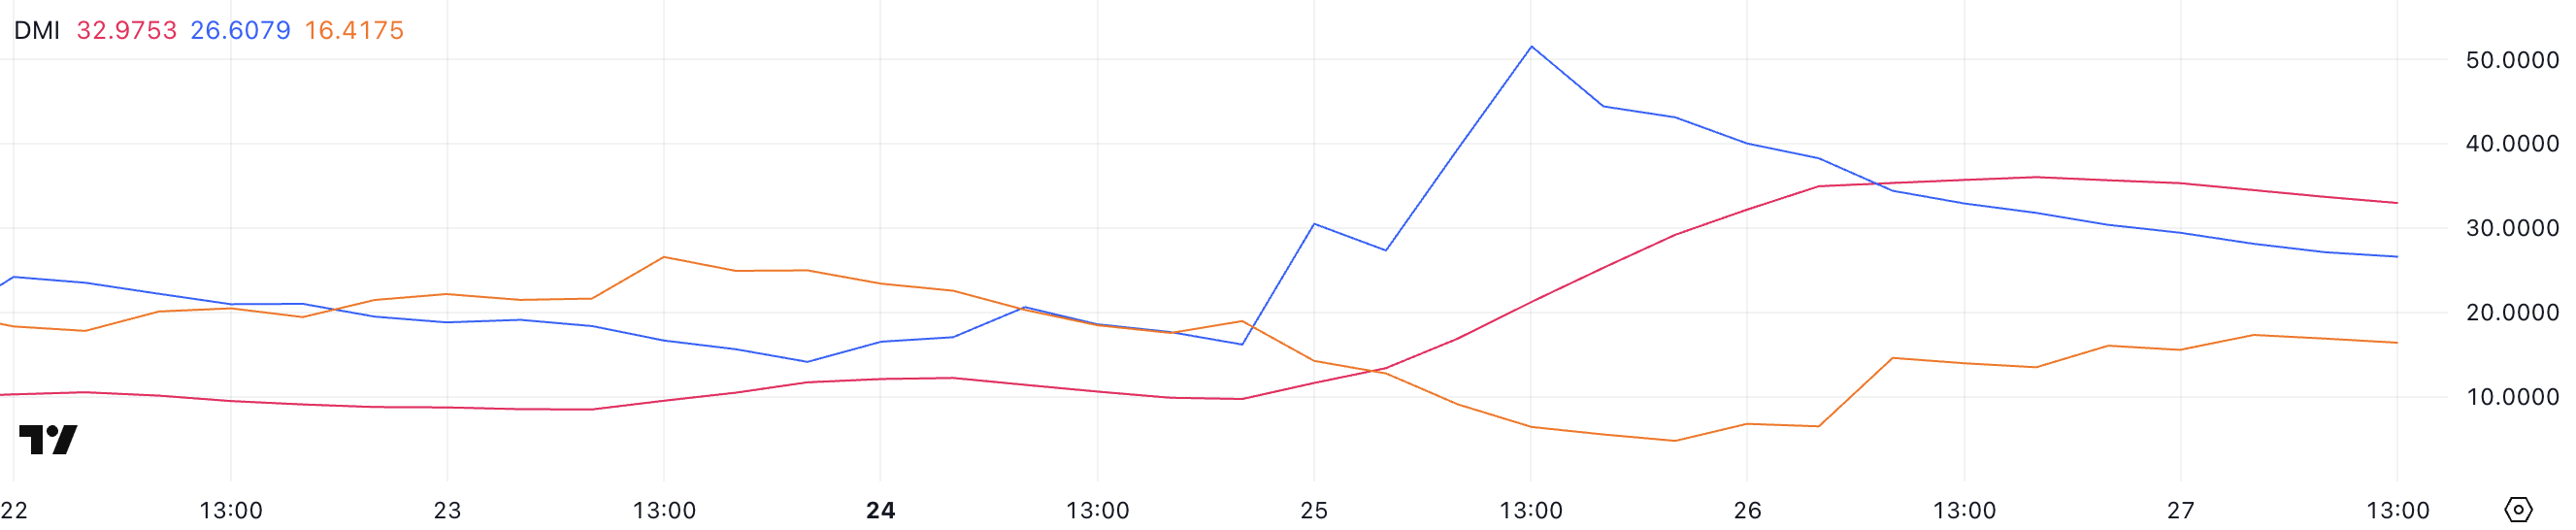
Alongside the ADX, the +DI (Positive Directional Indicator) and -DI (Negative Directional Indicator) offer insight into the direction of that trend.
Currently, +DI is at 26.6, falling from 51 two days ago. On the other hand, -DI has climbed to 16.41 from 6.43 in the same period.
This indicates that bullish momentum has cooled off after the recent surge, while bearish pressure is gradually increasing. Despite the strong trend strength indicated by the ADX, the shrinking gap between +DI and -DI suggests that the bullish momentum is fading. That means the trend may be weakening or transitioning.
Based on these indicators, MOVE could now enter a period of consolidation or face a pullback unless new buying pressure emerges.
Will MOVE Drop Below $0.40 In April?
Following its sharp 30% price surge on March 25, which made it one of the best-performing altcoins of that day, MOVE has entered a corrective phase. The altcoin is now trading 11% below its recent peak.
This kind of pullback is not uncommon after such an aggressive move, as traders take profits and momentum cools off. The ongoing correction focuses on several key support levels—$0.479 is the first.
If that level fails to hold, MOVE could decline further toward $0.433 and $0.409. Also, a deeper drop toward $0.37 is possible if bearish momentum extends into April.
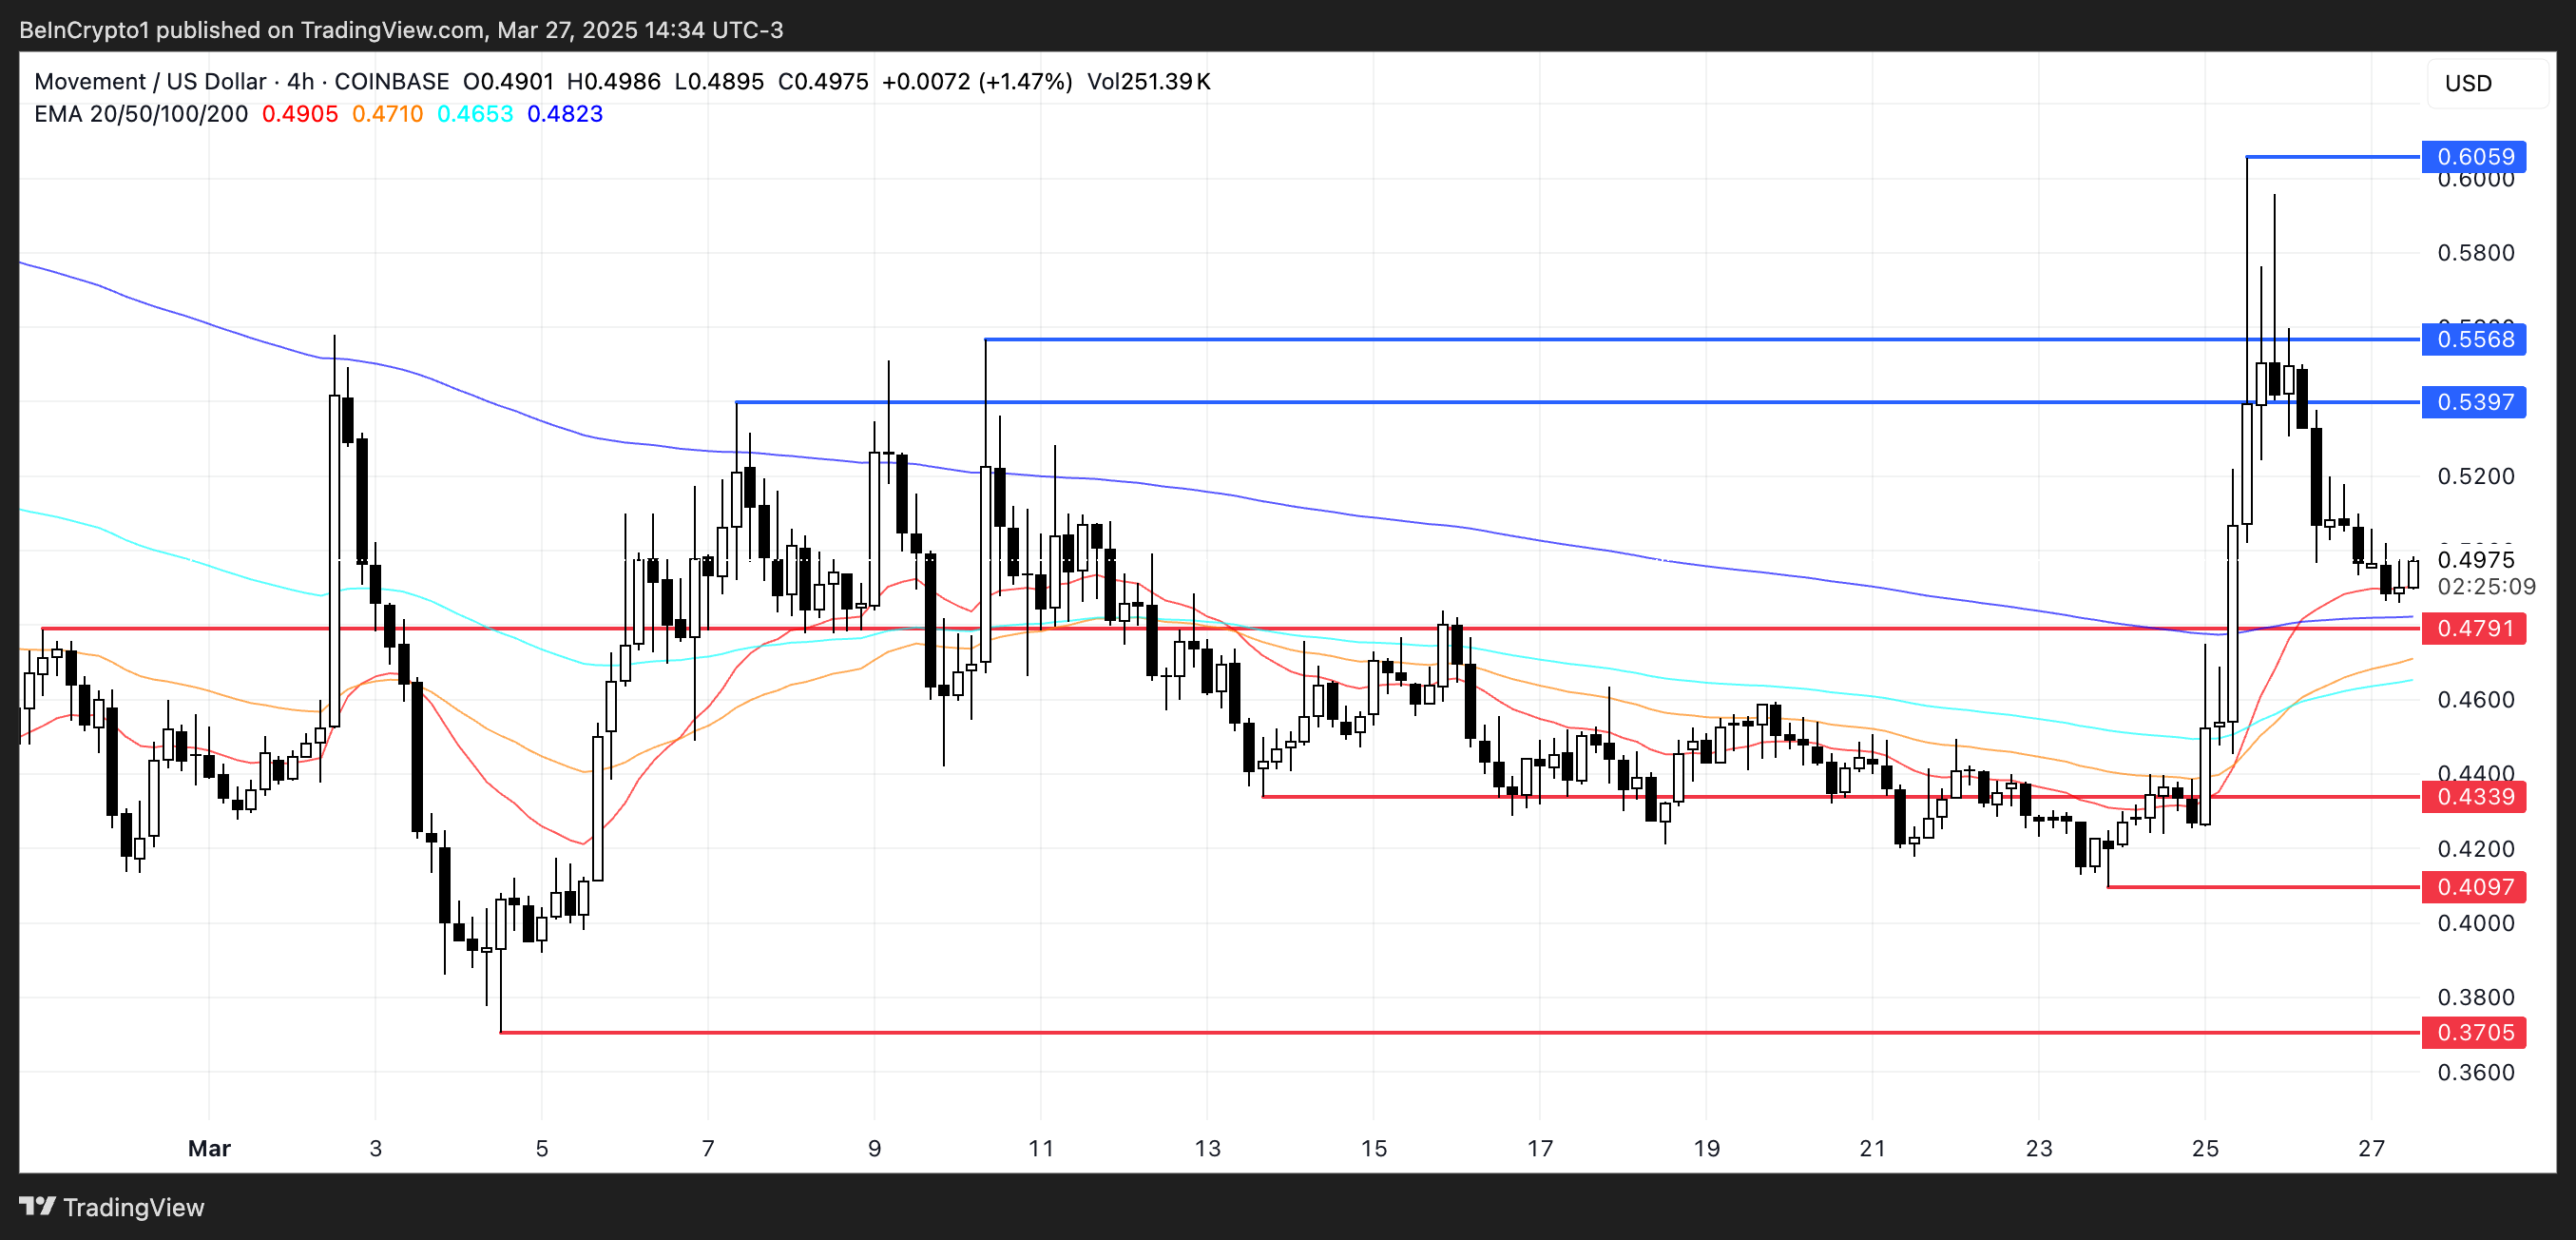
However, if sentiment around the MOVE ecosystem improves and confidence returns, the current pullback could be short-lived.
A rebound could see MOVE retest the resistance at $0.539. A successful breakout above that could open the path to $0.55, which wasn’t broken yesterday, and even $0.60.
Disclaimer
In line with the Trust Project guidelines, this price analysis article is for informational purposes only and should not be considered financial or investment advice. BeInCrypto is committed to accurate, unbiased reporting, but market conditions are subject to change without notice. Always conduct your own research and consult with a professional before making any financial decisions. Please note that our Terms and Conditions, Privacy Policy, and Disclaimers have been updated.

Bitcoin Bet Grows Bigger: The Blockchain Group Snaps Up 580 BTC
Analyst Reveals Why The XRP Price Will Dominate Bitcoin & Ethereum

Onyxcoin (XCN) Nears Oversold After a 30% Monthly Drop

Binance Announces Vote To List Results, Set To List MUBARAK, BROCCOLI, TUT, BANANA
Binance To List MUBARAK, BROCCOLI, BANANAS31, and Tutorial

Dogecoin Price Prediction: Here’s What Needs To Happen For DOGE To Recover Above $0.3

2.52 Million Altcoins Are Ruining Crypto’s Future

Animoca Brands Valuation Tanks 75% In Two Years, Here’s Why

Crypto exchange BingX hacked for $43 million

Are The Big Players Losing Interest?

Hong Kong’s Securities Association Tips Authorities On Crypto Self-Regulation

Coinbase cbBTC Set to go Live on Solana
2.52 Million Altcoins Are Ruining Crypto’s Future
Animoca Brands Valuation Tanks 75% In Two Years, Here’s Why
Crypto exchange BingX hacked for $43 million
Are The Big Players Losing Interest?
Hong Kong’s Securities Association Tips Authorities On Crypto Self-Regulation
Coinbase cbBTC Set to go Live on Solana
-

 Market21 hours ago
Bitcoin Price Finds Support—But Can It Power Through $90K?
-

 Market24 hours ago
Bitcoin (BTC) Looks to Reclaim $100,000 In April as Whales Surge
-

 Altcoin23 hours ago
Dogecoin Price Bullish Breakout Aims For $0.8 ATH This Cycle
-

 Market23 hours ago
Mantra (OM) Price Risks Further Drop as Death Cross Nears
-
 Altcoin22 hours ago
Crypto Price Today: BTC, ETH, SOL, XRP, SHIB, DOGE, LINK, PEPE, ADA
-
 Market22 hours ago
Top 3 Base Altcoins to Watch Closely This Week
-

 Market20 hours ago
Pi Network Price Falls Further Below $1 Amid High Sell-Off
-

 Market19 hours ago
Ethereum Price Consolidates After Pullback—Is a Fresh Move Coming?