
Market
3 Bullish Altcoins Surging After Trump’s Tariff Pause

Altcoins are showing fresh signs of life following Trump’s 90-day tariff pause, and three names in particular—XRP, HYPE, and ONDO—are catching investor attention.
Each has its own catalyst: XRP is getting a regulatory boost with Paul Atkins taking over the SEC, HYPE is defying the broader market downturn with impressive protocol revenue, and ONDO is riding the wave of rising institutional interest in Real-World Assets (RWA).
XRP
XRP fell sharply in the past month, losing 34% and dropping below $1.70 for the first time since November 2024. The decline came as macro uncertainty and regulatory pressure weighed on sentiment.
However, with Trump’s 90-day tariff pause and Paul Atkins confirmed as the new, pro-crypto SEC Chair, optimism is starting to return.
These developments could give XRP the regulatory breathing room it needs to regain momentum as one of the top-performing altcoins.
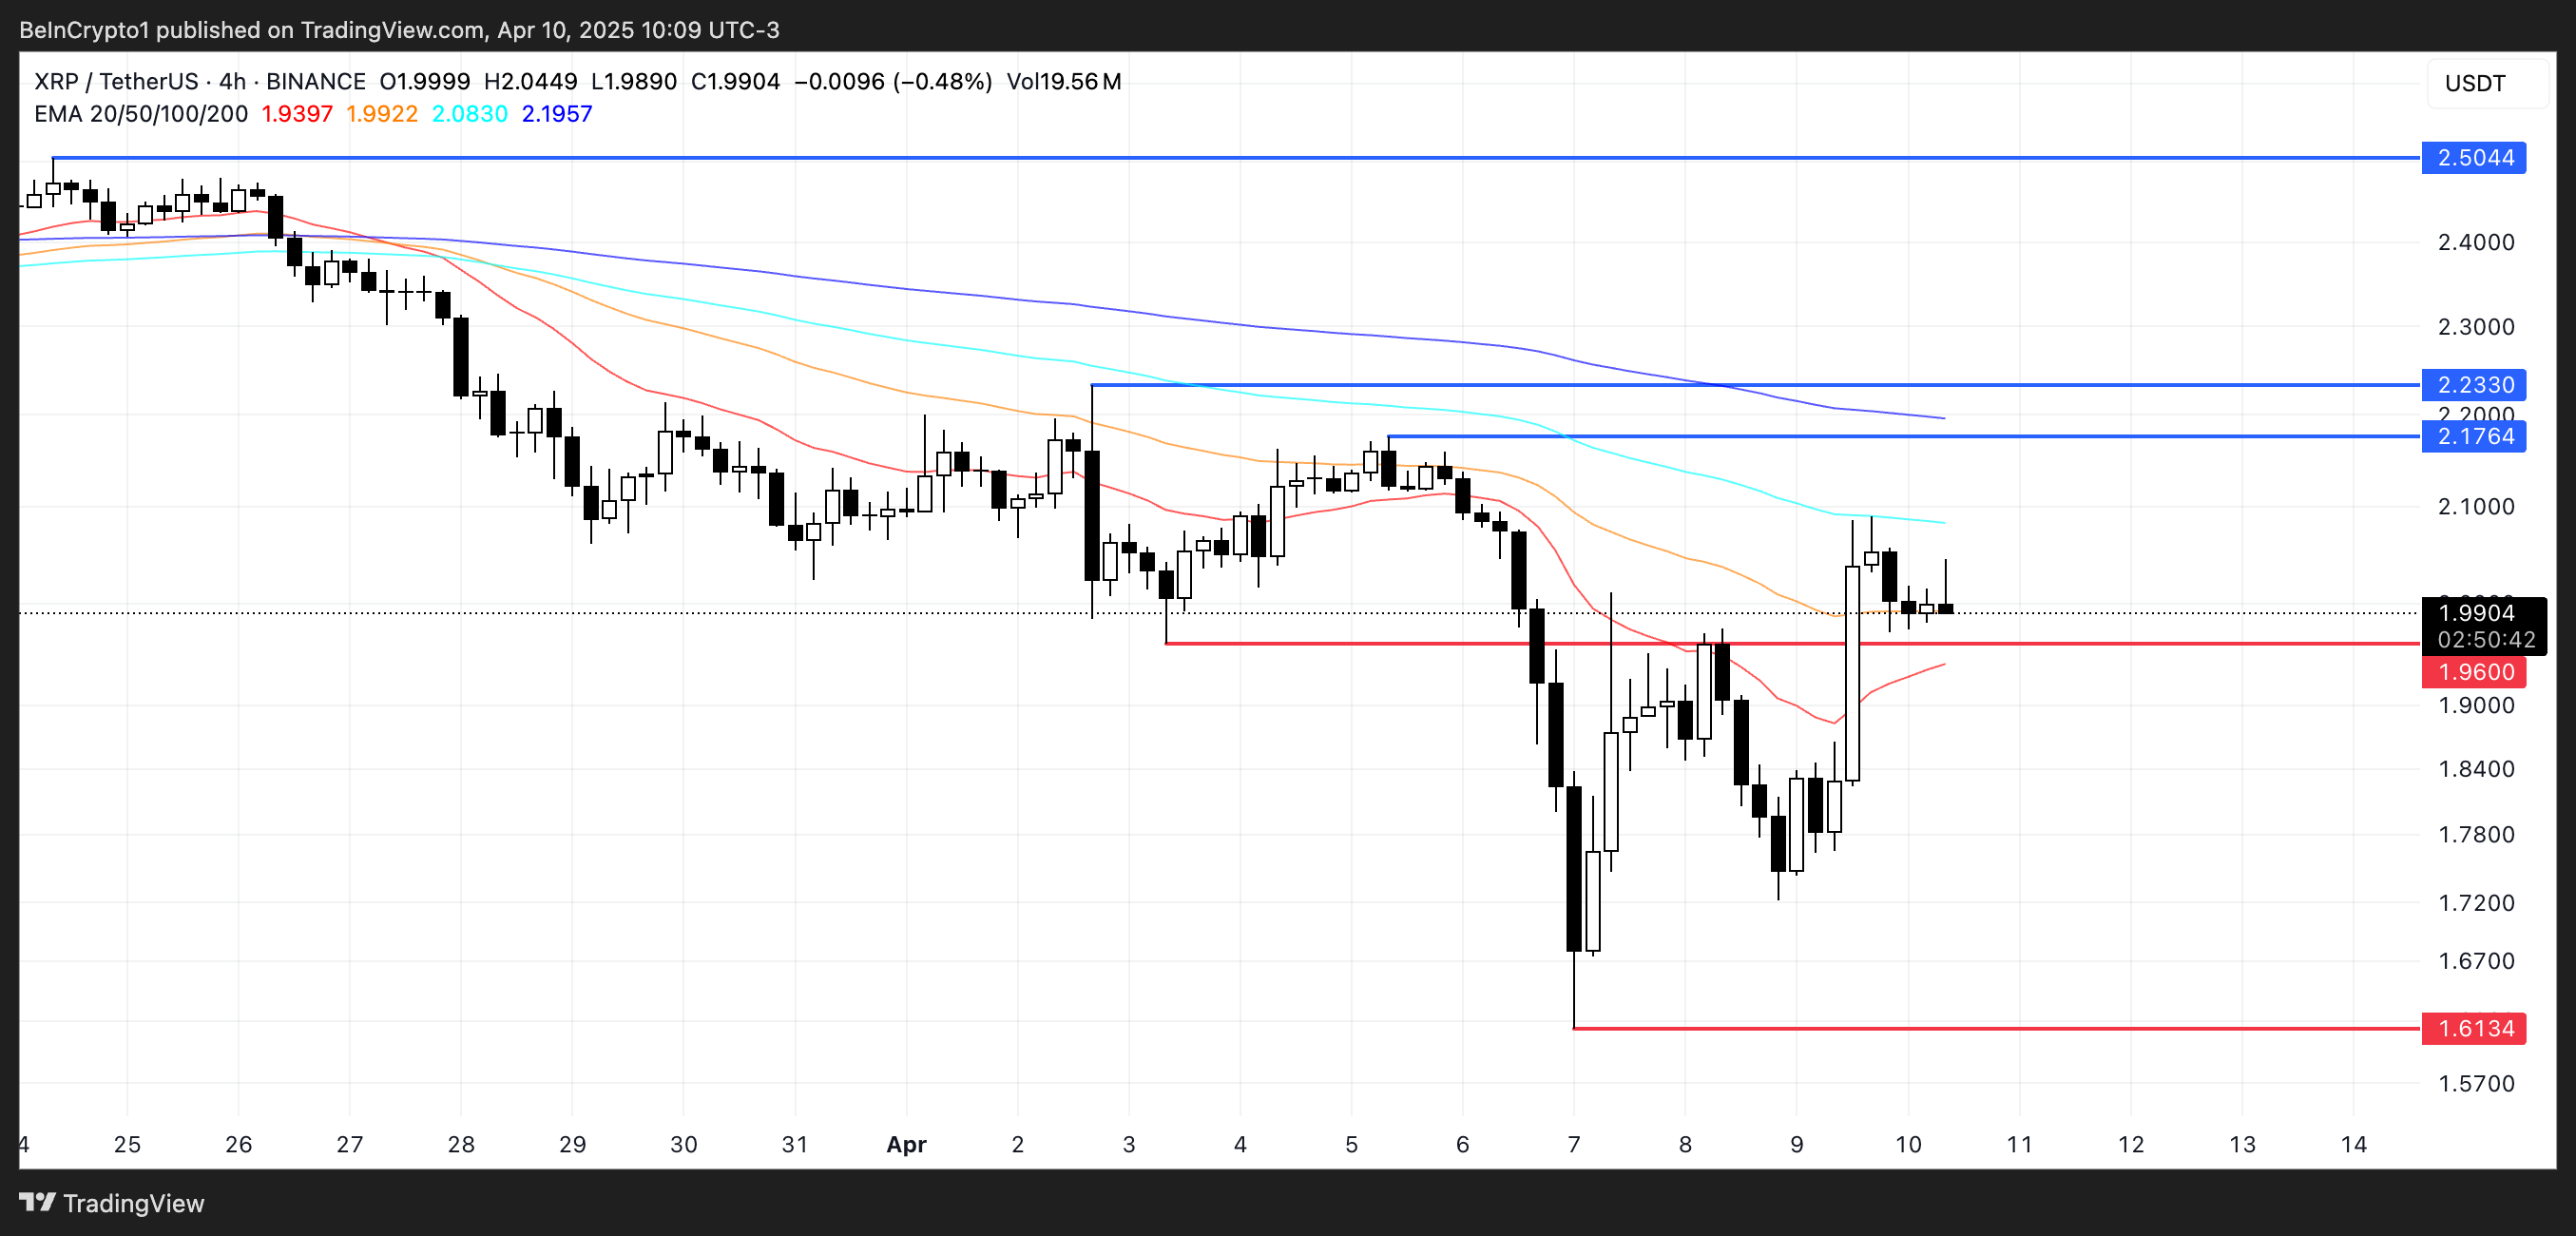
If that shift materializes, XRP may retest resistance at $2.17 and $2.23.
A break above those levels could set the stage for a push toward $2.50. Standard Chartered has even suggested XRP could overtake Ethereum by 2028, and Ripple’s acquisition of Hidden Road has fueled new expectations for rising institutional demand.
Still, holding $1.96 as support is key—if that level fails, a drop back toward sub-$1.70 lows remains possible.
Hyperliquid (HYPE)
HYPE has climbed 21.5% over the past week, defying the broader altcoin market downturn. The rally comes despite lingering criticism of the platform following the JELLY crisis, which raised concerns about Hyperliquid’s stability.
Still, traders seem to be regaining confidence, especially as the macro backdrop improves after Trump’s 90-day tariff pause.
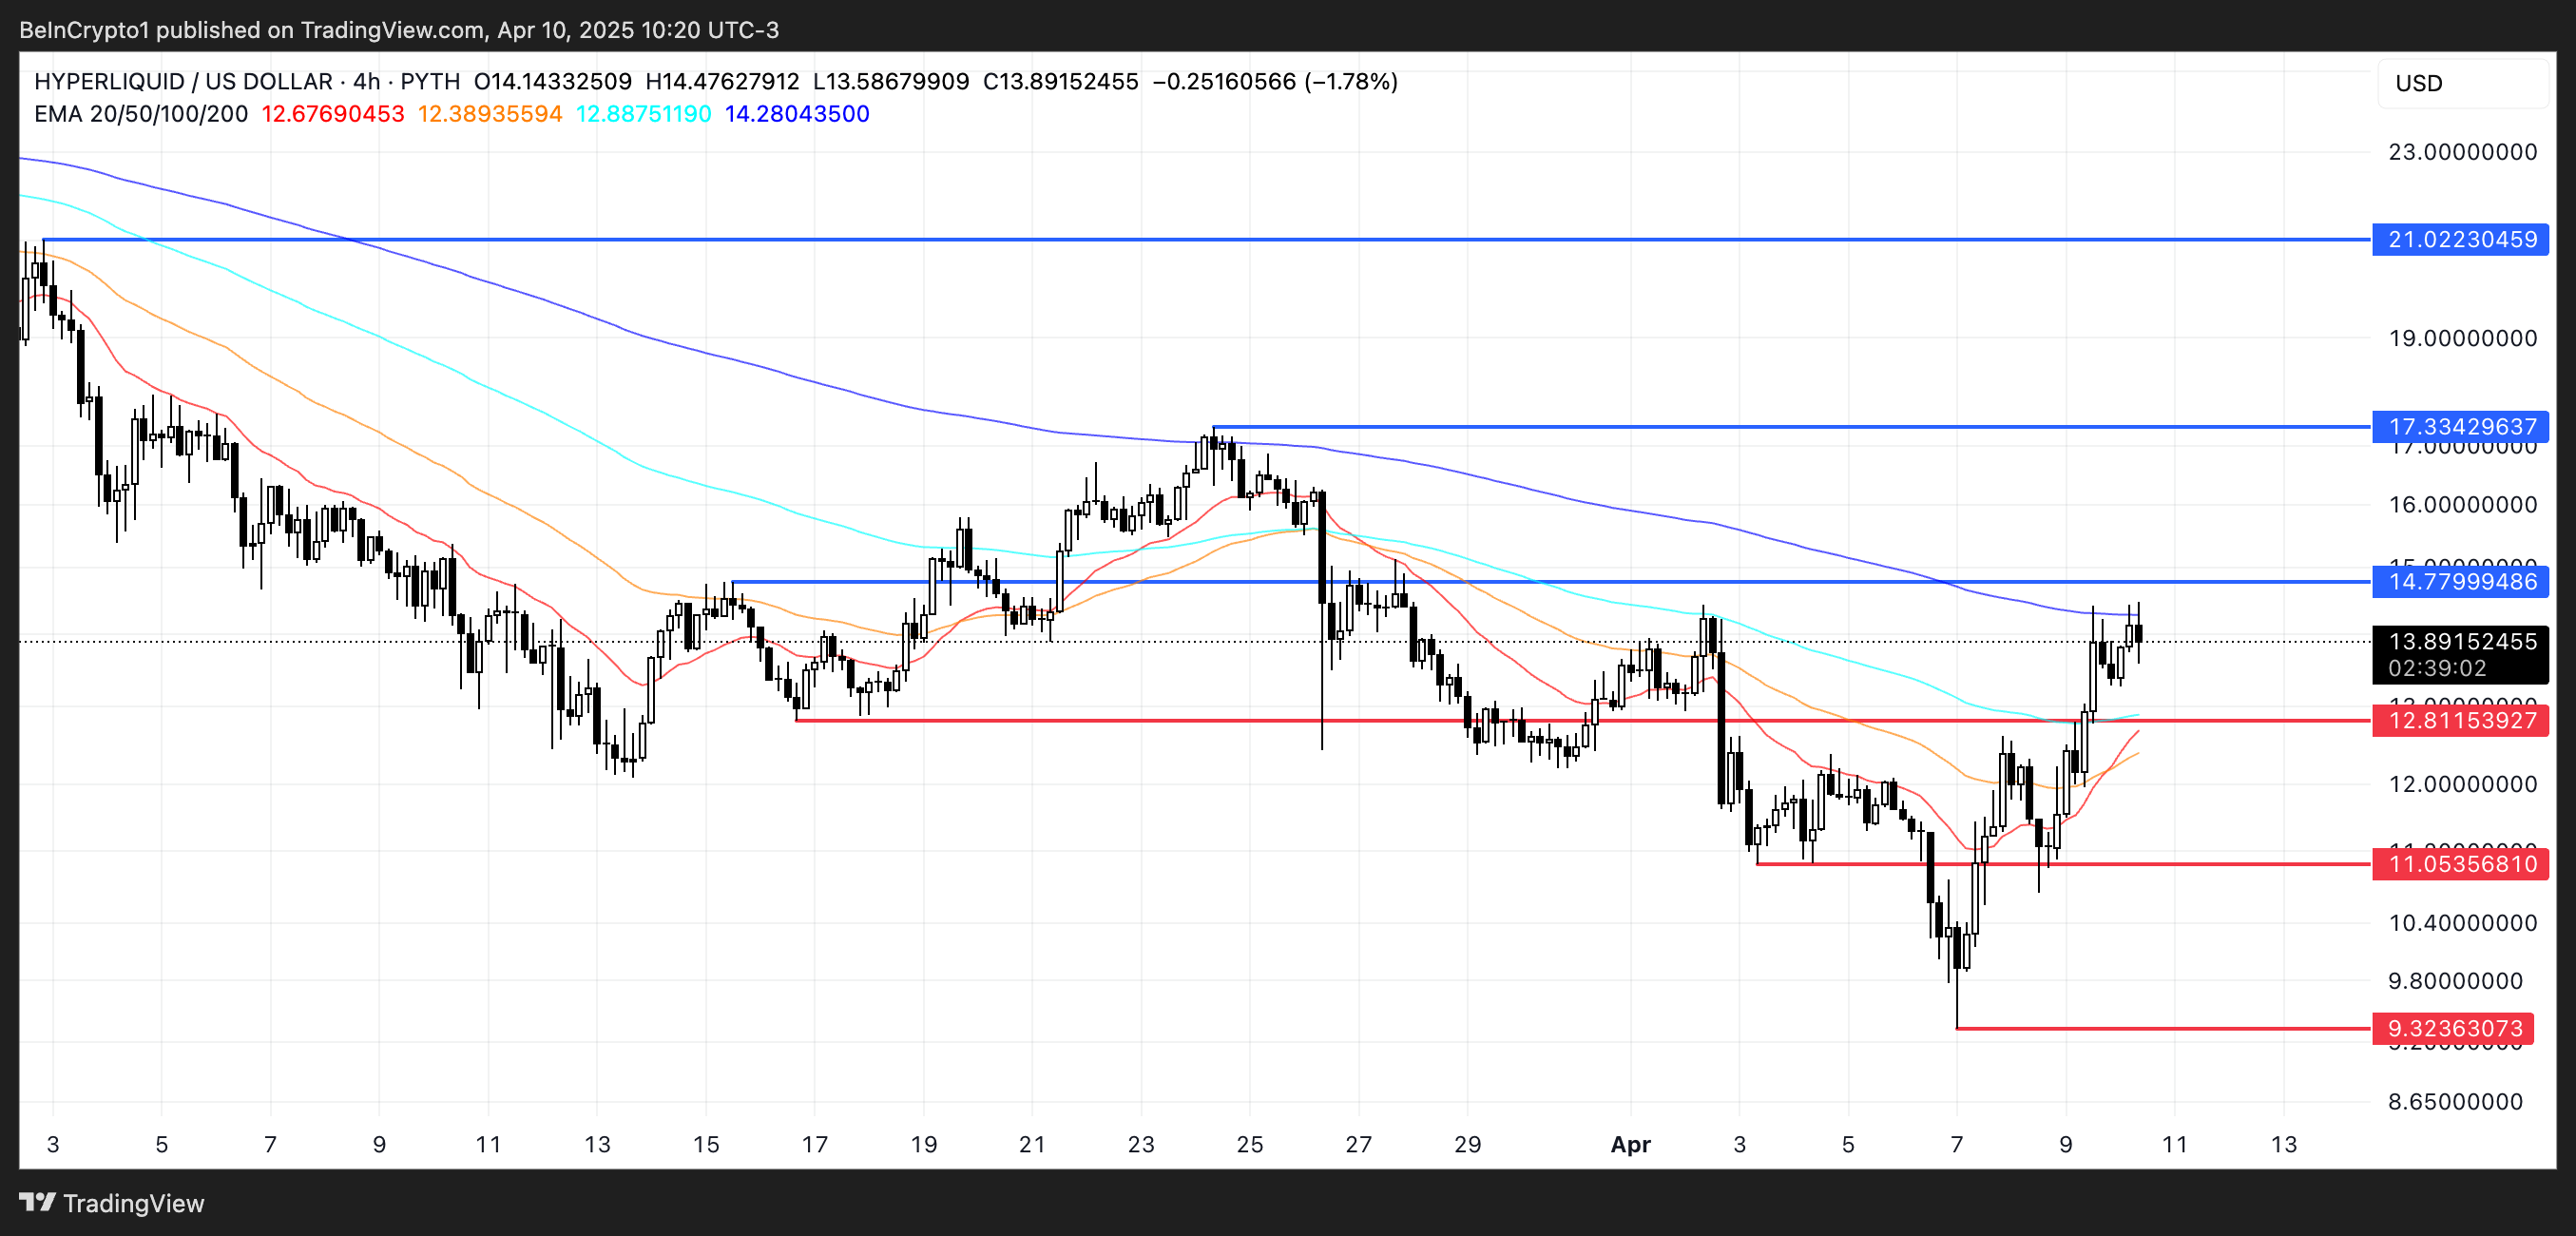
Hyperliquid remains a powerhouse in terms of protocol revenue, pulling in $38 million in fees over the past month—$2.4 million of that in just the last 24 hours—ranking it 6th globally, ahead of names like PancakeSwap and Tron.
If momentum holds, HYPE could push toward resistance at $14.77, and a breakout could lead to $17.33 or even $21. But if the rally stalls support at $12.81 becomes key; losing that could send the price back to $11 or even below $10 in a deeper correction
Ondo Finance (ONDO)
Real-world asset (RWA) tokens are gaining momentum as a defensive narrative in crypto, especially in light of global economic uncertainty.
Binance Research recently stated that RWA altcoins remain safer than Bitcoin during tariff-driven volatility.
At the same time, BlackRock’s BUIDL token is nearing $1.5 billion in assets, and Fidelity has entered the RWA tokenization race—signaling growing institutional commitment to this emerging sector.
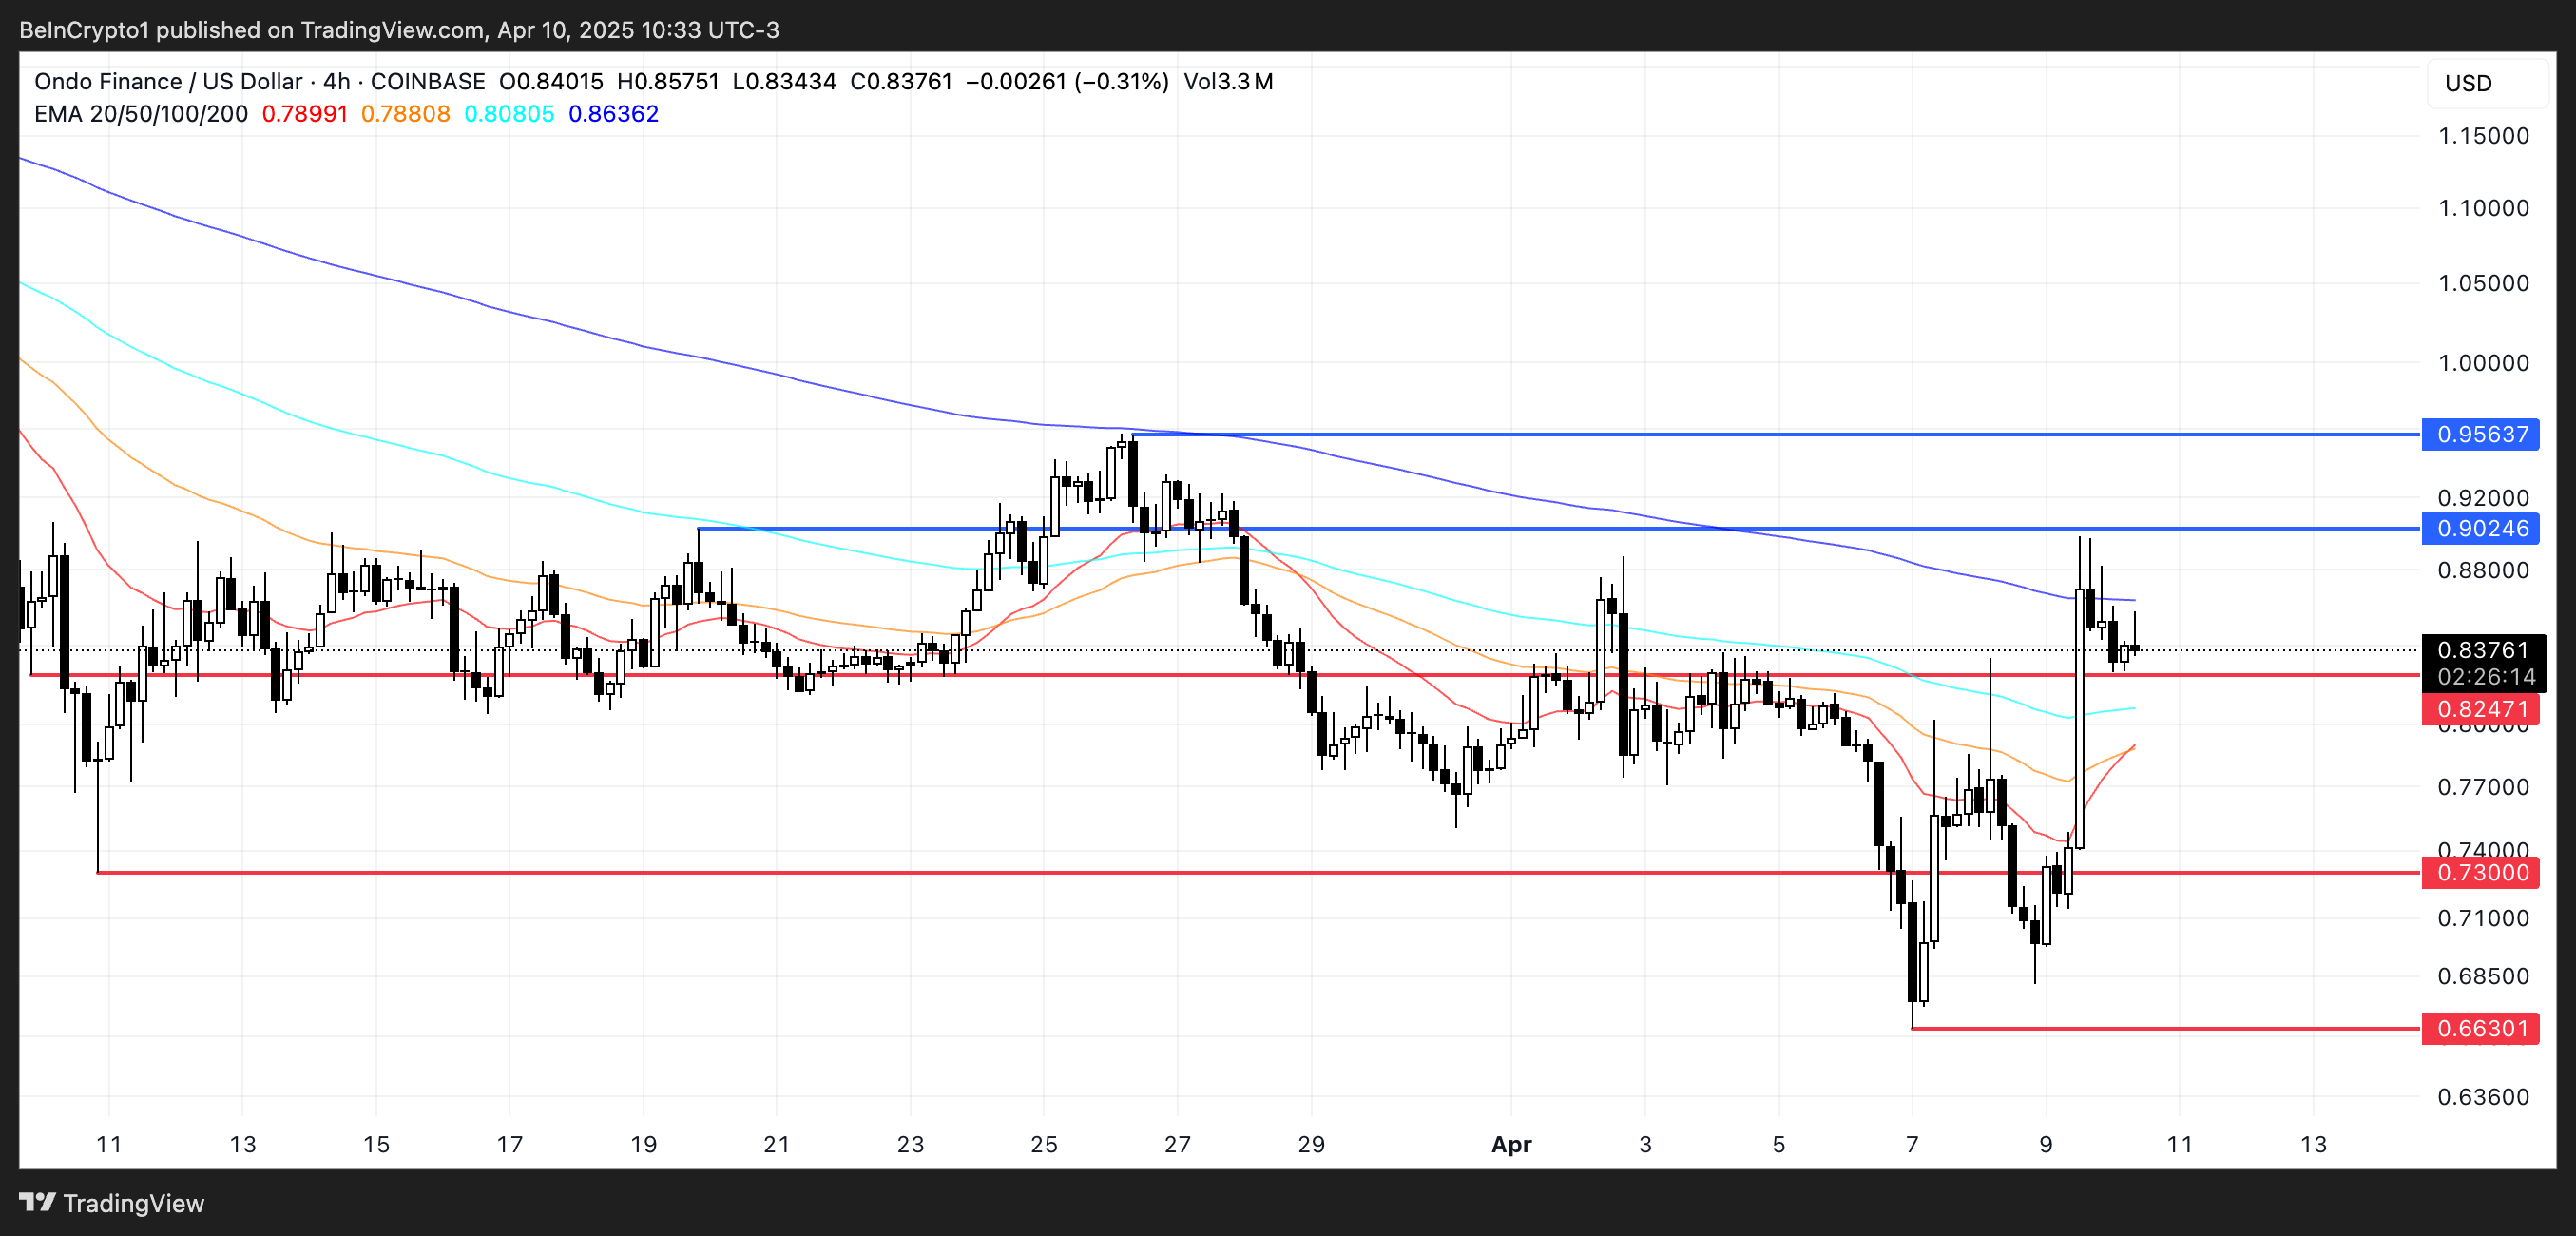
ONDO, one of the key tokens in the RWA space, is showing signs of strength on the charts, with a golden cross nearly forming.
If confirmed, ONDO could climb toward resistance levels at $0.90 and $0.95, with a breakout possibly pushing it above $1.
However, the price is hovering just above a key support at $0.82. If that level fails, the next downside target is $0.73, with a deeper slide potentially taking it below $0.70.
Disclaimer
In line with the Trust Project guidelines, this price analysis article is for informational purposes only and should not be considered financial or investment advice. BeInCrypto is committed to accurate, unbiased reporting, but market conditions are subject to change without notice. Always conduct your own research and consult with a professional before making any financial decisions. Please note that our Terms and Conditions, Privacy Policy, and Disclaimers have been updated.


Bitcoin’s price continues to struggle below the psychological $85,000 mark, failing to break past this critical level over the past two months.
Despite some attempts to secure a rise, the leading cryptocurrency has remained stagnant, increasing pressure on long-term holders (LTHs). These investors, once enjoying solid profits, are now seeing a decline in their unrealized gains.
Bitcoin Investors Are Pulling Back
The MVRV Long/Short Difference, a key metric used to gauge market sentiment, reveals a concerning trend for LTHs. The indicator recently hit a two-year low, suggesting that long-term holders’ profits are at their lowest since March 2023. This shift indicates that the market conditions are increasingly unfavorable for LTHs.
As Bitcoin’s price fails to recover, short-term holders (STHs) are beginning to dominate, capitalizing on the price fluctuations. Meanwhile, long-term holders (LTHs), facing diminishing profits, hold off on buying or holding more.
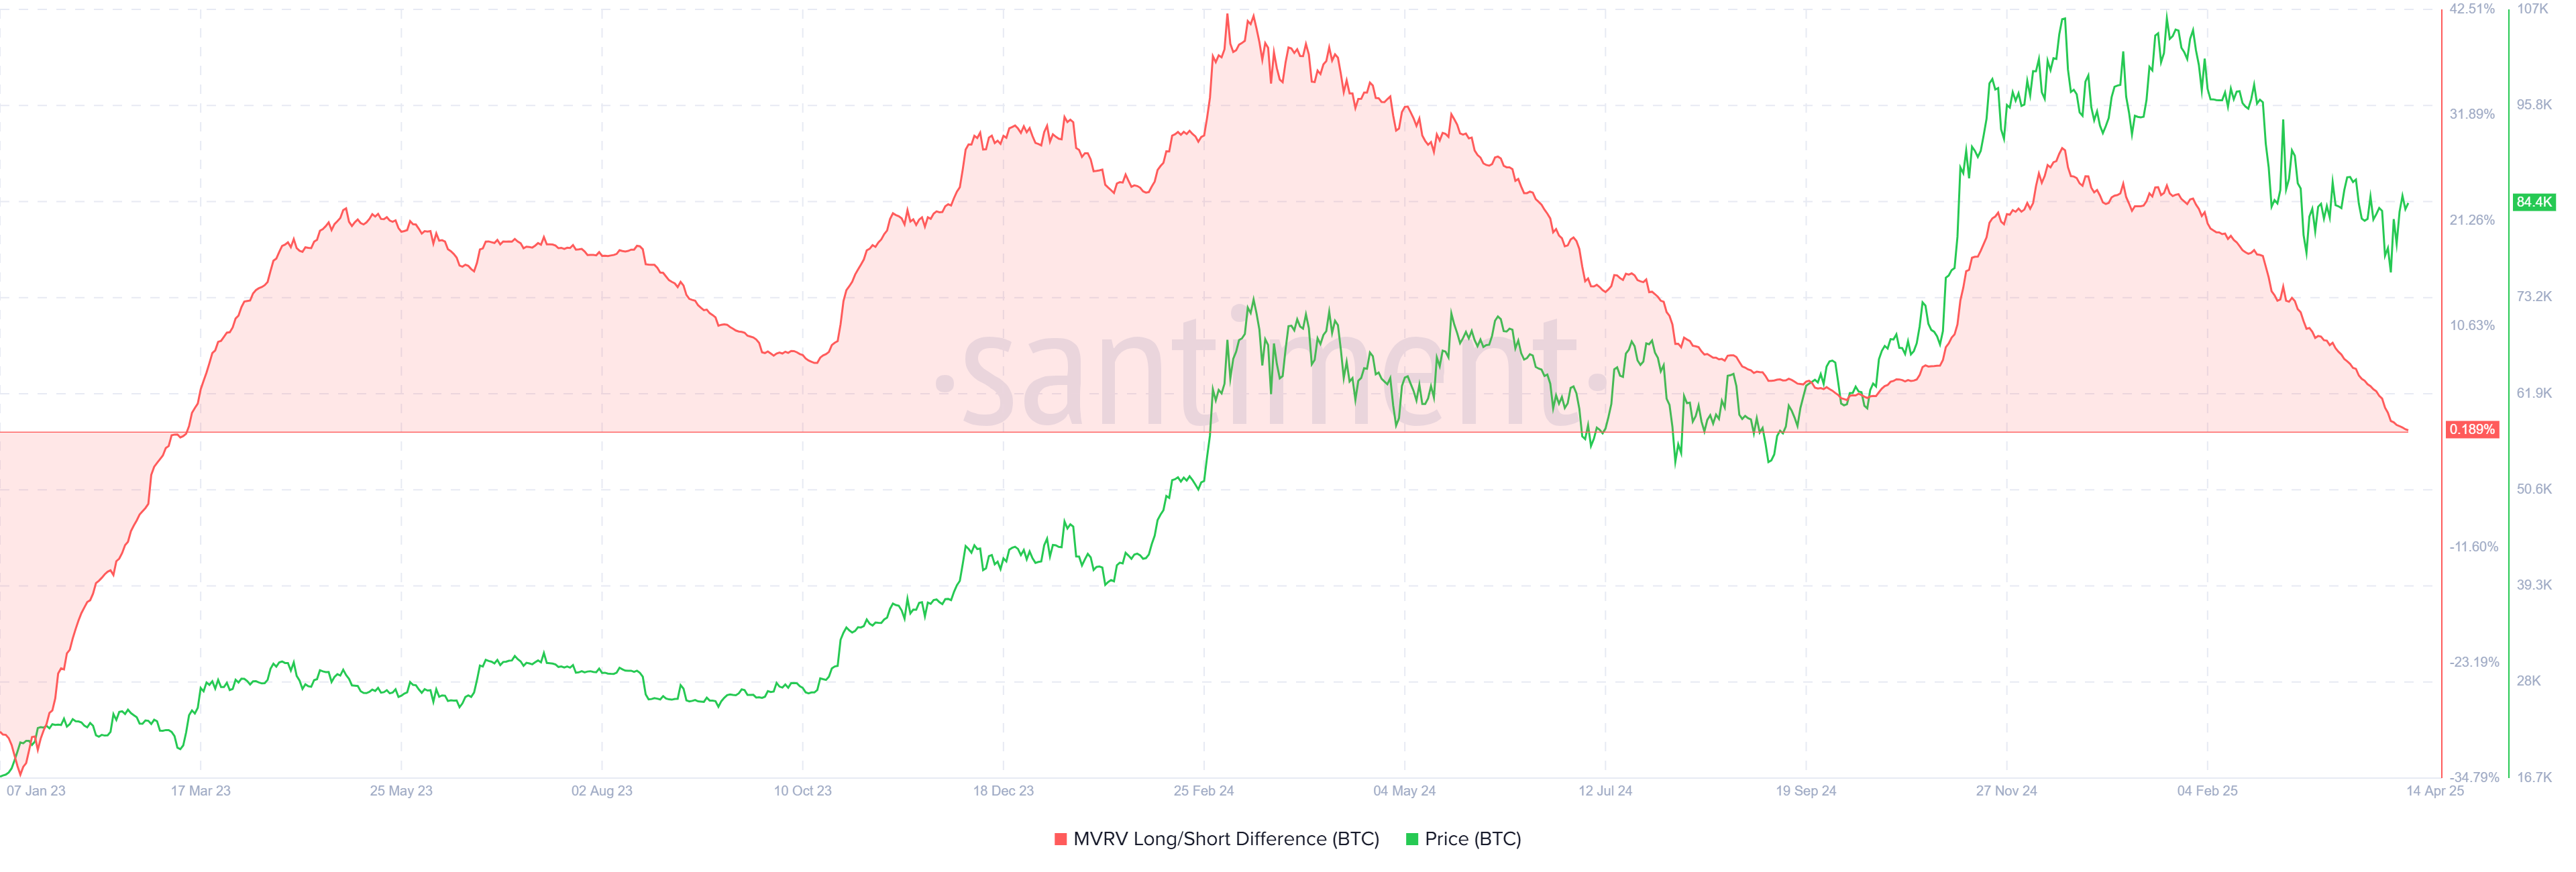
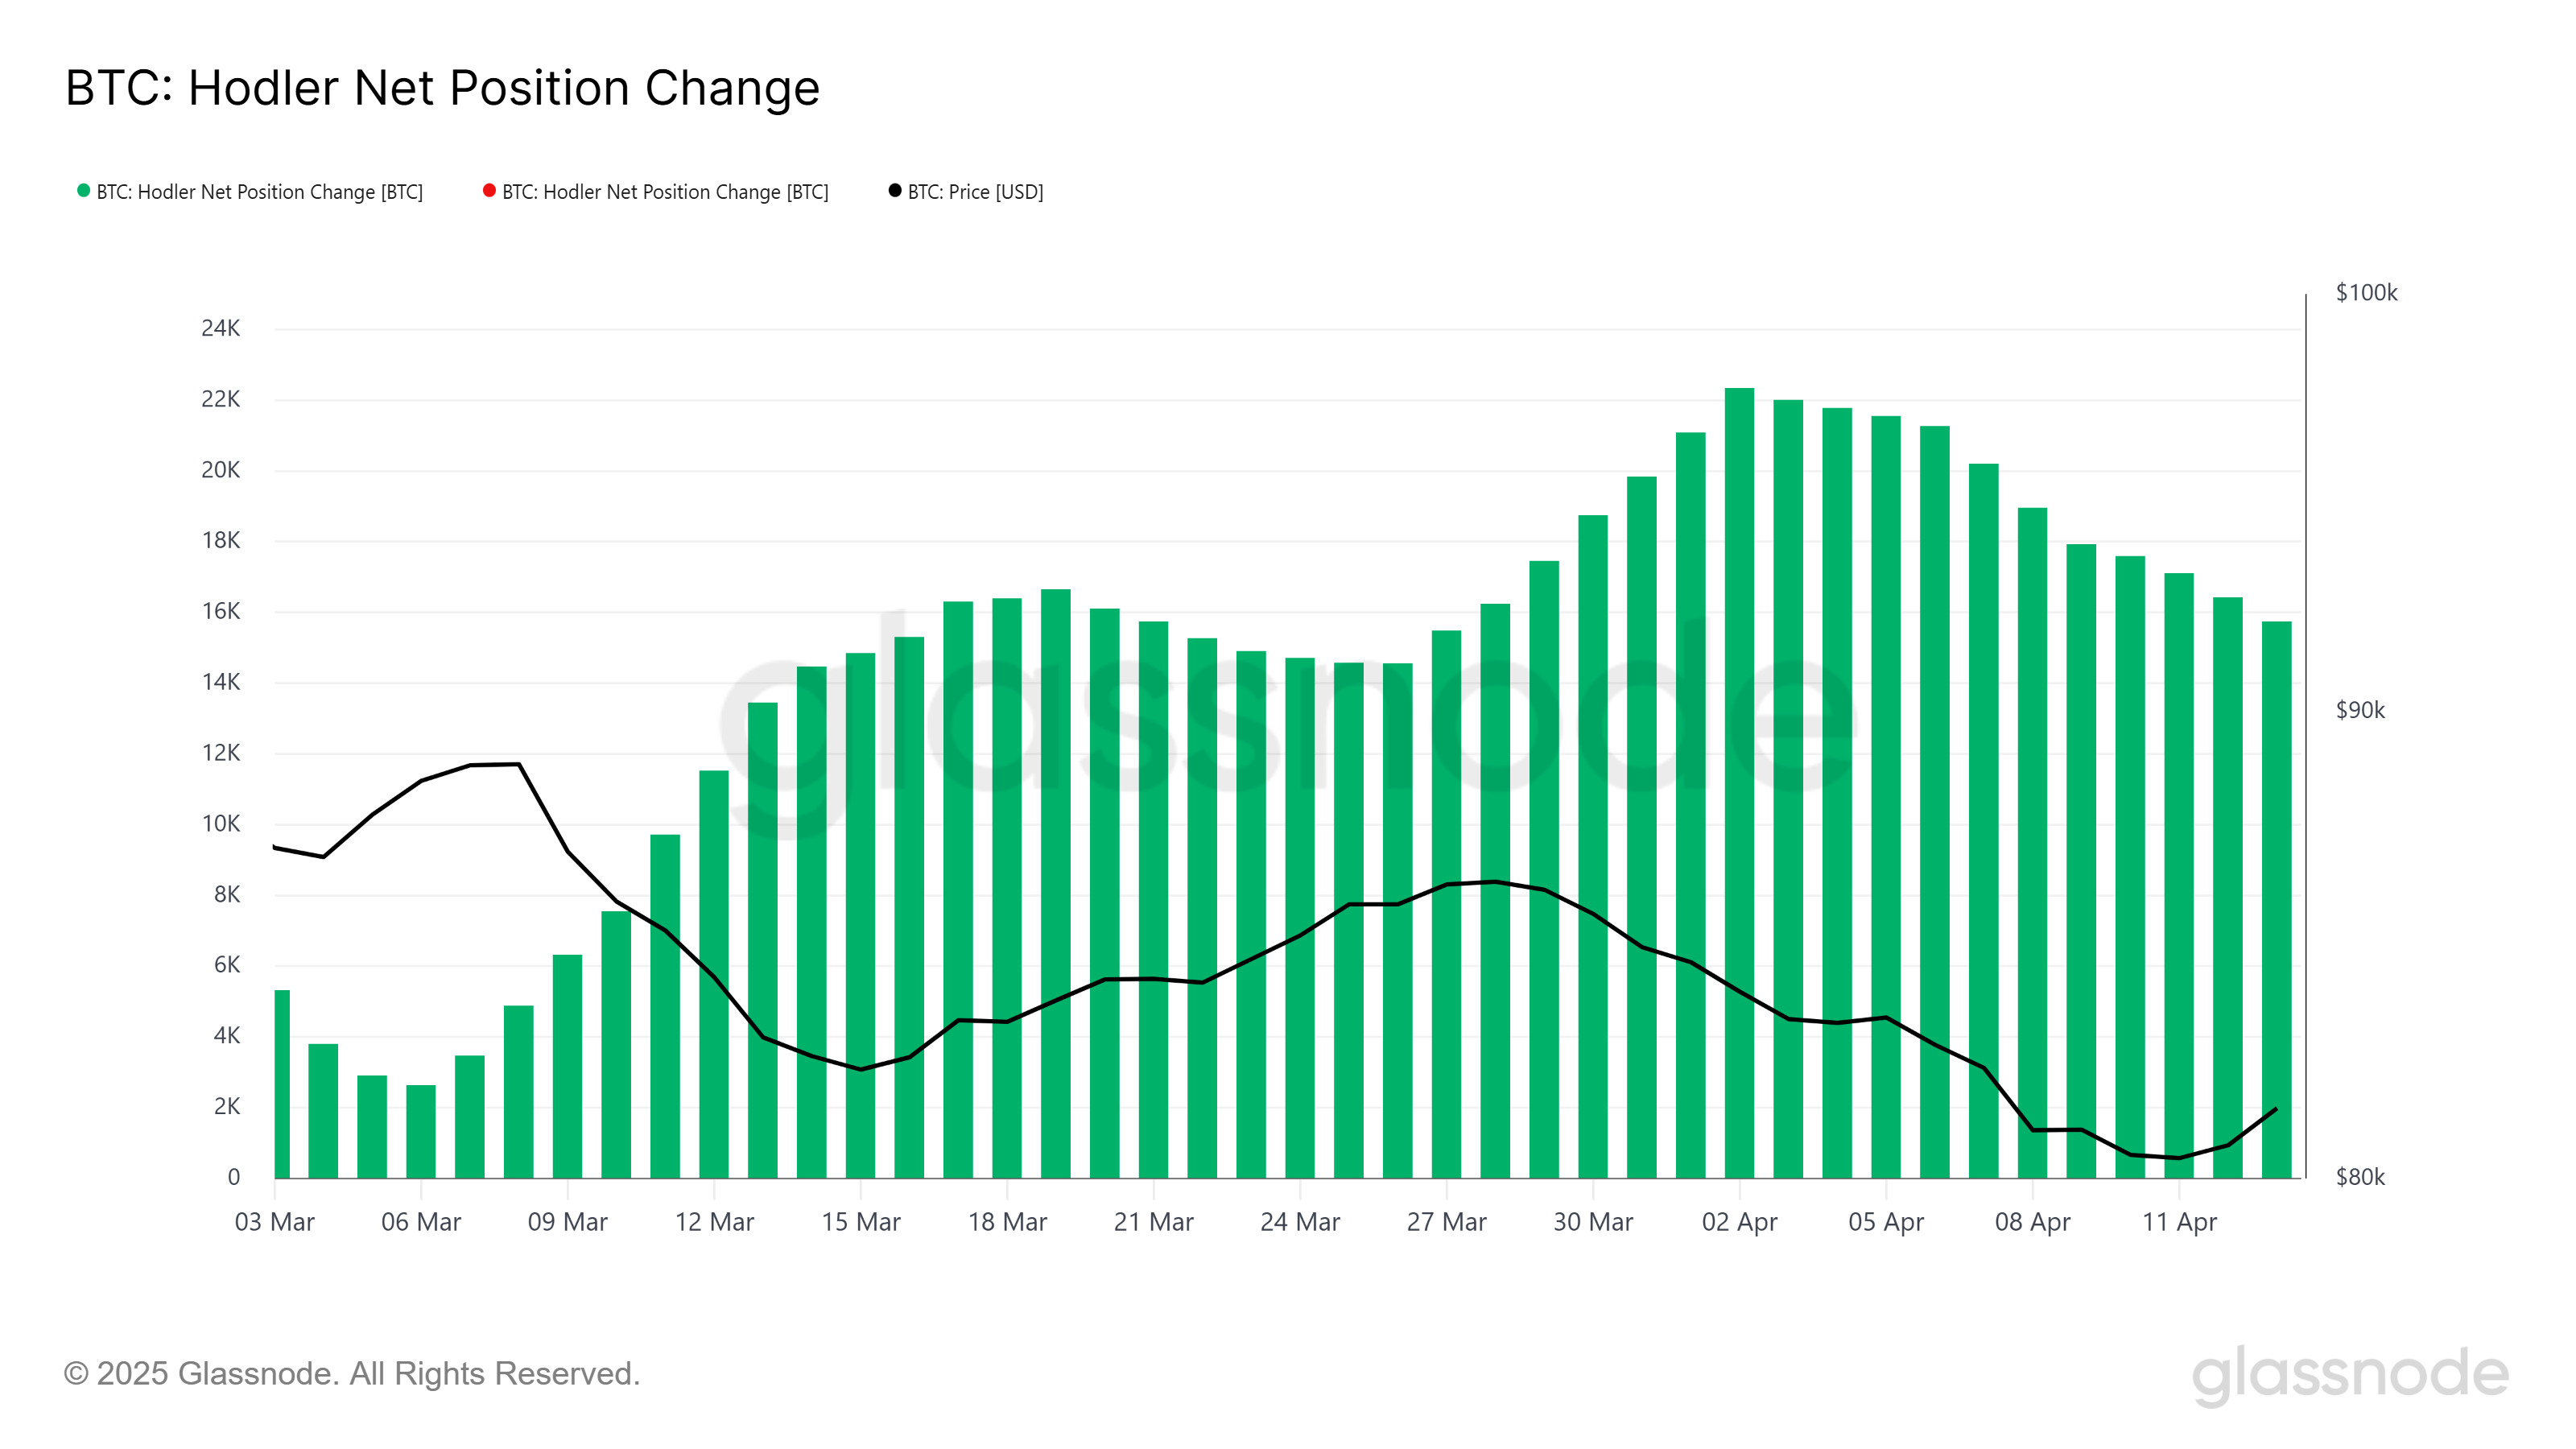
The overall momentum of Bitcoin, measured by technical indicators, also reflects bearish signals. The HODLer net position change further backs this narrative, as it shows that LTHs have sold a significant portion of their holdings over the last two weeks. In total, these sales amounted to more than 6,596 BTC, which is worth over $550 million.
Although this figure may not be enormous, the psychological shift from confidence to caution among LTHs is a larger concern. This lack of conviction could delay Bitcoin’s recovery and contribute to further price stagnation. In turn, this could further limit market activity and exacerbate the ongoing downturn.
BTC Price Is Facing A Decline
Bitcoin’s price is trading at $84,421, hovering just above the crucial support level of $82,619. The price remains trapped under the key $85,000 resistance level, which could cause further pressure if it fails to break above. If Bitcoin loses support at $82,619, a decline to the next major psychological support of $80,000 is possible.
If the bearish trend continues, the price could fall further, with $78,841 emerging as a critical level to watch. Losing this support would mark a more significant downturn, confirming the continued market weakness and deepening the bearish outlook for Bitcoin.
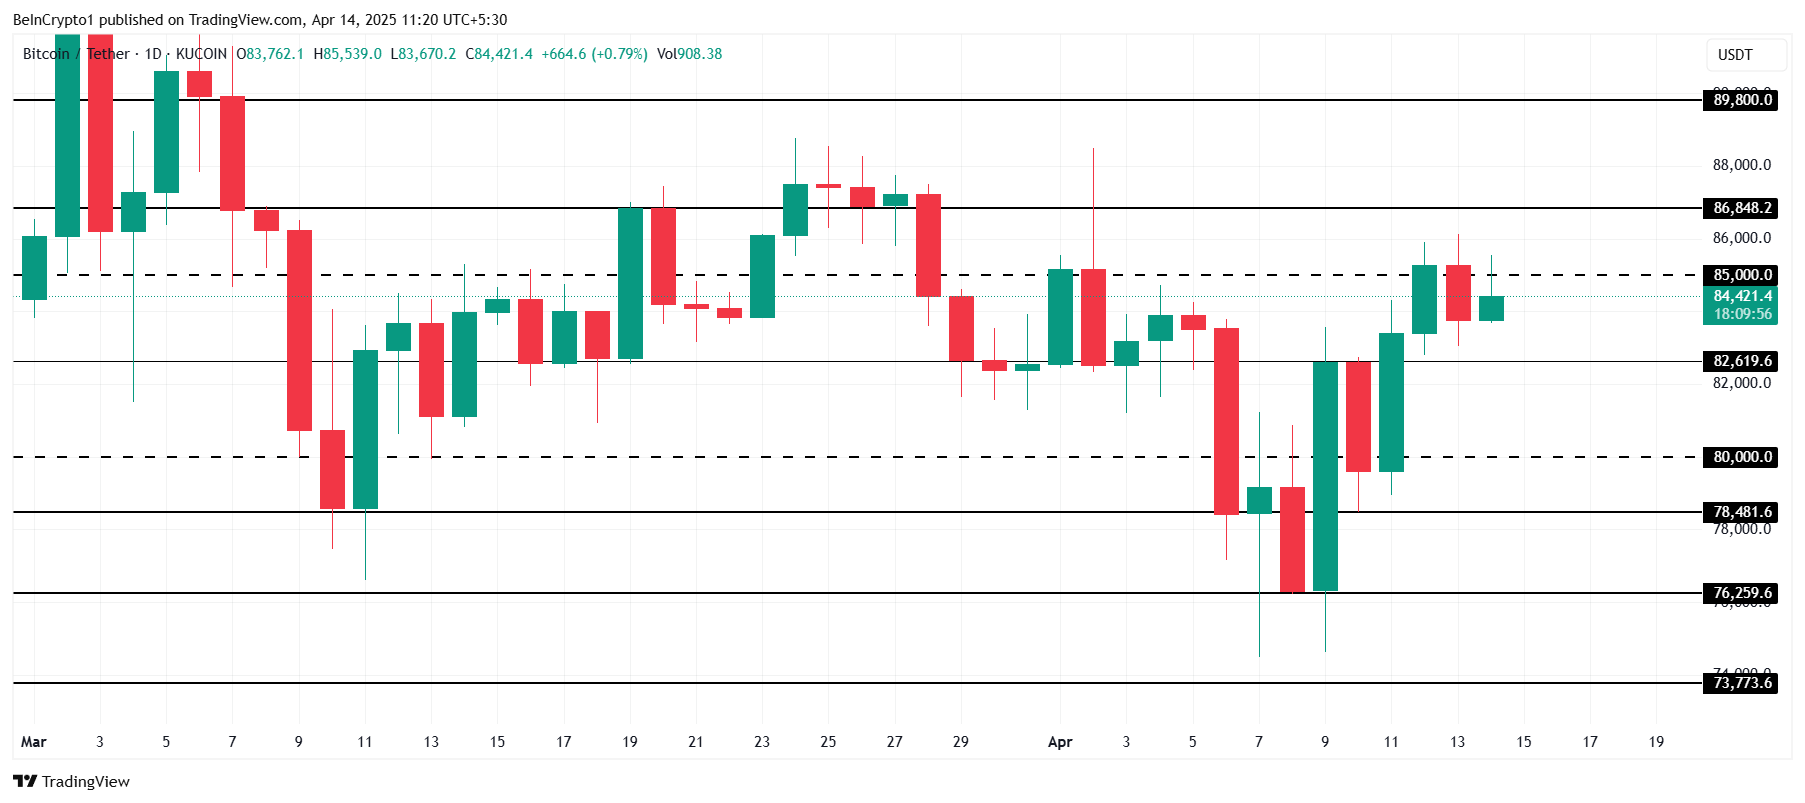
However, if Bitcoin manages to breach and hold $85,000 as support, it could ignite a recovery, pushing the price back up toward $86,848. A sustained rise above $85,000 would invalidate the current bearish trend and pave the way for a potential surge toward $89,800, reestablishing confidence among investors.
Disclaimer
In line with the Trust Project guidelines, this price analysis article is for informational purposes only and should not be considered financial or investment advice. BeInCrypto is committed to accurate, unbiased reporting, but market conditions are subject to change without notice. Always conduct your own research and consult with a professional before making any financial decisions. Please note that our Terms and Conditions, Privacy Policy, and Disclaimers have been updated.
Aayush Jindal, a luminary in the world of financial markets, whose expertise spans over 15 illustrious years in the realms of Forex and cryptocurrency trading. Renowned for his unparalleled proficiency in providing technical analysis, Aayush is a trusted advisor and senior market expert to investors worldwide, guiding them through the intricate landscapes of modern finance with his keen insights and astute chart analysis.
From a young age, Aayush exhibited a natural aptitude for deciphering complex systems and unraveling patterns. Fueled by an insatiable curiosity for understanding market dynamics, he embarked on a journey that would lead him to become one of the foremost authorities in the fields of Forex and crypto trading. With a meticulous eye for detail and an unwavering commitment to excellence, Aayush honed his craft over the years, mastering the art of technical analysis and chart interpretation.
As a software engineer, Aayush harnesses the power of technology to optimize trading strategies and develop innovative solutions for navigating the volatile waters of financial markets. His background in software engineering has equipped him with a unique skill set, enabling him to leverage cutting-edge tools and algorithms to gain a competitive edge in an ever-evolving landscape.
In addition to his roles in finance and technology, Aayush serves as the director of a prestigious IT company, where he spearheads initiatives aimed at driving digital innovation and transformation. Under his visionary leadership, the company has flourished, cementing its position as a leader in the tech industry and paving the way for groundbreaking advancements in software development and IT solutions.
Despite his demanding professional commitments, Aayush is a firm believer in the importance of work-life balance. An avid traveler and adventurer, he finds solace in exploring new destinations, immersing himself in different cultures, and forging lasting memories along the way. Whether he’s trekking through the Himalayas, diving in the azure waters of the Maldives, or experiencing the vibrant energy of bustling metropolises, Aayush embraces every opportunity to broaden his horizons and create unforgettable experiences.
Aayush’s journey to success is marked by a relentless pursuit of excellence and a steadfast commitment to continuous learning and growth. His academic achievements are a testament to his dedication and passion for excellence, having completed his software engineering with honors and excelling in every department.
At his core, Aayush is driven by a profound passion for analyzing markets and uncovering profitable opportunities amidst volatility. Whether he’s poring over price charts, identifying key support and resistance levels, or providing insightful analysis to his clients and followers, Aayush’s unwavering dedication to his craft sets him apart as a true industry leader and a beacon of inspiration to aspiring traders around the globe.
In a world where uncertainty reigns supreme, Aayush Jindal stands as a guiding light, illuminating the path to financial success with his unparalleled expertise, unwavering integrity, and boundless enthusiasm for the markets.

Reason to trust
![]()
Strict editorial policy that focuses on accuracy, relevance, and impartiality
Created by industry experts and meticulously reviewed
The highest standards in reporting and publishing
Strict editorial policy that focuses on accuracy, relevance, and impartiality
Morbi pretium leo et nisl aliquam mollis. Quisque arcu lorem, ultricies quis pellentesque nec, ullamcorper eu odio.
Ethereum price started a fresh increase above the $1,580 zone. ETH is now consolidating gains and might aim for more gains above $1,665.
- Ethereum started a decent increase above the $1,580 and $1,620 levels.
- The price is trading below $1,620 and the 100-hourly Simple Moving Average.
- There is a new connecting bearish trend line forming with resistance at $1,640 on the hourly chart of ETH/USD (data feed via Kraken).
- The pair could start a fresh increase if it clears the $1,665 resistance zone.
Ethereum Price Gains Pace
Ethereum price formed a base above $1,500 and started a fresh increase, like Bitcoin. ETH gained pace for a move above the $1,550 and $1,580 resistance levels.
The bulls even pumped the price above the $1,620 zone. A high was formed at $1,668 and the price recently started a downside correction. There was a move below the $1,650 support zone. The price dipped below the 23.6% Fib retracement level of the upward move from the $1,482 swing low to the $1,668 high.
Ethereum price is now trading below $1,600 and the 100-hourly Simple Moving Average. On the upside, the price seems to be facing hurdles near the $1,640 level. There is also a new connecting bearish trend line forming with resistance at $1,640 on the hourly chart of ETH/USD.

The next key resistance is near the $1,665 level. The first major resistance is near the $1,680 level. A clear move above the $1,680 resistance might send the price toward the $1,720 resistance. An upside break above the $1,720 resistance might call for more gains in the coming sessions. In the stated case, Ether could rise toward the $1,750 resistance zone or even $1,800 in the near term.
More Losses In ETH?
If Ethereum fails to clear the $1,640 resistance, it could start a downside correction. Initial support on the downside is near the $1,600 level. The first major support sits near the $1,575 zone and the 50% Fib retracement level of the upward move from the $1,482 swing low to the $1,668 high.
A clear move below the $1,575 support might push the price toward the $1,550 support. Any more losses might send the price toward the $1,520 support level in the near term. The next key support sits at $1,480.
Technical Indicators
Hourly MACD – The MACD for ETH/USD is losing momentum in the bullish zone.
Hourly RSI – The RSI for ETH/USD is now above the 50 zone.
Major Support Level – $1,575
Major Resistance Level – $1,665

Bitcoin’s Price Under $85,000 Brings HODlers Profit To 2-Year Low

XRP Price Turns Green, Sparks Hopes of a Fresh Upside Push

Ethereum Price Steadies After Increase—Now Eyes More Gains Ahead

MANTRA’s OM Token Crashes 90% Amid Insider Dump Allegations

Mantra Team Responds As The OM Token Price Crashes Over 80% In 24 Hours

Ethereum Price Eyes Rally To $4,800 After Breaking Key Resistance

2.52 Million Altcoins Are Ruining Crypto’s Future

Animoca Brands Valuation Tanks 75% In Two Years, Here’s Why

Crypto exchange BingX hacked for $43 million

Are The Big Players Losing Interest?

Hong Kong’s Securities Association Tips Authorities On Crypto Self-Regulation

Coinbase cbBTC Set to go Live on Solana
2.52 Million Altcoins Are Ruining Crypto’s Future
Animoca Brands Valuation Tanks 75% In Two Years, Here’s Why
Crypto exchange BingX hacked for $43 million
Are The Big Players Losing Interest?
Hong Kong’s Securities Association Tips Authorities On Crypto Self-Regulation
Coinbase cbBTC Set to go Live on Solana
-
Altcoin8 hours ago
Mantra Team Responds As The OM Token Price Crashes Over 80% In 24 Hours
-

 Market16 hours ago
FARTCOIN Is Overbought After 250% Rally – Is the Bull Run Over?
-
 Market13 hours ago
Hackers are Targeting Atomic and Exodus Wallets
-

 Market12 hours ago
3 Token Unlocks for This Week: TRUMP, STRK, ZKJ
-

 Bitcoin20 hours ago
CryptoQuant CEO Says Bitcoin Bull Cycle Is Over, Here’s Why
-

 Ethereum19 hours ago
Ethereum Reclaims Key Support At $1,574, Here’s The Next Price Target
-

 Market18 hours ago
DOGE Spot Outflows Exceed $120 Million in April
-

 Market17 hours ago
Binance Users Targeted by New Phishing SMS Scam