
Ethereum
Ethereum To Pull A BTC 2021-Like Rally? Analyst Weighs In

As Bitcoin finally soars above the long-awaited $100,000 milestone, Ethereum (ETH) attempts to break out from a key resistance zone. The second-largest crypto rally has fueled optimism about its targets, with some suggesting that it could mimic BTC’s 2020-2021 rally.
Related Reading
Ethereum Reclaims $3,900
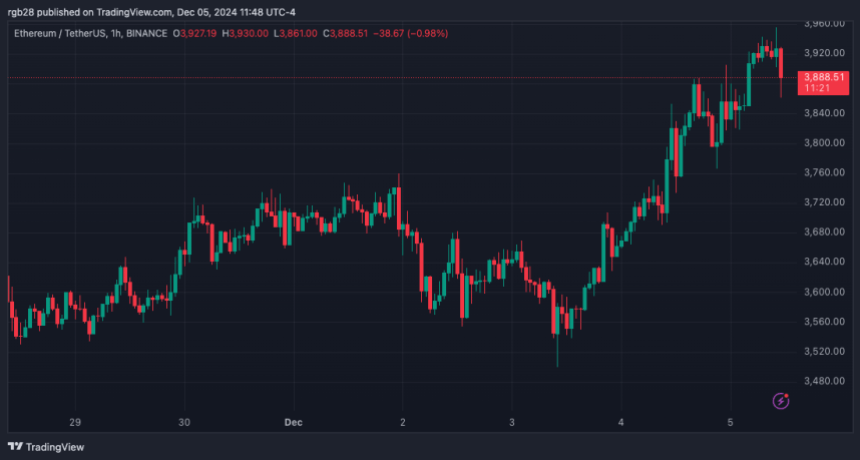
Ethereum, the second-largest cryptocurrency by market capitalization, has recorded a 10% surge in the past week, moving from the $3,500 mark to the $3,900 resistance. On Wednesday, the King of Altcoins surpassed the $3,800 level for the first time in six months and continued climbing to retest the $3,900 resistance, not seen since early March.
In the early hours of Thursday, ETH turned this key zone into support, briefly dipping to $3,860 before jumping back to the recently reclaimed level. As the cryptocurrency nears its yearly high of $4,093, sentiment around the token’s short-term performance has turned extremely bullish.
Ethereum is retesting a massive multi-year resistance zone, which could send ETH to a new ATH. According to analyst Alex Clay, the cryptocurrency attempts to break “through the Key Resistance Zone on the weekly timeframe.”
ETH has rested the key zone five times since 2021, facing rejection from the upper resistance at $3,950 on four occasions before. However, Ethereum broke past this level in late 2021, when it hit its all-time high (ATH) and held above it for nearly three months.
The analyst noted that if the King of Altcoins successfully breaks above this level and turns it into support, it will be the next “to break through” and smash its ATH. Clay added that he sees “no major pullback in the near time.”
Similarly, crypto analyst Jelle stated that if Ethereum breaks above the March high, “all bets are off,” suggesting that the chances of ETH taking a long consolidation period before a new ATH like BTC did were “very low.”
ETH To Rally Toward $10,000?
Jelle also noted that Ethereum’s current setup mimicked Bitcoin’s in July 2020. Per the chart, Bitcoin broke through a multi-year downtrend line by mid-2020, followed by a massive 500% 10-month rally toward the $60,000 mark in April 2021.
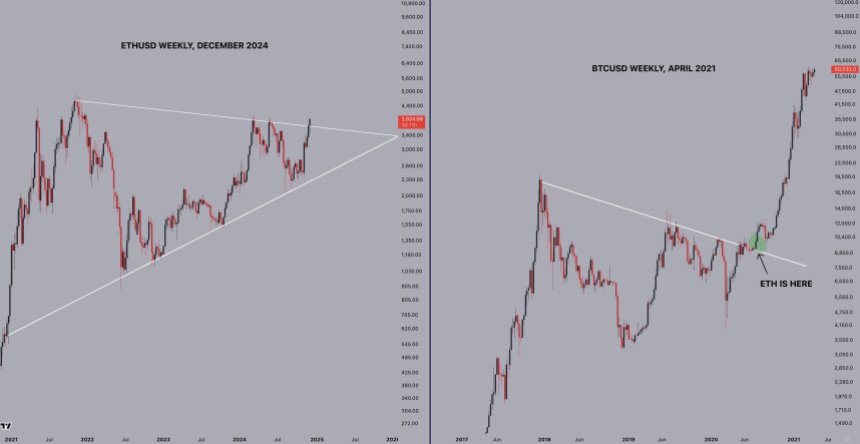
The analyst noted that ETH breached the multi-year trendline today, like BTC in 2020, which could trigger a similar rally toward new highs in the next few months. He added that investors are “in for a treat if this plays out anything similar.”
In another post, he highlighted that Ethereum started rallying when Bitcoin broke its ATH and entered price discovery when BTC traded nearly 100% above its previous cycle high.
Related Reading
He considers that it would be surprising to “see things play out similarly this time around. BTC & ETH climbing in tandem, leading to ETH entering price discovery somewhere around ±$130,000.”
Based on this, the analyst believes that a 150-200% rally toward the $10,000-$12,000 price range for the cryptocurrency is possible for this cycle. As of this writing, ETH is trading at $3,905, a 2.4% increase in the daily timeframe.
Featured Image from Unsplash.com, Chart from TradingView.com


Reason to trust
![]()
Strict editorial policy that focuses on accuracy, relevance, and impartiality
Created by industry experts and meticulously reviewed
The highest standards in reporting and publishing
Strict editorial policy that focuses on accuracy, relevance, and impartiality
Morbi pretium leo et nisl aliquam mollis. Quisque arcu lorem, ultricies quis pellentesque nec, ullamcorper eu odio.
Ethereum is trading below critical resistance levels after enduring weeks of heavy selling pressure and lackluster performance. Since breaking below the psychological $2,000 mark, the price has dropped more than 21%, signaling growing uncertainty among short-term investors. This decline has raised questions among market participants, especially as Ethereum’s on-chain fundamentals remain robust.
Related Reading
Top analyst Ted Pillows shared insights suggesting that ETH is now trading near bear market lows—yet the network has never looked stronger. Over 95% of all stablecoin transactions are processed on Ethereum, and it still leads in Total Value Locked (TVL) across DeFi and Real World Asset (RWA) protocols. It is also the only altcoin with an approved spot ETF in the US, and numerous upgrades are lined up to improve its speed and reduce transaction costs.
Despite these strengths, Ethereum’s price remains suppressed, leading to growing speculation: is this just market sentiment at play, or could it reflect coordinated manipulation to shake out weak hands before a reversal? As Ethereum continues to dominate the utility narrative in crypto, many long-term holders see this downturn as a strategic accumulation zone, while others brace for more downside.
Ethereum Fundamentals Shine Despite Bearish Market Conditions
Ethereum is facing a critical test as it trades near major demand levels while macroeconomic uncertainty deepens. Global tensions persist as US President Donald Trump escalates his trade war with China. The recent 90-day tariff pause for all countries except China has done little to ease market fears. As economic pressure builds between the world’s two largest economies, investors are increasingly turning away from high-risk assets like crypto, driving volatility across digital markets.
Ethereum, like the broader crypto market, has suffered under this weight. The asset is now hovering just above bear market lows after a prolonged decline, prompting concerns over its short-term price action. Yet, despite the technical weakness, Pillows points to Ethereum’s strong fundamentals as a reason to remain optimistic.
According to Pillows, Ethereum remains the backbone of the decentralized finance (DeFi) ecosystem. It processes over 95% of all stablecoin transactions, commands the highest Total Value Locked (TVL), and leads the charge in Real World Asset (RWA) tokenization. It’s also the only altcoin the US has approved for a spot ETF, adding institutional legitimacy.
With several protocol upgrades ahead aimed at improving scalability and reducing costs, Pillows believes Ethereum’s current valuation could represent a long-term buying opportunity. As he puts it: if you believe in fundamentals, ETH remains the top bet among altcoins.
Related Reading
ETH Price Stuck In Range: Bulls Eye $1,800 Breakout
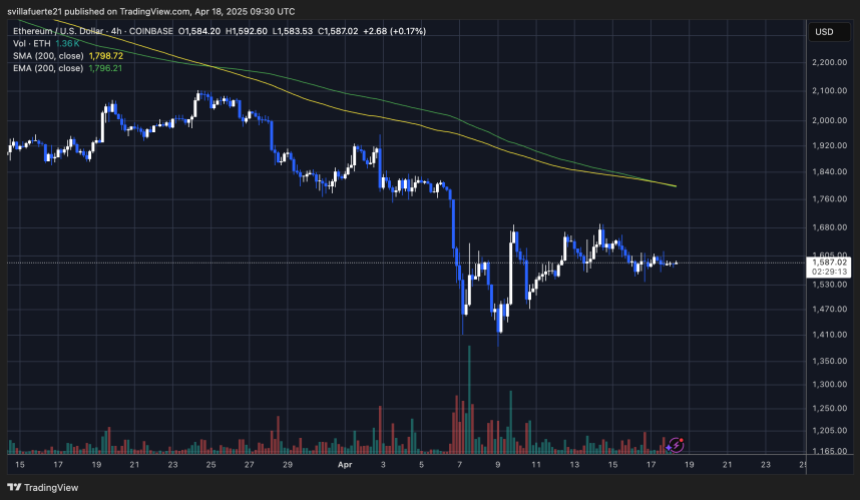
Ethereum is trading at $1,590 after several days of choppy price action between $1,500 and $1,700. The market remains stuck in this narrow range as bulls struggle to regain momentum amid broader macroeconomic uncertainty. The inability to reclaim key resistance zones has kept ETH under pressure, and a decisive breakout is needed to shift sentiment.

Bulls are currently eyeing the 4-hour 200-day Moving Average (MA) and Exponential Moving Average (EMA), both sitting near the $1,800 level. Reclaiming this zone would mark a major short-term victory for buyers and could signal the beginning of a recovery phase. A clean break above $1,800 would also invalidate the current lower-high structure and potentially drive ETH toward higher supply areas near $2,000.
Related Reading
However, the downside risks remain. If Ethereum fails to hold above current support levels and dips below $1,550, the next leg could send the asset beneath the $1,500 mark. For now, the $1,500–$1,800 corridor defines Ethereum’s battleground, and traders are closely watching for a breakout that sets the next major direction.
Featured image from Dall-E, chart from TradingView

Reason to trust
![]()
Strict editorial policy that focuses on accuracy, relevance, and impartiality
Created by industry experts and meticulously reviewed
The highest standards in reporting and publishing
Strict editorial policy that focuses on accuracy, relevance, and impartiality
Morbi pretium leo et nisl aliquam mollis. Quisque arcu lorem, ultricies quis pellentesque nec, ullamcorper eu odio.
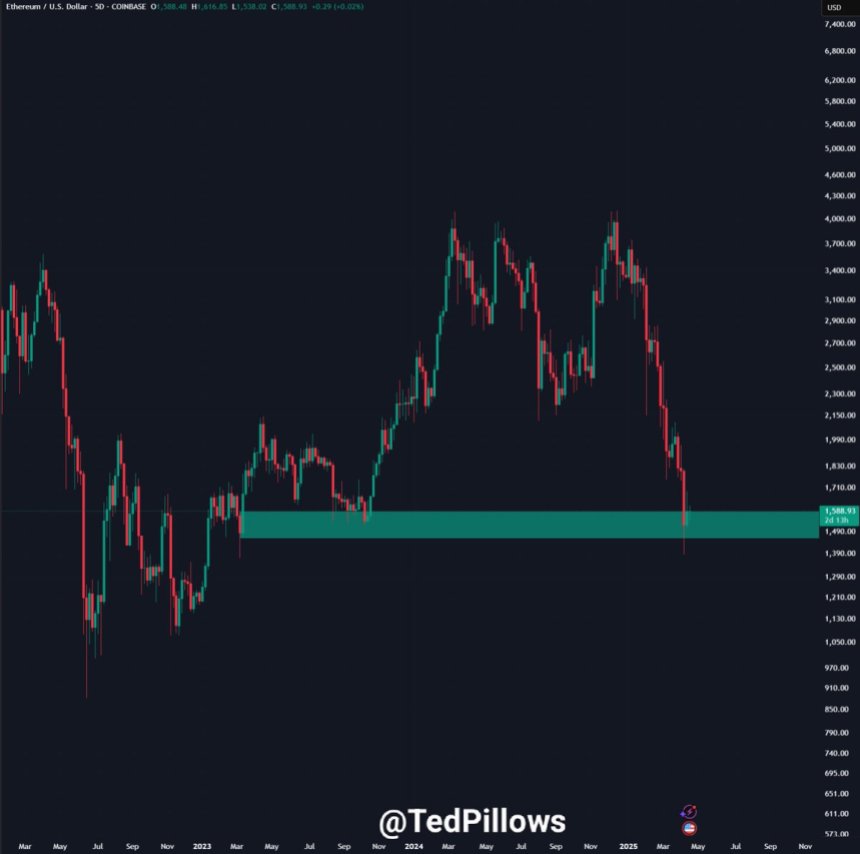
Ethereum is trading at critical levels after enduring weeks of aggressive selling pressure. Since retracing below the key $2,000 mark, the second-largest cryptocurrency has struggled to regain bullish momentum. Currently down 21% from that level, ETH continues to hover near $1,580, reflecting a clear lack of conviction from both buyers and sellers.
Related Reading
The market has entered a period of extreme indecision. According to top analyst Daan, Ethereum’s price has remained notably compressed, barely moving over the past two days. This type of consolidation often precedes sharp price action in either direction, and traders are watching closely for signs of a breakout or breakdown.
Macroeconomic uncertainty continues to influence investor sentiment, with global trade tensions and monetary policy concerns keeping pressure on risk assets like Ethereum. For now, bulls must reclaim the $1,850 resistance zone to confirm a trend reversal, while a drop below $1,500 could open the door to deeper losses.
As volatility builds in the background, the current compression could be the calm before a storm—setting the stage for Ethereum’s next decisive move. Will it break out to the upside, or is more downside in store?
Ethereum Compression Signals Breakout As Macro Pressure Builds
Ethereum is facing a critical test as it trades at compressed levels following weeks of sustained selling pressure. The broader crypto market remains under pressure as global tensions escalate. US President Donald Trump’s trade war with China continues to shape macroeconomic sentiment, leaving investors cautious across all high-risk asset classes.
Despite last week’s announcement of a 90-day tariff pause for all countries except China, uncertainty remains. The unresolved status of US-China trade relations continues to weigh on markets and is one of the primary factors driving hesitation in price movement. For Ethereum, this has translated into extremely low volatility and a stalled price structure.
Daan shared insights suggesting that Ethereum’s price has been “extremely compressed” and has not shown meaningful movement for the better part of two days. According to Daan, this type of compression usually precedes a significant breakout—though the direction of that move remains unknown.
Investors and traders alike are closely monitoring this setup, as compressed price action typically leads to large, momentum-driven shifts. With broader macro risks still in play, Ethereum’s next move could define the short-term trend and set the tone for the market in the weeks ahead.
Related Reading
ETH Bulls Aim To Regain Control
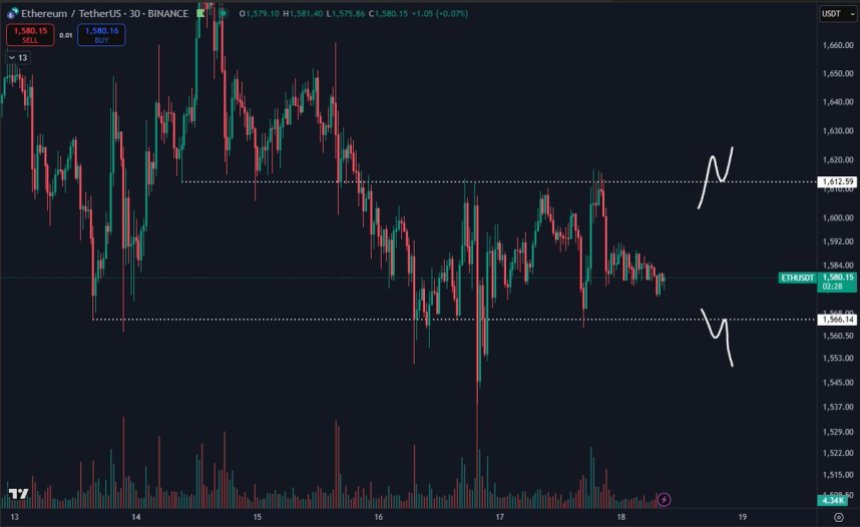
Ethereum is trading at $1,590 after several days of sideways price action, hovering between support at $1,550 and resistance near $1,700. Despite holding above the lower end of this range, ETH has struggled to generate the momentum needed to break out and confirm a short-term recovery.
For bulls to establish a stronger position, ETH must push above the 4-hour 200-day moving average (MA) and exponential moving average (EMA), both of which continue to act as dynamic resistance. A breakout above these indicators could trigger renewed interest from traders and signal the beginning of a recovery phase.
However, the true test lies at the $2,000 level—a major psychological and technical resistance zone. Reclaiming this level would mark a shift in market sentiment and open the door to higher targets.
Related Reading
On the downside, failure to gain ground above the current range and a drop below $1,550 could quickly drag ETH below $1,500, increasing the risk of a deeper correction. For now, Ethereum remains in a consolidation phase, and the next decisive move will likely dictate whether bulls regain control or if sellers push prices into lower demand zones.
Featured image from Dall-E, chart from TradingView


On-chain data shows the Ethereum transaction fee has dropped to the lowest level in years recently. Here’s what this could mean for ETH’s price.
Ethereum Average Fees Now Valued At Just $0.168
In a new Insight post, the on-chain analytics firm Santiment has discussed the latest trend in the Average Fees of Ethereum. The “Average Fees” is a metric that, as its name suggests, keeps track of the average amount of fees that senders on the ETH network are attaching with their transactions.
This indicator’s value directly correlates to the amount of traffic that the blockchain is dealing with. The reason behind this lies in the fact that the network only has a limited capacity to handle transfers.
When the chain is busy, transfers can remain stuck in waiting until the transactions ahead of them clear out. Those who want their transactions to be processed ASAP can choose to attach a larger-than-average fee, so that the validators prioritise them.
In times of especially high traffic, this kind of competition among users can quickly drive the Average Fees up to significant levels. When there is little activity, however, senders have little incentive to pay any notable amount of fees, so the metric’s value can remain low.
It would appear that Ethereum has been witnessing the latter kind of conditions recently, as the Average Fees have registered a drop.

Looks like the value of the metric has declined to a low level in recent days | Source: Santiment
As displayed in the above graph, the Ethereum Average Fees have fallen to a low of $0.168 recently, which is the lowest that it has been since 2020. This means that activity on the network is historically low at the moment.
According to the analytics firm, this may not actually be so bad from a trading perspective, as low fee periods can often precede rebounds in the cryptocurrency’s price.
Below is a chart that shows an example of this trend in action:

The past trend in the transaction fees of ETH | Source: Santiment
As is visible in the above graph, the Ethereum Average Fees falling under the $1 mark back in 2023 led to bullish momentum for the asset. The explanation behind this pattern may lie in the fact that low-fee periods can indicate disinterest from the crowd.
Historically, ETH and other digital assets have tended to move in a way that goes contrary to the expectation of the majority. This means that a lack of optimism can lead to rebounds, while excessive hype can result in tops. From the chart, it’s apparent that ETH’s Q1 2024 top came as the metric surpassed $15, indicating a plethora of excitement.
“Generally, fee levels under $1 are a pretty promising sign that the crowd has become disinterested,” notes the analytics firm. “Just remember that there is no set guaranteed “bottom” or “top” level every time fee costs breach below or above a certain level.”
ETH Price
At the time of writing, Ethereum is trading around $1,600, up more than 1% in the last 24 hours.
Looks like the price of the asset hasn't moved much recently | Source: ETHUSDT on TradingView
Featured image from Dall-E, Santiment.net, chart from TradingView.com
Editorial Process for bitcoinist is centered on delivering thoroughly researched, accurate, and unbiased content. We uphold strict sourcing standards, and each page undergoes diligent review by our team of top technology experts and seasoned editors. This process ensures the integrity, relevance, and value of our content for our readers.

Uniswap Founder Urges Ethereum To Pursue Layer 2 Scaling To Compete With Solana

Expert Reveals Why Consensus 2025 Will Be Pivotal For Pi Network

Analyst Says Bitcoin Price Might Be Gearing Up For Next Big Move — What To Know

Ripple Expands In Asia With Debut XRP Investment Tool

Cardano Bulls Secure Most Important Signal To Drive Price Rally

Technical Analyst Warns Ripple’s XRP Price Could drop 50%

2.52 Million Altcoins Are Ruining Crypto’s Future

Animoca Brands Valuation Tanks 75% In Two Years, Here’s Why

Crypto exchange BingX hacked for $43 million

Are The Big Players Losing Interest?

Hong Kong’s Securities Association Tips Authorities On Crypto Self-Regulation

Coinbase cbBTC Set to go Live on Solana
2.52 Million Altcoins Are Ruining Crypto’s Future
Animoca Brands Valuation Tanks 75% In Two Years, Here’s Why
Crypto exchange BingX hacked for $43 million
Are The Big Players Losing Interest?
Hong Kong’s Securities Association Tips Authorities On Crypto Self-Regulation
Coinbase cbBTC Set to go Live on Solana
-
 Market18 hours ago
Cardano (ADA) Moves Sideways, But Bullish Shift May Be Brewing
-
 Altcoin14 hours ago
Analyst Reveals Dogecoin Price Can Reach New ATH In 55 Days If This Happens
-

 Market21 hours ago
XRP Consolidation About To Reach A Bottom, Wave 5 Says $5.85 Is Coming
-

 Market20 hours ago
Canary Capital Aims to Launch TRON-Focused ETF
-
 Altcoin18 hours ago
XRP ETF Approval Could Spark a ‘Perfect Storm’ for Ripple Coin: Expert
-
Altcoin17 hours ago
Pi Coin Price Soars As Pi Network Reveals Massive Community Reward Plans.
-
 Altcoin23 hours ago
Chainlink Price To Hit $26 If LINK Breaks Past This Crucial Level
-

 Market14 hours ago
Binance Mandates KYC Re-Verification For India Users