
Ethereum
Ethereum Netflow Spikes To Derivatives Markets – Is a Price Swing on the Horizon?

Ethereum (ETH) has experienced a lackluster phase in recent weeks, with the asset seeing small price surges but still struggling to hold near or above the $3,000 mark after a brief rally in August.
According to a recent analysis from a CryptoQuant analyst, the behind the scenes of this price struggle for ETH has been quite interesting, with the asset seeing a significant shift in its netflow.
This shift in Ethereum’s netflow could have significant implications for ETH, potentially influencing the market’s reaction positively or negatively.
Related Reading
Dissecting The Ethereum Netflow
The CryptoQuant analyst Amr Taha revealed in a recent post on the CryptoQuant QuickTake platform that Ethereum has recently experienced a spike in netflows, with approximately 96,000 ETH moving into derivative exchanges.

According to Taha, this influx could indicate that traders are positioning for potential price shifts, as large transfers to derivatives platforms have historically preceded periods of increased volatility or even corrections.
Taha’s analysis, backed by previous spikes in May and early July, suggests that Ethereum’s current activity might foreshadow a heightened period of market movement. The analyst wrote:
The latest spike in netflow could signal another period of heightened market activity, potentially a price correction or a sharp move based on trader positioning.
Market Sentiment Drawn From Bitcoin
In addition to Ethereum’s netflows, Taha delved into Bitcoin’s Futures Sentiment Index, observing that this metric shows peaks in sentiment that may serve as indicators of broader market behavior.

He pointed out three instances where the sentiment index spiked, marked by red-circled peaks (in the chart above), each time coinciding with a local market top. This trend implies that, following peaks in trader sentiment, Bitcoin’s price typically experiences a decline.
The sentiment index, thus, can serve as a “contrarian indicator”—when optimism peaks, price corrections often follow. These sentiment patterns may signal that investors should brace for potential volatility for Ethereum, which is highly correlated with Bitcoin.
Related Reading
Meanwhile, Ethereum has continued to hover somewhere below $3,000. So far, the asset has registered a correction in the past week, dropping by 3.1%. However, the past day performance is attempting to be more positive.
Over this period, Ethereum has seen a slight increase of 0.9%, rising to as high as $2,559 earlier today before now trading for $2,541, at the time of writing.
Despite the notable fluctuation the asset has seen in the past week alone, rising to above $2,700 and dropping below $2,500, Ethereum daily trading volume seems to have maintained composure.
Data from Coingecko shows that this metric has remained between $15 billion and $19 billion in the past week with no major spike or decline.
Featured image created with DALL-E, Chart from TradingView


Reason to trust
![]()
Strict editorial policy that focuses on accuracy, relevance, and impartiality
Created by industry experts and meticulously reviewed
The highest standards in reporting and publishing
Strict editorial policy that focuses on accuracy, relevance, and impartiality
Morbi pretium leo et nisl aliquam mollis. Quisque arcu lorem, ultricies quis pellentesque nec, ullamcorper eu odio.
Crypto analyst Doctor Profit, who called the Ethereum price dump, is now providing a bullish outlook for ETH. Based on his analysis, now might be a great time to buy Ethereum, which has so far underperformed other top cryptocurrencies.
Analyst Says ETH Is Now Undervalued Following Ethereum Price Dump
In an X post, Doctor Profit stated that ETH is undervalued now following the Ethereum price dump. He noted that the leading altcoin is sitting at a historical support at $1,800, the same support he had predicted that ETH would dump to. With this massive correction and fear in the market driving Ethereum to this support level, the analyst claimed that the altcoin is undervalued now.
Related Reading
His analysis suggests that now might be a great time to accumulate ETH as the Ethereum price could rebound from this historical support. Indeed, some investors are already using this massive correction as an opportunity to stack up more coins. IntoTheBlock data shows that Ethereum’s ‘Concentration’ metric is currently bullish, indicating that ETH whales are adding to their positions.
Besides Doctor Profit, crypto analyst Astronomer also believes that ETH is currently undervalued and predicts that the Ethereum price could revisit $4,000. He highlighted several technical signals that indicate that the leading altcoin could reach these highs. The analyst also alluded to the $1,800 support, noting that this range has historically been a launch pad for price recoveries.
However, crypto analyst Kledji has predicted that the Ethereum price could still drop to as low as $1,400 before rebounding. He stated that ETH will likely consolidate around this range for a while before it rallies to this $1,400 target later this month. His analysis suggested that the altcoin’s downtrend depended on Bitcoin’s performance. Therefore, if BTC recovers from this range, ETH will unlikely drop to that $1,400 level.
ETH’s Dominance Is On The Decline, But History Could Repeat Itself
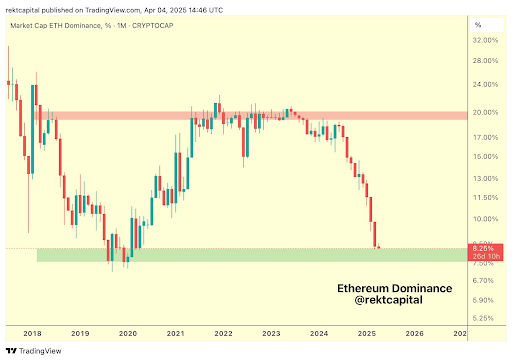
In an X post, crypto analyst Rekt Capital revealed that ETH’s dominance has dropped from 20% to 8% since June 2023 as a result of the Ethereum price dump. He then noted that Ethereum’s dominance has historically reversed this 8% zone to become more market-dominant. The analyst then raised the possibility of history repeating itself, with ETH recovering well and enjoying a higher market dominance.
Crypto analyst Crypto Patel is also confident that the Ethereum price will rebound soon. His accompanying chart showed that ETH could bounce from this $1,800 support and enter phase 3 of the Wyckoff chart, sending its price to as high as $6,800, a new all-time high (ATH).
Related Reading: Ethereum Price: Analyst Predicts ‘Most Hated Rally In Crypto’
At the time of writing, the Ethereum price is trading at around $1,800, up over 1% in the last 24 hours, according to data from CoinMarketCap.
Featured image from Unsplash, chart from Tradingview.com

Reason to trust
![]()
Strict editorial policy that focuses on accuracy, relevance, and impartiality
Created by industry experts and meticulously reviewed
The highest standards in reporting and publishing
Strict editorial policy that focuses on accuracy, relevance, and impartiality
Morbi pretium leo et nisl aliquam mollis. Quisque arcu lorem, ultricies quis pellentesque nec, ullamcorper eu odio.
Ethereum (ETH) has seen a 17% drop in the last month, trading below $1,850 for the past few days. Amid its current performance, an analyst has warned investors the cryptocurrency risks dropping to 17-month lows if it fails to reclaim key resistance levels.
Related Reading
Ethereum Could See Drop To $1,550
Ethereum has been trading below a key support zone for the past two days, hovering between $1,750-$1,840 after failing to recover the $1,900 mark on Wednesday. The second-largest cryptocurrency by market capitalization lost its 15-month range in early March, dropping below $2,100 for the first time since December 2023.
Since losing this level, ETH has seen its worst performance in seven years, recording a negative monthly close for the fourth consecutive month. Analyst Rekt Capital highlighted that this performance validated Ethereum’s double top formation that developed within its $2,196-$3,904 Macro Range.
After breaking down from this range, Ethereum trades within a historical liquidity pool, between the $1,640-$1,930 range, and “effectively has positioned itself for a bearish retest” of the range’s top with its monthly close within this area, which could turn this level into a new resistance.
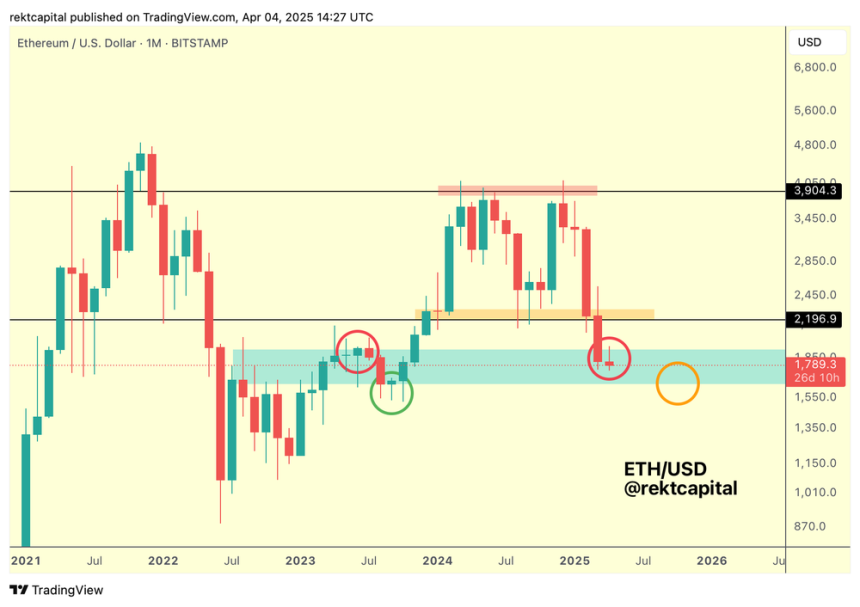
As the analyst explains, turning this level into resistance has historically seen ETH’s price drop to the current range’s lower zone. “In other words, turning the red level into resistance (red circle) has historically preceded a drop into the support at the bottom of the light blue historical demand area (orange circle),” he detailed.
As such, Ethereum must reclaim the top of this demand area “to challenge a move to the old Macro Range Low of $2,196.” Meanwhile, a rejection from the $1,930 mark, which it has been unable to reclaim over the past week, would see ETH risk a 15% drop to the $1,550 area.
Is A 20% Rally Coming?
Rekt Capital also pointed out that since June 2023, ETH’s Dominance has dropped from 20% to 8%, historically a reverse area for the cryptocurrency. When Ethereum’s Dominance touched the $7.5%-8.25% range, it reversed “to become more market-dominant,” which could signal a reversal for the King of Altcoins.
Several analysts consider that the key levels to watch are the $1,750 support and the $2,100 resistance, as a break above or below these levels will determine ETH’s next significant move.
Related Reading
Analyst Sjuul from AltCryptoGems suggested that Ethereum could eye a 20% rally based on a Power of 3 setup in ETH’s lower timeframe chart. The analyst highlighted that the cryptocurrency had an accumulation phase after dropping below the $2,150 support, hovering within the $1,840 and $2,100 levels since March 10.
After dipping below the $1,840 mark, the cryptocurrency has been in the manipulation phase, the chart shows, which could trigger a push to the $2,150 resistance if ETH breaks out and starts the distribution phase.
As of this writing, Ethereum trades at $1,808, a 2.2% surge in the daily timeframe.
Featured Image from Unsplash.com, Chart from TradingView.com


On-chain data shows the large Ethereum investors have been adding to their holdings recently, a sign that could be bullish for the ETH price.
Ethereum Large Holders Netflow Has Turned Positive Recently
In a new post on X, the market intelligence platform IntoTheBlock has talked about the trend in the Large Holders Netflow for Ethereum. This metric measures the net amount of the cryptocurrency that’s moving into or out of the wallets controlled by the Large Holders.
The analytics firm defines three categories for investors: Retail, Investors, and Whales. Members of Retail hold less than 0.1% of the supply in their balance, that of Investors between 0.1% and 1%, and that of Whales more than 1%.
At the current exchange rate, 0.1% of the ETH supply, the cutoff between Retail and Investors, is worth over $214 million, a very substantial amount. This means that the addresses who are able to qualify for Investors are already quite large, let alone those who have made it to the Whales.
As such, the Large Holders, the actual cohort of interest in the current discussion, includes both of these groups. Thus, the Large Holders Netflow keeps track of the transactions related to Investors and Whales.
When the value of this metric is positive, it means the big-money investors on the network are receiving a net number of deposits to their wallets. On the other hand, it being under the zero mark suggests these key holders are participating in net selling.
Now, here is the chart shared by IntoTheBlock that shows the trend in the Ethereum Large Holders Netflow over the past week:
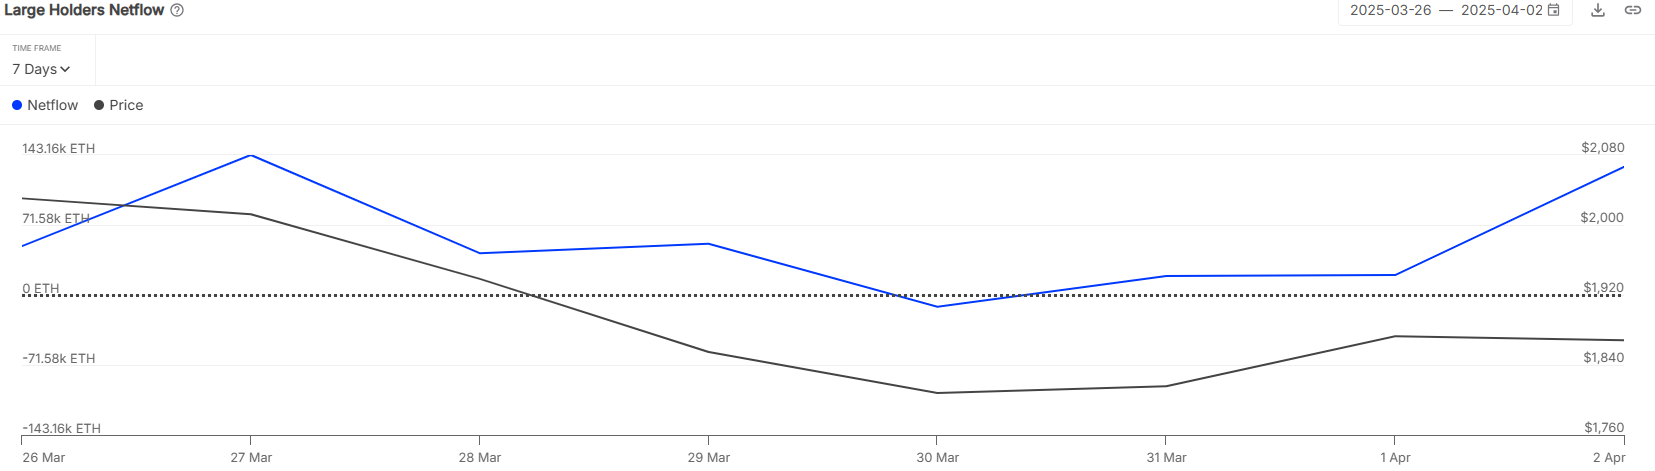
The value of the metric appears to have been positive in recent days | Source: IntoTheBlock on X
As is visible above, the Ethereum Large Holders Netflow has remained almost entirely in the positive territory for the period of the graph, which implies that the Investors and Whales have been accumulating. On the second of the month alone, these key entities loaded up on a net 130,000 ETH (about $230 million).
The net inflows for the Large Holders have come while the cryptocurrency has been declining, so it’s possible that this cohort believes the recent prices have been offering a profitable entry into the asset. It now remains to be seen whether this accumulation would be enough to help ETH attain a bottom or not.
In some other news, the Ethereum fee is down to the lowest level since 2020 this quarter, as the analytics firm has pointed out in another X post.
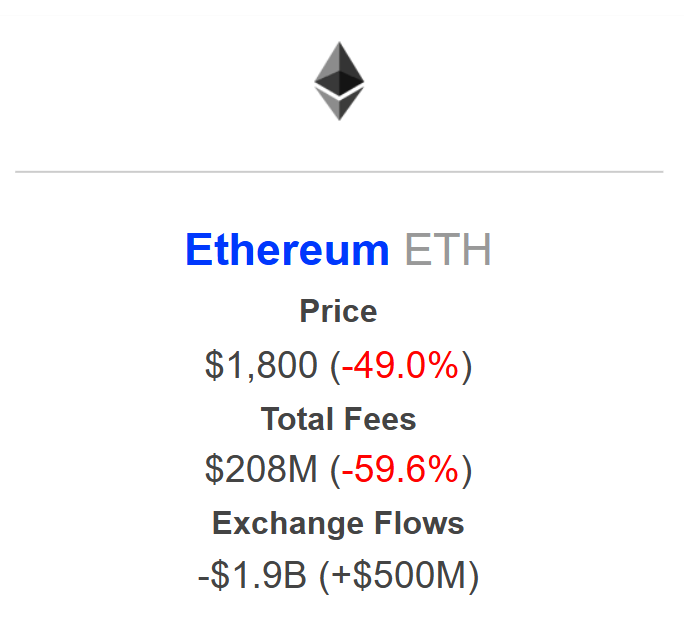
The changes that occurred in key ETH metrics during the first quarter of 2025 | Source: IntoTheBlock on X
Following a sharp drop of 59.6%, the Ethereum total transaction fees is down to $208 million. According to IntoTheBlock, this trend is “primarily driven by the gas limit increase and transactions moving to L2s.”
ETH Price
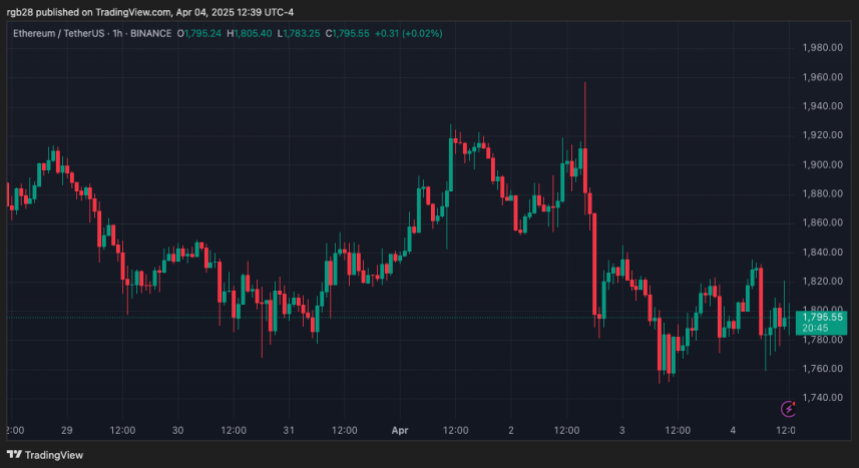
Ethereum saw recovery above $1,900 earlier in the week, but it seems bullish momentum has already run out as the coin’s back to $1,770.
Looks like the price of the coin has plunged recently | Source: ETHUSDT on TradingView
Featured image from Dall-E, IntoTheBlock.com, chart from TradingView.com
Editorial Process for bitcoinist is centered on delivering thoroughly researched, accurate, and unbiased content. We uphold strict sourcing standards, and each page undergoes diligent review by our team of top technology experts and seasoned editors. This process ensures the integrity, relevance, and value of our content for our readers.

Solana Altcoin Saros Rallies 1000% Since March, Hits New High

Key Levels To Watch For Potential Breakout
IMX Price Nears All-Time Low After 30 Million Token Sell-Off

SEC’s Guidance Raises Questions About Tether’s USDT

Crypto Analyst Who Called Ethereum Price Dump Says ETH Is Now Undervalued, Time To Buy?

Expert Calls On Pi Network To Burn Tokens To Revive Pi Coin Price


-

 Market23 hours ago
Why Analysts Believe Q2 is a Great Opportunity to Buy Altcoins
-
 Altcoin23 hours ago
Analyst Predicts XRP Price To Reach Double Digits By July 21 Cycle Peak
-

 Bitcoin21 hours ago
Bitcoin Eyes Breakout as Global M2 Hits Record $108 Trillion
-

 Market21 hours ago
NFT Market Falls 12% in March as Ethereum Sales Drop 59%
-

 Altcoin20 hours ago
PayPal Adds Chainlink And Solana To Its US Cryptocurrency Service
-

 Market19 hours ago
Is Korea Propping Up The XRP Price? Pundit Explains What’s Happening
-

 Market20 hours ago
Crypto Whales Are Selling These Altcoins Post Trump Tariffs
-
 Bitcoin17 hours ago
5 Facts About Bitcoin’s Creator
 Arabic
 Chinese (Simplified)
 Dutch
Dutch English
 French
 German
 Italian
 Portuguese
 Russian
 Spanish
 Vietnamese