Ethereum
Ethereum Exchange Inflows Highest Since March: Bearish Sign?

On-chain data shows that the Ethereum exchange net flows have been highly positive recently, a sign that selling may be taking place in the market.
Ethereum Exchange Netflows Have Seen A Spike Recently
In a new post on X, CryptoQuant head of research Julio Moreno discussed the latest trend in Ethereum’s exchange netflow. The “exchange netflow” here refers to an on-chain metric that keeps track of the net amount of ETH moving into or out of the wallets of all centralized exchanges.
When this metric’s value is positive, it means that these platforms are receiving a net number of coins right now. As one of the main reasons holders might deposit coins to exchanges is for selling-related purposes, this trend can potentially bearish consequences for the asset’s price.
On the other hand, the indicator’s negative reading implies that exchange-associated wallets are observing net withdrawals currently. Investors may be moving their coins away from the custody of these central entities for long-term holding, so such a trend may prove to be bullish for the cryptocurrency.
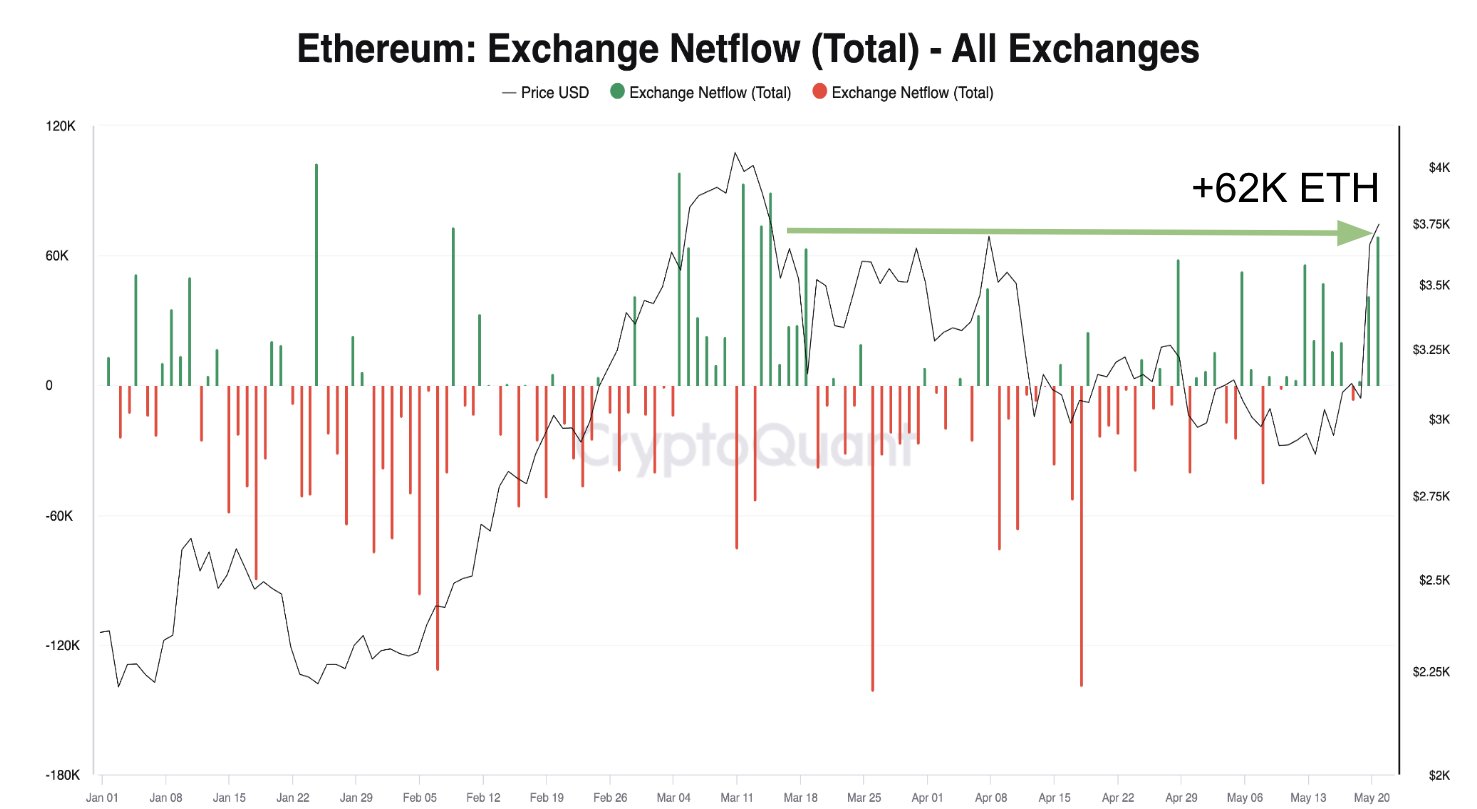
Now, here is a chart that shows the trend in the Ethereum exchange netflow over the last few months:
The value of the metric appears to have been quite high in recent days | Source: @jjcmoreno on X
The above graph shows that the Ethereum exchange netflow has registered some large positive spikes recently. These net deposits have been of a scale only observed in March. According to Moreno, these deposits have mostly been headed towards Binance and Bybit.
As mentioned before, net exchange inflows can indicate that selling is taking place in the market, although this doesn’t necessarily have to be the case. Sometimes, large deposits use one of the other services these platforms provide, like derivatives contracts.
Whatever the case, though, volatility does tend to rise following large deposits. The chart shows that the rally top back in March saw the indicator assume high values as investors participated in profit-taking.
Recently, Ethereum has observed a sharp surge, fueled by positive news surrounding the spot exchange-traded funds (ETFs). Given this rally, it’s possible that profit-taking may once again be the goal behind the positive net flows.
So far, though, ETH has managed to stave off this potential selloff, as its price has remained relatively high. It’s uncertain, however, how long demand can continue to absorb the possible selling pressure if deposits continue to flow into these platforms in the coming days.
ETH Price
Ethereum started a move up during the past day as its price breached the $3,950 mark. The rise only lasted briefly, though, as the asset returned below the $3,800 level.
Looks like the price of the asset has observed a surge over the last few days | Source: ETHUSD on TradingView
Featured image from Kanchanara on Unsplash.com, CryptoQuant.com, chart from TradingView.com
Ethereum
Ethereum Faces ‘Hyperinflation Hellscape’—Analyst Reveals Key On-Chain Insights

Ethereum (ETH) continues to underperform in the broader cryptocurrency market, currently trading just below $1,800 after falling 4% in the past 24 hours. Despite a strong start to the year, where the crypto market experienced bullish momentum, ETH has failed to sustain its upward trajectory.
Since slipping below the $3,000 level, the asset has largely ranged downward and has now breached the $2,000 support zone, signaling weakening demand and sentiment.
While Bitcoin and other major digital assets still managed to see some recovery efforts in recent weeks, Ethereum’s price decline has been accompanied by decreasing network activity and weakening on-chain fundamentals.
This divergence has raised concerns over ETH’s short-term outlook and prompted a fresh analysis of the underlying causes driving the asset’s performance.
Fee Decline and Network Inactivity Fuel Inflationary Pressures
CryptoQuant analyst EgyHash recently published a report highlighting key on-chain metrics that suggest Ethereum’s current market weakness is closely tied to its declining fee economy and user activity.
According to the report titled: “Why Ethereum Is Bleeding Value: Fee Crash Meets Hyperinflation Hellscape.” Ethereum’s network is experiencing its lowest levels of activity since 2020.

Daily active addresses have declined steadily since early 2025, and average transaction fees have dropped to record lows. This reduction in activity has led to a sharp fall in Ethereum’s burn rate, a metric crucial in offsetting inflationary pressures following the network’s transition to proof-of-stake.
The Dencun upgrade, which was expected to enhance network efficiency, has coincided with an extended period of low transaction volumes, further reducing fee income and contributing to higher net ETH issuance.

EgyHash concludes that the confluence of weak network engagement, reduced burn rate, and high token inflation is central to Ethereum’s declining valuation.
Why Ethereum Is Bleeding Value
“Ethereum’s recent underperformance can be largely attributed to diminished network activity, as evidenced by declining active addresses and reduced transaction fees.” – By @EgyHashX pic.twitter.com/fgQJYCrOIn
— CryptoQuant.com (@cryptoquant_com) April 3, 2025
Ethereum Technical Outlook Signals Potential Support
Despite on-chain headwinds, some technical analysts maintain a cautiously optimistic view. Trader Courage, a technical analyst on X, noted that Ethereum is currently testing a major support zone and could rebound toward the upper resistance of its current trading range.
Back at the green support line. Looks like we could be heading towards the top of the range.
Key levels are on the chart.#Ethereum pic.twitter.com/rRX8b3b6nW
— Trader Courage
(@CryptoCourage1) April 3, 2025
Another market analyst, CryptoElite, shared a long-term ascending trendline that ETH has respected historically. Based on this trend, the analyst believes ETH could still have the potential to rally to $10,000 later in the year, provided broader market conditions improve.
Featured image created with DALL-E, Chart from TradingView
Ethereum
Ethereum Trading In ‘No Man’s Land’, Breakout A ‘Matter Of Time’?

Reason to trust

Strict editorial policy that focuses on accuracy, relevance, and impartiality
Created by industry experts and meticulously reviewed
The highest standards in reporting and publishing
Strict editorial policy that focuses on accuracy, relevance, and impartiality
Morbi pretium leo et nisl aliquam mollis. Quisque arcu lorem, ultricies quis pellentesque nec, ullamcorper eu odio.
Ethereum (ETH) continues failing to reclaim the $2,100 resistance, dropping 6% in the past week. As the second largest crypto trades within its “make or break” levels, some market watchers suggest it will continue to move sideways before another major move.
Related Reading
Ethereum Trades At 2023 Levels
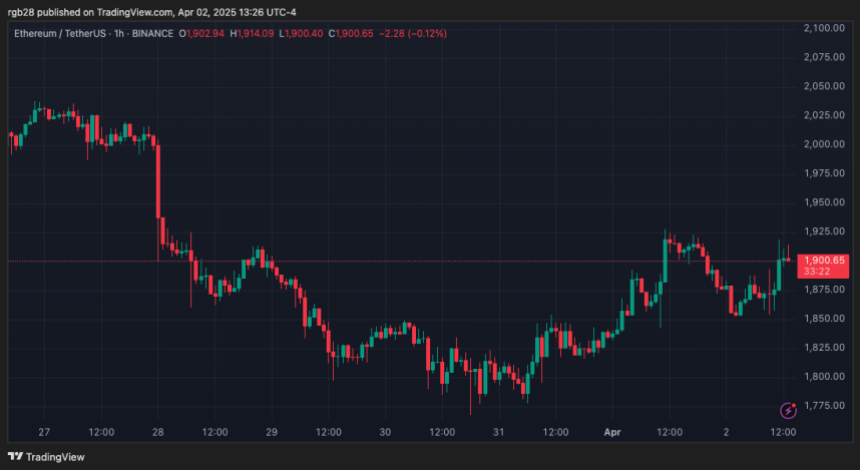
After closing its worst Q1 since 2018, Ethereum continued moving sideways, hovering between the $1,775-$1,925 price range. Amid last Monday’s recovery, Ethereum traded only 6% below its monthly opening, eyeing a potential positive close in the monthly timeframe.
Nonetheless, the cryptocurrency fell over 10% from last week’s high to close the first quarter 45.4% below its January opening and 18.6% from its March opening. Moreover, it registers its worst performance in seven years, recording four consecutive months of bleeding for the first time since 2018.
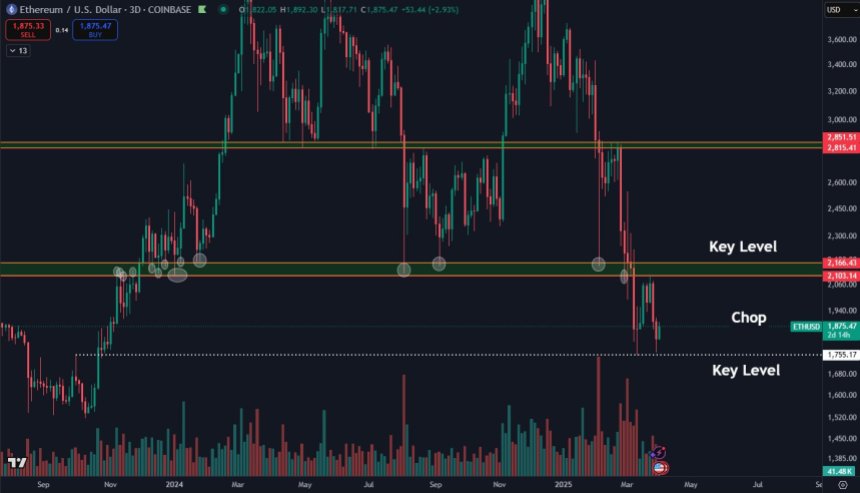
Daan Crypto Trades noted that ETH is “still trading in no man’s land” despite its recent attempts to break above its current range. In early March, Ethereum dropped below the $2,100 mark, losing its 2024 gains and hitting a 16-month low of $1,750.

The trader suggested that the crucial levels to watch are a breakdown below $1,750 or a breakout above $2,100. “Anything in between is just going to be a painful chop,” he added.
Another market watcher, Merlijn The Trader, highlighted that ETH is at 2021 levels, pointing that it is trading within the breakout zone that led to Ethereum’s all-time high (ATH) but has stronger fundamentals and more institutional demand four years later.
“ETH is sitting on the same monthly support that ignited the 2021 bull run. Hold it, and $10K is in play. Lose it… and things get ugly,” he detailed.
More Chop Before ETH’s Next Move?
Analyst VirtualBacon considers that Ethereum will continue to trade within its current price range for the time being. He explained that ETH’s price has fallen to retest the last bear market resistance levels, as it has erased all its gains since November 2023.
The analyst considers this zone a “good value range” but doesn’t expect the cryptocurrency to break out “right away.” However, he added that a bullish breakout is “simply a matter of time” in longer timeframes.
“Ethereum always catches up when the Fed pivots and the global liquidity index beings to uptrend. That’s when you see the ETH/BTC ratio start to turn up again, leading the rest of the altcoin market,” he concluded.
Related Reading
Ali Martinez pointed out that the number of large ETH transactions has significantly declined in over a month, dropping 63.8% since February 25.
During this period, large transactions fell from 14,500 to 5,190, signaling a drop in whale activity on the network. He also noted that whales have sold 760,000 ETH in the last two weeks.
As of this writing, Ethereum trades at $1,903, a 6% drop in the weekly timeframe.

Featured Image from Unsplash.com, Chart from TradingView.com
Ethereum
Why A Massive Drop To $1,400 Could Rock The Underperformer

Reason to trust

Strict editorial policy that focuses on accuracy, relevance, and impartiality
Created by industry experts and meticulously reviewed
The highest standards in reporting and publishing
Strict editorial policy that focuses on accuracy, relevance, and impartiality
Morbi pretium leo et nisl aliquam mollis. Quisque arcu lorem, ultricies quis pellentesque nec, ullamcorper eu odio.
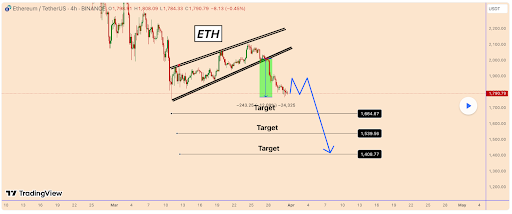
Crypto analyst Klejdi has indicated that Ethereum’s pain is far from over, with the second-largest crypto by market cap set to suffer a further downtrend. Specifically, he warned that ETH could still drop to as low as $1,400 before it finds a bottom.
Ethereum May Still Drop To As Low As $1,400
In a TradingView post, Kledji stated that Ethereum may drop to $1,400, providing a bearish outlook for the altcoin, which has underperformed other top cryptocurrencies. The analyst noted that ETH lost nearly 12% of its value within just three days after breaking out of its recent pattern last Friday.
Related Reading
He further mentioned that Ethereum’s movement and the rest of the crypto market are closely tied to Bitcoin. As such, this ETH crash is likely to happen, seeing as the flagship crypto has dropped to $81,300 and is already showing signs of further decline.
Klejdi highlighted in his accompanying chart that ETH will likely consolidate near its current level before continuing to move lower. However, the chart showed that the move to this $1,400 target will likely happen this month.

In the meantime, the analyst believes it would be wise to wait for Ethereum’s price to form another bearish pattern before entering a trade. He again reaffirmed that there is a strong possibility that ETH may extend its drop to $1,400.
Ethereum whales are already capitulating ahead of this projected price crash. Onchain analytics platform Lookonchain revealed an ETH OG that has sold off all its holdings. This investor bought 5,0001 ETH while trading at $277 in 2017 and didn’t sell when the altcoin hit its ATH during the last bull run. The whale started selling last month, possibly giving up on Ethereum making a comeback anytime soon.
ETH Will Still Reach New Highs
Crypto analyst Virtual Bacon is still confident that Ethereum will reach new highs. He noted that ETH is back at its key bear market breakout zone, retesting the $1,700 and $2,100 range. He predicts that the altcoin will continue to chop around this range in the short term. However, he remarked that Ethereum tends to catch up fast once the US Federal Reserve pivots and global liquidity turns.
Related Reading
Crypto analyst Crypto Patel affirmed that Ethereum’s biggest run is coming. He stated that Q2 to Q4 of this year will be life-changing for ETH. The analyst added that this could be the cycle top window and advised market participants not to miss it. Crypto Patel advised that they should accumulate between $1,900 and $1,300 with the target of between $7,000 and $10,000 in mind.
At the time of writing, the Ethereum price is trading at around $1,850, up in the last 24 hours, according to data from CoinMarketCap.
Featured image from iStock, chart from Tradingview.com
-

 Regulation23 hours ago
US Senate Banking Committee Approves Paul Atkins Nomination For SEC Chair Role
-

 Market21 hours ago
Binance Managed 94% of All Crypto Airdrops and Staking Rewards
-

 Market23 hours ago
TRUMP Token Hits Record Low Due To Liberation Day Tariffs
-

 Market22 hours ago
Pi Network Price Falls To Record New Low Amid Weak Inflows
-

 Regulation20 hours ago
US SEC Acknowledges Fidelity’s Filing for Solana ETF
-

 Market20 hours ago
XRP Battle Between Bulls And Bears Hinges On $1.97 – What To Expect
-

 Market19 hours ago
Ripple Shifts $1B in XRP Amid Growing Bearish Pressure
-

 Market18 hours ago
Wormhole (W) Jumps 10%—But Is a Pullback Coming?


