
Ethereum
Ethereum Drops Below Key Realized Price: Last Time Was March 2020 Before A Rally

Ethereum has suffered yet another blow this week, sliding to a fresh low of around $1,380 — a level not seen since March 2023. The ongoing downtrend has left investors increasingly concerned, with many now questioning whether ETH’s long-term bullish structure is still intact. Market conditions remain harsh, driven by persistent macroeconomic tensions, rising global instability, and uncertainty stemming from U.S. trade and fiscal policies.
Sentiment across the crypto space continues to deteriorate, and Ethereum’s price action reflects that unease. After months of struggling to hold key support levels, the breakdown below $1,500 has added to fears that a deeper correction may be unfolding.
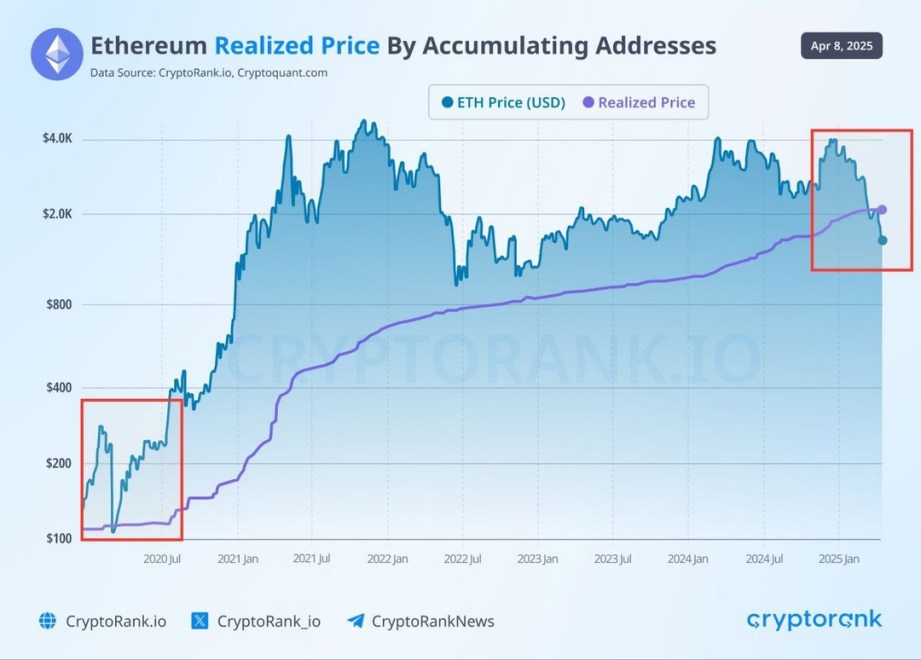
However, amidst the gloom, there may be a silver lining. According to CryptoRank data, Ethereum is now trading below its realized price — a rare occurrence historically associated with market bottoms and strong recovery phases.
While the near-term outlook remains uncertain, such rare on-chain signals could indicate that Ethereum is entering a key accumulation zone. The coming days and weeks will be critical in determining whether this is just another leg down — or the beginning of a long-term reversal.
Ethereum Sinks Below Realized Price As Fear Takes Over The Market
Ethereum has now lost over 33% of its value since late March, triggering deep concern among investors and analysts alike. The price plunge has brought ETH down to levels not seen in over two years, sparking panic and despair among holders who once expected 2025 to be a breakout year for altcoins. Instead, Ethereum has become a symbol of market fragility as the broader macroeconomic landscape continues to worsen.
Trade war fears, inflationary pressure, and a potential global recession are shaking financial markets to their core. In this climate, high-risk assets like Ethereum are among the first to suffer. As capital exits speculative assets in favor of safer havens, ETH’s selloff has only accelerated — and investor confidence has taken a serious hit.
However, there may be a glimmer of hope in the data. Top crypto analyst Carl Runefelt recently pointed out on X that Ethereum is now trading below its realized price of $2,000 — a rare occurrence that has historically signaled major turning points in ETH’s price trajectory.
Runefelt emphasized that the last time ETH dipped below its realized price was in March 2020, when it crashed from $283 to $109 — only to recover strongly in the following months. While the current environment is full of uncertainty, such on-chain metrics hint at the possibility that ETH is entering an accumulation phase once again.
Still, confidence remains fragile, and price action must stabilize before any real bullish narrative can return. Ethereum’s next moves will be critical in determining whether this level marks a true bottom — or just another stop on the way down.
ETH Struggles Below $1,500 With No Clear Support in Sight
Ethereum is currently trading below the $1,500 level after suffering a brutal 50% decline since late February. The aggressive selloff has erased months of gains and left investors in a state of uncertainty, as ETH shows no signs of recovery. Market sentiment remains overwhelmingly bearish, and there is little indication that a bottom has been reached.
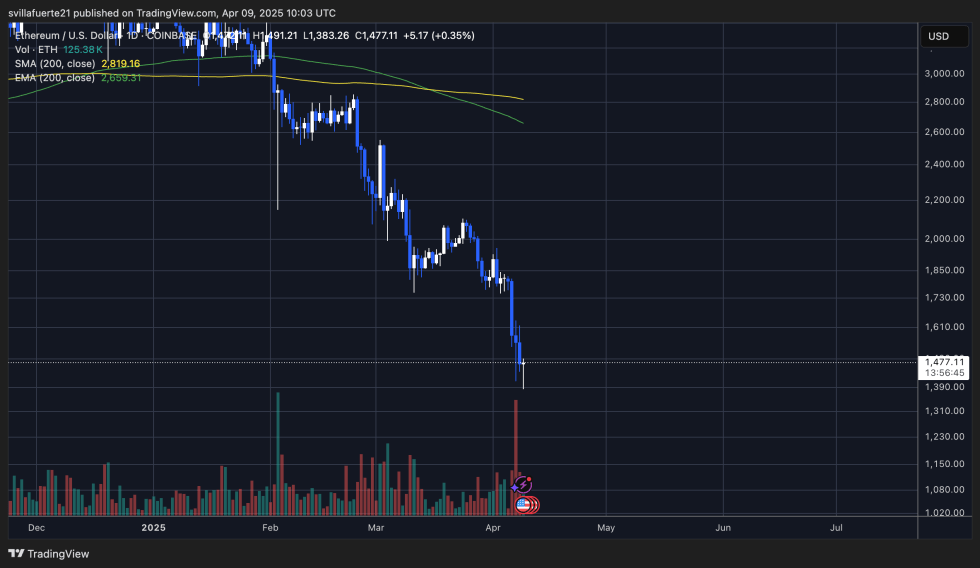
At this stage, Ethereum lacks a clearly defined support zone. Bulls have lost control, and price action continues to drift lower with weak demand and increasing fear. For a meaningful reversal to begin, ETH must first reclaim the $1,850 level — a zone that previously served as a key support and now stands as major resistance.
Until that happens, any upside attempt is likely to be met with strong selling pressure. The situation becomes even more precarious if Ethereum loses the $1,380 level, which has so far acted as a psychological threshold. Falling below this area could open the door to a deeper correction toward the $1,100–$1,200 range.
With macroeconomic tensions still high and volatility expected to persist, traders and investors will be watching closely to see whether Ethereum can stabilize — or continue its sharp decline.
Featured image from Dall-E, chart from TradingView
Editorial Process for bitcoinist is centered on delivering thoroughly researched, accurate, and unbiased content. We uphold strict sourcing standards, and each page undergoes diligent review by our team of top technology experts and seasoned editors. This process ensures the integrity, relevance, and value of our content for our readers.


Meet Samuel Edyme, Nickname – HIM-buktu. A web3 content writer, journalist, and aspiring trader, Edyme is as versatile as they come. With a knack for words and a nose for trends, he has penned pieces for numerous industry player, including AMBCrypto, Blockchain.News, and Blockchain Reporter, among others.
Edyme’s foray into the crypto universe is nothing short of cinematic. His journey began not with a triumphant investment, but with a scam. Yes, a Ponzi scheme that used crypto as payment roped him in. Rather than retreating, he emerged wiser and more determined, channeling his experience into over three years of insightful market analysis.
Before becoming the voice of reason in the crypto space, Edyme was the quintessential crypto degen. He aped into anything that promised a quick buck, anything ape-able, learning the ropes the hard way. These hands-on experience through major market events—like the Terra Luna crash, the wave of bankruptcies in crypto firms, the notorious FTX collapse, and even CZ’s arrest—has honed his keen sense of market dynamics.
When he isn’t crafting engaging crypto content, you’ll find Edyme backtesting charts, studying both forex and synthetic indices. His dedication to mastering the art of trading is as relentless as his pursuit of the next big story. Away from his screens, he can be found in the gym, airpods in, working out and listening to his favorite artist, NF. Or maybe he’s catching some Z’s or scrolling through Elon Musk’s very own X platform—(oops, another screen activity, my bad…)
Well, being an introvert, Edyme thrives in the digital realm, preferring online interaction over offline encounters—(don’t judge, that’s just how he is built). His determination is quite unwavering to be honest, and he embodies the philosophy of continuous improvement, or “kaizen,” striving to be 1% better every day. His mantras, “God knows best” and “Everything is still on track,” reflect his resilient outlook and how he lives his life.
In a nutshell, Samuel Edyme was born efficient, driven by ambition, and perhaps a touch fierce. He’s neither artistic nor unrealistic, and certainly not chauvinistic. Think of him as Bruce Willis in a train wreck—unflappable. Edyme is like trading in your car for a jet—bold. He’s the guy who’d ask his boss for a pay cut just to prove a point—(uhhh…). He is like watching your kid take his first steps. Imagine Bill Gates struggling with rent—okay, maybe that’s a stretch, but you get the idea, yeah. Unbelievable? Yes. Inconceivable? Perhaps.
Edyme sees himself as a fairly reasonable guy, albeit a bit stubborn. Normal to you is not to him. He is not the one to take the easy road, and why would he? That’s just not the way he roll. He has these favorite lyrics from NF’s “Clouds” that resonate deeply with him: “What you think’s probably unfeasible, I’ve done already a hundredfold.”
PS—Edyme is HIM. HIM-buktu. Him-mulation. Him-Kardashian. Himon and Pumba. He even had his DNA tested, and guess what? He’s 100% Him-alayan. Screw it, he ate the opp.
Reason to trust
![]()
Strict editorial policy that focuses on accuracy, relevance, and impartiality
Created by industry experts and meticulously reviewed
The highest standards in reporting and publishing
Strict editorial policy that focuses on accuracy, relevance, and impartiality
Morbi pretium leo et nisl aliquam mollis. Quisque arcu lorem, ultricies quis pellentesque nec, ullamcorper eu odio.
Ethereum is trading above the $1,500 mark after a week of heightened volatility and continued global trade uncertainty. Macroeconomic tensions — driven by tariffs, shifting policies, and weakened investor sentiment — continue to weigh heavily on crypto markets. Despite the recent bounce, Ethereum’s price action still hints at a broader downtrend, with bulls struggling to reclaim key resistance levels that could trigger a meaningful recovery.
Related Reading
However, there are signs of potential strength ahead. If bulls manage to push ETH above immediate resistance zones, a bullish momentum shift could emerge. Market watchers are closely monitoring cost basis levels to identify where strong demand may resurface.
According to data from Glassnode, Ethereum’s Cost Basis Distribution reveals three key price clusters likely to shape short-term action. Among them, the $1,546 level stands out as the most significant, with 822,440 ETH previously accumulated in this range. A successful hold or breakout above this zone could provide a solid foundation for a larger recovery.
For now, Ethereum’s outlook remains cautiously neutral, with bulls needing to reclaim higher levels to shift sentiment and challenge the broader downtrend.
Ethereum Key Cost Basis Levels Could Define Price Action
Ethereum has lost over 50% of its value since early February, setting the stage for a challenging but potentially pivotal recovery phase. After months of heavy selling pressure, ETH is now trading just above the $1,500 mark, a zone that could serve as a springboard if bullish momentum builds. While the broader market has shown signs of recovery, Ethereum’s underwhelming price action continues to test investor patience. Still, analysts believe a recovery rally is possible, especially if macroeconomic sentiment improves.
Persistent global trade tensions, ongoing tariff battles, and US foreign policy shifts continue to inject volatility into financial markets. These factors have suppressed demand for risk assets like Ethereum, but some believe that the worst may be behind.
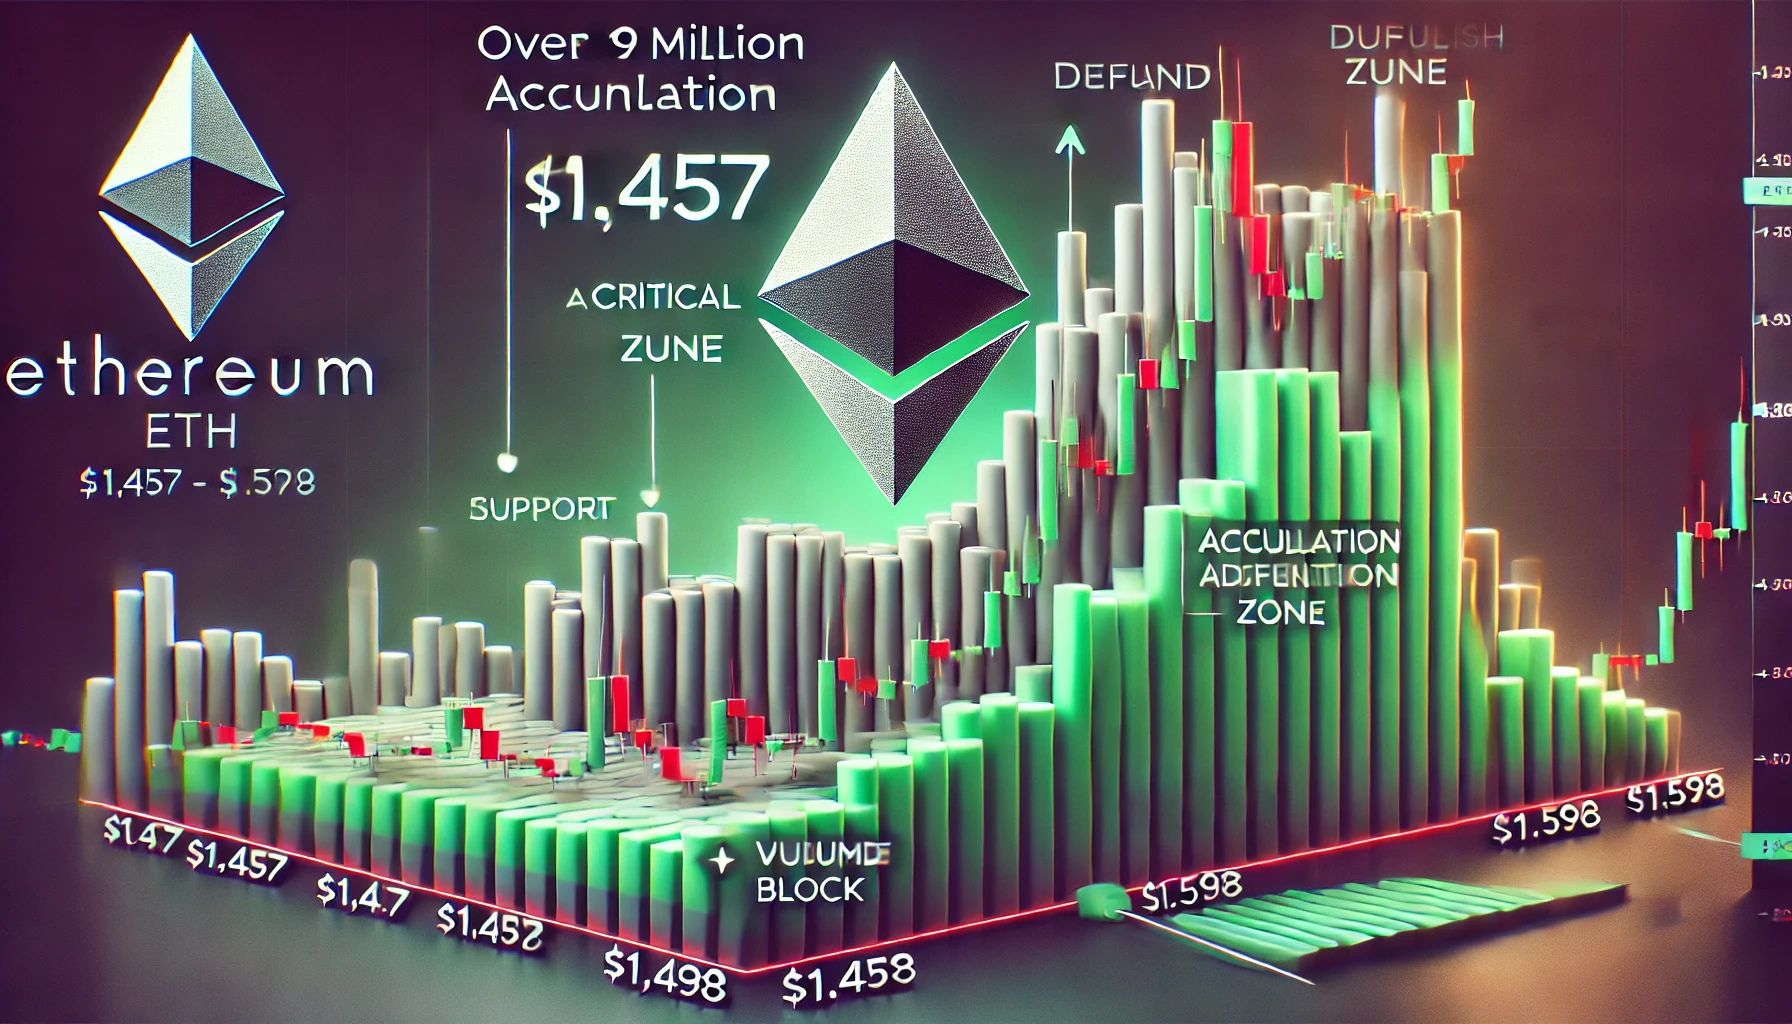
Glassnode’s on-chain data offers a more detailed look at Ethereum’s short-term outlook. According to their Cost Basis Distribution analysis, three price clusters are likely to shape ETH’s near-term price action. Around $1,457, roughly 408,000 ETH were previously accumulated. At $1,546, over 822,000 ETH sit, making it one of the most critical levels. Finally, approximately 725,000 ETH were acquired around $1,598.

These clusters reflect areas of high on-chain activity and are expected to act as support or resistance zones during the current phase of price consolidation. A breakout above the $1,600 level could trigger a more significant move toward $1,800 and beyond. For now, Ethereum’s price remains range-bound, but market participants are watching these levels closely for signs of a decisive shift.
Related Reading
ETH Faces Crucial Resistance As Bulls Fight to Regain Momentum
Ethereum is currently trading at $1,580 after failing to break above the $1,700 resistance level, signaling that bullish momentum remains weak. Despite a brief recovery from recent lows, ETH has struggled to reclaim higher ground, and key resistance levels continue to weigh on price action.
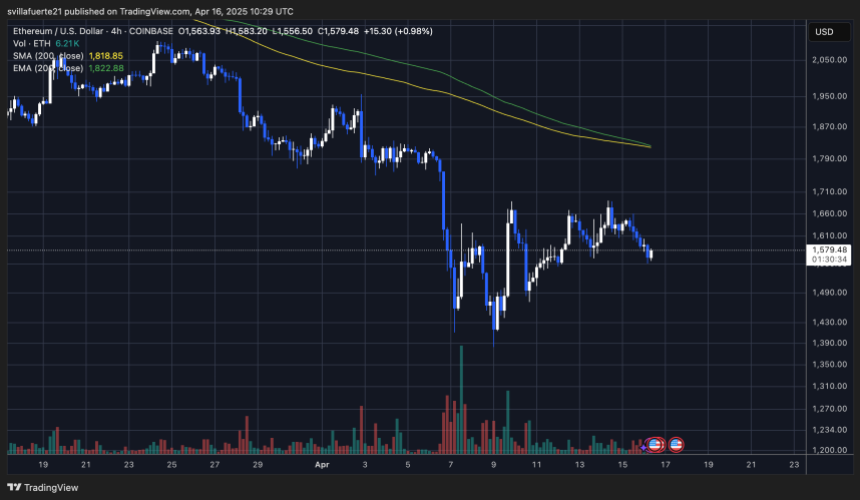
For bulls to confirm the start of a true recovery phase, Ethereum must push above the 4-hour 200 MA and EMA, both hovering around $1,820. A decisive move above these indicators would indicate renewed market confidence and open the door for a push toward critical demand levels around $2,000.
However, the risk of further downside remains. If Ethereum loses the $1,500 support level, selling pressure could accelerate, potentially driving the price below the $1,400 mark. This zone served as a key level in early 2023 and could be retested if bearish momentum builds.
Related Reading
With macroeconomic uncertainty and trade tensions still dominating the narrative, investors remain cautious. The next few trading sessions will be critical for ETH, as it hovers between potential recovery and the threat of renewed decline. Traders should watch for volume spikes and reaction around the $1,700 and $1,500 zones to assess the next move.
Featured image from Dall-E, chart from TradingView

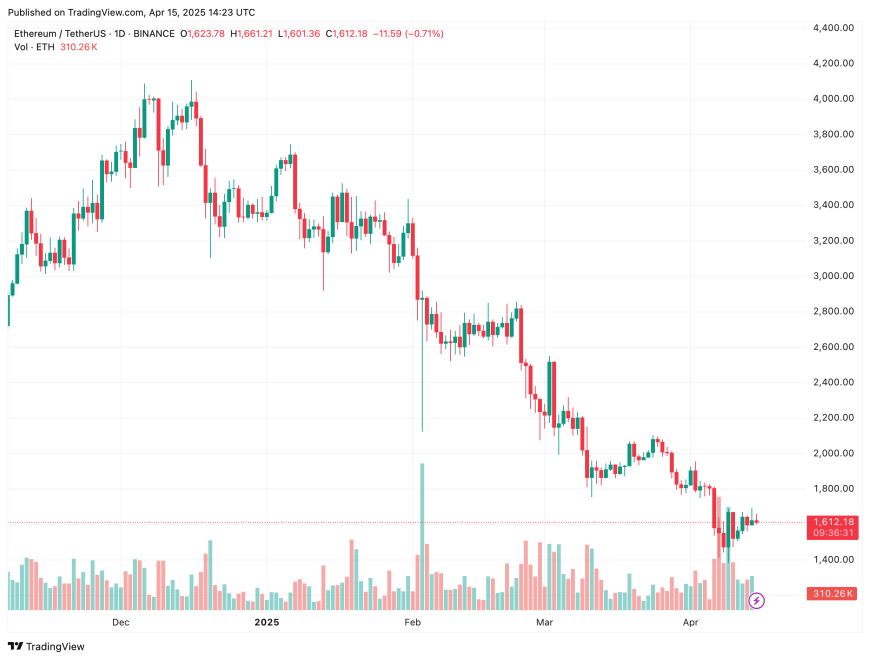
Ethereum (ETH) is down nearly 50% over the past year, eroding investor confidence in the second-largest cryptocurrency by market cap. However, crypto analysts suggest that ETH’s fortunes might be about to turn.
Ethereum Set For A Bullish Breakout?
Unlike Bitcoin (BTC), ETH has not significantly benefited from the bullish developments of 2024. While the approval of spot BTC exchange-traded funds (ETFs) opened the floodgates for institutional capital to flow into the top digital asset, ETH ETFs have failed to generate the same level of interest.
Moreover, ETH’s underperformance relative to BTC has only deepened. Crypto analyst Daan Crypto Trades shared the following two-week ETH/BTC chart showing how ETH has consistently broken through key high time-frame support levels against BTC over the past few years.

Currently, ETH is trading at levels not seen since 2020 relative to BTC. According to the analyst, the final major ETH/BTC support lies around 0.016 – nearly 20% below the current level of 0.019.
On a more optimistic note, fellow analyst Ted pointed out that ETH may be breaking out of a downward-sloping trendline on the two-hour chart. He commented:
Global markets are gaining some strength, so expect Ethereum to hold the $1,550-$1,600 level. For now, I’m hoping for a breakout above and close above $1,670 for a rally towards $2K.
Similarly, seasoned analyst Titan of Crypto highlighted that ETH appears poised to break out from an ascending triangle pattern on the weekly time frame. According to him, ETH is currently trading at the bottom of the structure and could be setting up to test the top of the formation around $3,600.

For the uninitiated, the ascending triangle is a continuation pattern that forms when price makes higher lows while facing resistance at a horizontal level, eventually creating a triangle shape. It signals building buying pressure, and a breakout above the resistance line often leads to a strong upward move.
Rising ETH Exchange Reserves Could Suppress Price
While the analysts above point to a potential bullish reversal for ETH, crypto analyst Ali Martinez noted that over 368,000 ETH has been sent to exchanges since the beginning of the month. A rise in exchange reserves for a digital asset is typically bearish news, as it indicates that holders may be looking to sell their assets in the near-term.
Additionally, even if ETH has already bottomed for this market cycle, it still faces strong resistance around the $2,300 mark. At press time, ETH trades at $1,612, down 2.7% over the past 24 hours.
Featured Image from Unsplash.com, charts from X and TradingView.com
Editorial Process for bitcoinist is centered on delivering thoroughly researched, accurate, and unbiased content. We uphold strict sourcing standards, and each page undergoes diligent review by our team of top technology experts and seasoned editors. This process ensures the integrity, relevance, and value of our content for our readers.
Analyst Claims Pi Network’s Momentum Is Building Fast As Pi Coin Looks To Reclaim $1

MANEKI Leads With 333% Rally

XRP Continues To Outpace ETH For 5 Months; What Lies Ahead?
Bitcoin Price Poised for $90,000 Surge
Why XRP Could Beat Dogecoin, Solana In ETF Race And Trigger A Price Surge

Expanding Blockspace and Enhancing Privacy

2.52 Million Altcoins Are Ruining Crypto’s Future

Animoca Brands Valuation Tanks 75% In Two Years, Here’s Why

Crypto exchange BingX hacked for $43 million

Are The Big Players Losing Interest?

Hong Kong’s Securities Association Tips Authorities On Crypto Self-Regulation

Coinbase cbBTC Set to go Live on Solana
2.52 Million Altcoins Are Ruining Crypto’s Future
Animoca Brands Valuation Tanks 75% In Two Years, Here’s Why
Crypto exchange BingX hacked for $43 million
Are The Big Players Losing Interest?
Hong Kong’s Securities Association Tips Authorities On Crypto Self-Regulation
Coinbase cbBTC Set to go Live on Solana
-
 Altcoin21 hours ago
DOGE Whale Moves 478M Coins As Analyst Predicts Dogecoin Price Breakout “Within Hours”
-

 Market23 hours ago
How It’s Impacting the Network
-
 Altcoin23 hours ago
Analyst Reveals Why The Solana Price Can Still Drop To $65
-

 Market22 hours ago
Raydium’s New Token Launchpad Competes with Pump.fun
-

 Market21 hours ago
Pi Network Drops10% as Outflows Surge, Death Cross Looms
-

 Market19 hours ago
Bitcoin and Ethereum Now Accepted by Panama City Government
-

 Ethereum19 hours ago
Over 1.9M Ethereum Positioned Between $1,457 And $1,598 – Can Bulls Hold Support?
-

 Bitcoin17 hours ago
ETF Issuers Bring Stability to Bitcoin Despite Tariff Chaos
