
Ethereum
Can Solana Replicate Ethereum’s Run To Reach $1,000? Expert Answers

A crypto market expert has expressed bullish optimism for Solana (SOL), predicting that the cryptocurrency is currently on track to replicate Ethereum’s historical rise to new highs. As a result, the expert foresees SOL hitting new all-time highs of $1,000 this bullish cycle.
Solana Sets Sights On $1,000
On August 12, a crypto analyst identified as ‘Kaleo’ on X (formerly Twitter) shared his optimistic expectations for Solana’s future outlook during this bull market. Kaleo observes that the Solana’s price chart was currently replicating a pattern previously seen in Ethereum in late 2020.
Related Reading
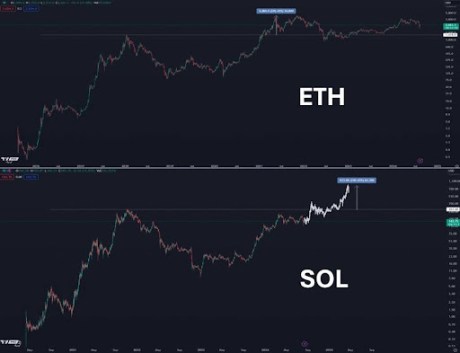
Comparing Solana’s market movement with that of Ethereum at the time, the analyst disclosed that SOL may be following a similar growth trajectory to Ethereum’s past performance in the last cycle. He noted that Ethereum had experienced a significant price increase in 2020, eventually reaching new all-time highs.
Based on Solana’s current price movements, Kaleo predicts that the cryptocurrency could reach a reasonable target of $1,000 during the present bull market. This potential price increase is rooted in the assumption that Solana will mirror Ethereum’s bullish price action in the previous cycle.
Since the beginning of the year, Solana’s price performance has been notably bullish, witnessing significant price surges that have pushed it as high as $200 at some point. Although the cryptocurrency has experienced its fair share of price declines, recording a more than 9% drop over the past week. As of the latest update, the price of the cryptocurrency is trading at $143.6, marking a 0.48% increase in the last 24 hours, according to CoinMarketCap.
Given Solana’s relatively strong price fundamentals amidst market volatility, crypto analysts continue to express bullish expectations for the altcoin. A crypto analyst identified as ‘Crypto Jack’ has noted that Solana is steadily approaching critical resistance levels. He predicts that if the cryptocurrency breaks above $190, it could be poised for an explosive rally to the upside soon.
Analysts Double Down On Solana’s $1,000 Bull Rally
Sharing similar bullish projections with Kaleo, a crypto analyst recognised as ‘Crypto Curb’ on X has revealed new price targets for Solana. According to Curb’s post, Solana is set to experience a steady price increase before reaching a new high at $1,000.
Related Reading
Sharing a price chart of Solana’s movement from 2021 to 2024, the analyst disclosed that SOL has been consolidating between the $120 to $210 mark for the past 170 days. During this time, the cryptocurrency was seen bouncing between monthly support and resistance levels.
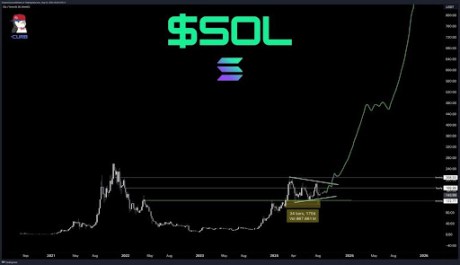
Curb predicts that once Solana emerges from its ongoing consolidation phase, the cryptocurrency is likely to see a substantial upward movement. He anticipates a rapid climb to the $400 to $500 range first, followed by an even larger increase to between $800 and $1,000 or more.
Pictured image from Dall-E, chart from Tradingview.com


Reason to trust
![]()
Strict editorial policy that focuses on accuracy, relevance, and impartiality
Created by industry experts and meticulously reviewed
The highest standards in reporting and publishing
Strict editorial policy that focuses on accuracy, relevance, and impartiality
Morbi pretium leo et nisl aliquam mollis. Quisque arcu lorem, ultricies quis pellentesque nec, ullamcorper eu odio.
As Ethereum (ETH) continues to experience a significant price downturn, recording a 17% drop over the past month, key resistance levels have emerged as critical points for the second-largest cryptocurrency. Analysts suggest that these levels could ignite a potential trend reversal if reclaimed.
Ethereum Faces Potential Decline To $1,155
In a recent update shared on social media platform X (formerly Twitter), crypto analyst Ali Martinez highlighted two pivotal price points for Ethereum’s immediate future.
The first, set at $2,100, is seen as a necessary threshold for initiating a new upward trend. However, the $2,300 mark is regarded as a “more decisive” level that Ethereum must breach to confirm a bullish reversal.
Related Reading
Martinez’s analysis, based on the one-day chart seen below, indicates that if Ethereum fails to reclaim these levels, it may lead to a further decline.

The next target points to watch would be $1,600 and $1,155, levels that could indicate a new downtrend. Such a decline would represent additional losses of 12% and over 37%, respectively, marking a troubling continuation of Ethereum’s worst first quarter in its history.
In another post, the analyst also pointed out that the Ethereum price is facing a significant resistance wall between $2,200 and $2,580. On-chain data from the analytics firm IntoTheBlock reveals that approximately 12.43 million investors have bought about 66.18 million ETH within this price range.
A breakout above these levels could potentially generate bullish momentum for the cryptocurrency. However, bullish catalysts that could trigger a move above these levels remain scarce among experts.
ETH’s Largest Accumulation Zone Under Threat
Market intelligence firm Glassnode has indicated that ETH’s Cost Basis Distribution shows limited support near current prices. Weekly data suggests that addresses with a cost basis around $1,800 have not re-engaged. Many investors are reportedly selling at a loss, further adding to the current price uncertainty.
On March 28, several clusters of approximately 250,000 ETH with cost bases between $2,000 and $2,050 effectively vanished, indicating that some higher-cost holders are attempting to average down their positions.
However, Glassnode asserts that the overall Ethereum accumulation zone appears limited at current price levels, raising questions about future stabilization for the second largest cryptocurrency.
Related Reading
The largest accumulation zone below the current market price now sits at $1,537, where nearly 994,000 ETH was acquired. If the downtrend continues, this level is expected to serve as structural support in the near term, potentially providing a buffer against further declines.
ETH is currently trading at $1,830, down 12% for the week.
Featured image from DALL-E, chart from TradingView.com


A quant has revealed how Ethereum (ETH) saw a death cross in this indicator shortly before bearish momentum took the asset in full force.
Ethereum Formed A Death Cross In Funding Rates Earlier
In a CryptoQuant Quicktake post, an analyst has shared a chart for the Funding Rates of Ethereum. The “Funding Rates” refers to a metric that keeps track of the amount of periodic fee that traders on the derivatives market are exchanging between each other right now.
When the value of this indicator is positive, it means the long contract holders are paying a premium to the short investors in order to hold onto their positions. Such a trend suggests a bullish sentiment is shared by the majority of the derivatives traders.
On the other hand, the metric being under the zero mark implies a bearish mentality is dominant in the sector, as short holders are overwhelming the long ones.
Now, here is the chart for the Ethereum Funding Rates posted by the quant, which shows the trend in the 50-day and 200-day simple moving averages (SMAs) of the indicator over the last couple of years:

Looks like these two lines saw a crossover earlier in the year | Source: CryptoQuant
As displayed in the above graph, the 50-day SMA of the Ethereum Funding Rates crossed under the 200-day SMA in January of this year. This suggests that the optimism in the market witnessed a shift.
From the graph, it’s visible that since the crossover in the two SMAs of the indicator has emerged, the ETH price has been sharply moving down. The trend isn’t unique to the asset, as the wider cryptocurrency sector has also seen a similar pattern, with investors becoming risk-averse.
In the first half of last year, the Funding Rates observed the same type of crossover, and then, the Ethereum price followed up with a period of bearish action.
It wasn’t until the reverse crossover happened, with the 50-day SMA finding a break above the 200-day SMA, that bullish momentum returned in the cryptocurrency market. The same pattern was also seen back in 2023.
It’s possible that for constructive price action to return for Ethereum and other assets, a bullish crossover in the Funding Rates may once again have to take place. “When the speculators return and start using their greedy leverage, the crypto bull market will begin,” notes the analyst.
When this would happen, however, is anyone’s guess, as the 50-day and 200-day SMAs of the indicator are currently quite far apart. In 2024, the lines took many months before they crossed back, so it’s possible that it will take some time for the crossover to occur now as well.
ETH Price
Ethereum is moving to end the month of March on a red note as its price has fallen to the $1,800 level, after seeing a decline of almost 14% in the past week.
The trend in the ETH price over the last five days | Source: ETHUSDT on TradingView
Featured image from Dall-E, CryptoQuant.com, chart from TradingView.com
Editorial Process for bitcoinist is centered on delivering thoroughly researched, accurate, and unbiased content. We uphold strict sourcing standards, and each page undergoes diligent review by our team of top technology experts and seasoned editors. This process ensures the integrity, relevance, and value of our content for our readers.

Comparing current price action with past performances, Ethereum, the second-largest crypto asset, seems to have witnessed its worst-ever first quarter as it draws closer to its end. However, many investors are expressing interest in ETH’s prospects again, purchasing the asset in huge chunks.
Investors Buying The Ethereum’s Price Dip
Ethereum has continued to struggle to undergo a major upward move even as other digital assets make history in the ongoing market cycle. Despite the recent pullback in ETH’s price, Ali Martinez, a seasoned crypto analyst and trader, has highlighted a renewed bullish sentiment among investors.
Specifically, investors are seizing the opportunity to stack up on ETH in light of ongoing price correction, signaling interest and confidence in the asset’s long-term potential. This buying activity suggests that seasoned traders are considering the current drop as a strategic entry or buying point.
According to Ali Martinez, the development was spotted as Ethereum encountered a significant resistance wall between the $2,200 and $2,580 price mark. Examining the data from IntoTheBlock, the expert reported that over 12.43 million investors purchased a massive portion of 66.18 million ETH within the $2,200 and $2,580 price zones.
These kinds of accumulation show that both retail and institutional investors are hopeful about the market. Should this substantial buying activity extend, Ali Martinez is confident that bullish momentum might build up for ETH, leading to a break above the zone.

Market analyst and trader CryptoELITES predicts a robust upswing for ETH to new all-time highs in the upcoming weeks. CryptoELITES prediction is based on past price trends in which ETH witnessed a massive rally after a lengthy period of downward movements.
Delving into the recent price action, the expert believes ETH’s correction has reached a bottom similar to the 2017 and 2021 bull market cycles. With the altcoin potentially reaching a bottom, CryptoELITES anticipates an over 700% upsurge in 2025.
A 700% surge will bring the altcoin’s price to the $15,000 milestone before the ongoing bull market cycle completes. Given that Ethereum is mirroring past trends, a possible price reversal could be on the horizon.
ETH Eyeing A Breakout From Key Chart Pattern
While ETH is facing volatility, it is presently at a critical junction that might determine its next move. Jonathan Carter, a crypto and technical analyst, reveals that Ethereum is holding above the lower boundary of a Descending Triangle formation after navigating its price in the 4-hour time frame.
At this zone, the asset might muster enough momentum for a rebound. Carter expects a bounce from the current support zone to push ETH toward key resistance levels at $1,950, $2,080, $2,230, and $2,320. However, if the altcoin falls below the support, the price may drop further to the downside.
Featured image from Pexels, chart from Tradingview.com
Editorial Process for bitcoinist is centered on delivering thoroughly researched, accurate, and unbiased content. We uphold strict sourcing standards, and each page undergoes diligent review by our team of top technology experts and seasoned editors. This process ensures the integrity, relevance, and value of our content for our readers.

Bitcoin Stuck in Place as Tariffs and Charts Point Both Ways

BTC, ETH, XRP, DOGE Fall Following Weak PMI, JOLTS Data
Trump’s USD1 Stablecoin Eyes Trust Recovery in Crypto

Will XRP, SOL, ADA Make the List?

Ethereum Reclaims Top DeFi Spot As Solana DEX Volume Drops

Coinbase Stock Plunges 30% in Worst Quarter Since FTX Collapse


-
 Market22 hours ago
Trump Family Gets Most WLFI Revenue, Causing Corruption Fears
-

 Ethereum21 hours ago
Ethereum’s Price Dips, But Investors Seize The Opportunity To Stack Up More ETH
-

 Market24 hours ago
Pi Network Struggles, On Track for New All-Time Low
-
 Bitcoin23 hours ago
Strategy Adds 22,048 BTC for Nearly $2 Billion
-

 Market23 hours ago
BNB Breaks Below $605 As Bullish Momentum Fades – What’s Next?
-

 Market18 hours ago
BlackRock’s Larry Fink Thinks Crypto Could Harm The Dollar
-

 Ethereum23 hours ago
Ethereum Price Confirms Breakout From Ascending Triangle, Target Set At $7,800
-
 Altcoin17 hours ago
Charles Hoskinson Reveals How Cardano Will Boost Bitcoin’s Adoption
 Arabic
 Chinese (Simplified)
 Dutch
Dutch English
 French
 German
 Italian
 Portuguese
 Russian
 Spanish
 Vietnamese