
Ethereum
Are ETH Bulls Preparing For A 100% Surge?

Ethereum is pushing higher, as shown in the daily chart. After last week’s dip and recovery, the second most valuable coin is up nearly 25% from August lows. If buyers take charge today, clearing and closing above $2,600, as is currently the case, it could anchor the base of another uptick toward $3,300 in a buy trend continuation formation.
66% Of All Ethereum Addresses Are In Profit
The possibility of this price action panning out is highly likely. According to IntoTheBlock data, Ethereum is at an intriguing phase and is impressively shaking off weakness seen in the first half of the week.
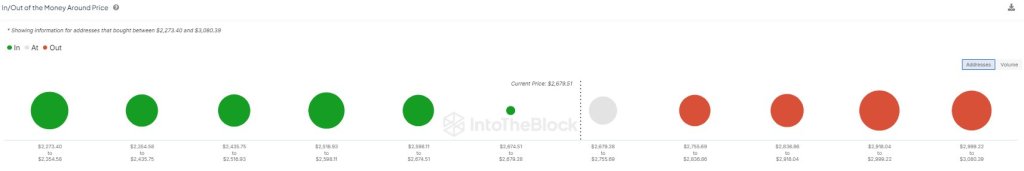
IntoTheBlock data notes that 66% of Ethereum addresses are in green at spot rates. This development means many holders profit despite the past five months’ volatility and ups and downs after prices peaked in March 2024.
The fact that a large percentage of holders are in profit is bullish and may mean more ETH holders are willing to hold on and see how price action prints out in the coming days.
Typically, whenever a larger percentage of addresses are in the red and losing money, they may seek to exit in a panic, in a self-preservation mode, protecting their bottom line.
Though this is also possible now that prices are rising, entities who may cash out now could miss out on even bigger gains, at least if the past guides. According to IntoTheBlock data, the last time 66% of all ETH addresses were in profits was back in October 2023.
ETH Holders Accumulating, Are Bulls Ready To Take Over?
Around October 2023, looking at historical price action, ETH bounced higher before rallying strongly in the coming months to March 2024, reaching $4,100. While this impressive past performance doesn’t necessarily mean it will be replicated in the days ahead, the recovery of the last few days and other market factors may prop up optimistic buyers.
By the end of last week, CryptoQuant data showed that addresses holding between 10 and 10,000 ETH and those holding between 10,000 and 100,000 ETH were busy buying. Their activity saw these cohorts cumulatively add 757,000 ETH, a huge sentiment boost.
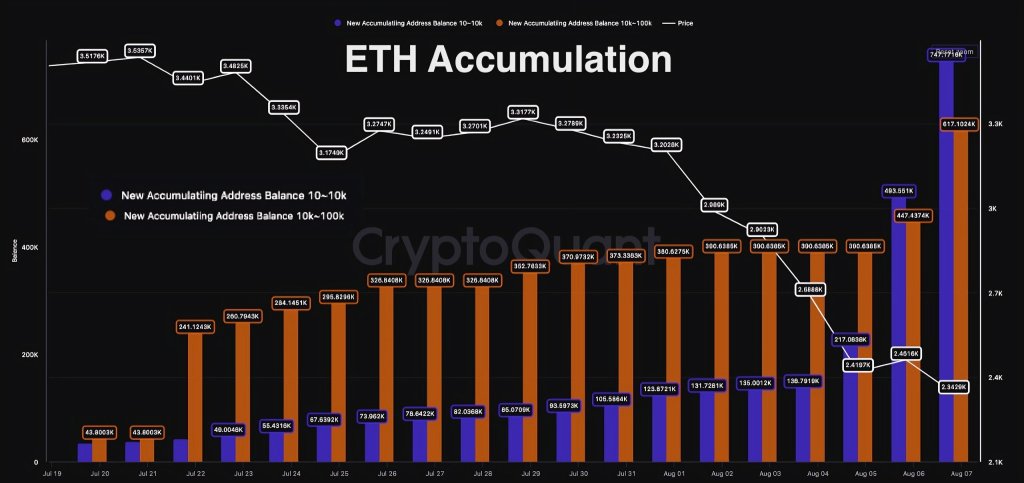
That these entities are loading up suggests that they are optimistic about what lies ahead, a net positive for bulls. As of August 12, Ethereum faces headwinds at around $2,700, or August 5 highs.
For the uptrend to continue, there must be a sharp close above this level, ideally with rising volume. This expansion may form the base of a leg-up that may see ETH fly to a July 2024 high of $3,500 in a buy trend continuation formation.
Feature image from Canva, chart from TradingView


Reason to trust
![]()
Strict editorial policy that focuses on accuracy, relevance, and impartiality
Created by industry experts and meticulously reviewed
The highest standards in reporting and publishing
Strict editorial policy that focuses on accuracy, relevance, and impartiality
Morbi pretium leo et nisl aliquam mollis. Quisque arcu lorem, ultricies quis pellentesque nec, ullamcorper eu odio.
The Ethereum price crash to $1,400 has shaken the crypto market, amplifying already volatile conditions. This dramatic price drop comes after a major ETH sell-off by US President Donald Trump’s World Liberty Finance, suggesting that the recent dump may have been a primary catalyst behind ETH’s price collapse.
Blockchain analytics platform Lookonchain revealed on April 9 via X (formerly Twitter) that the wallet associated with World Liberty Finance, a decentralized finance protocol linked to Trump, recently dumped a significant amount of Ethereum. Interestingly, this sell-off came just before Ethereum’s price crash, raising the question of whether it contributed to the unexpected decline.
Donald Trump‘s World Liberty Finance Dumps ETH
Launched in 2024, World Liberty Finance is Trump’s controversial digital asset firm designed to rival centralized banking and facilitate the adoption of stablecoins. According to data from Lookonchain, Trump’s World Liberty Finance, which was previously accumulating Ethereum at a low price, is now selling off a large chunk of its holding at a steep loss.
Related Reading
Lookonchain flagged the transaction, noting that the wallet linked to World Liberty Finance had offloaded 5,471 ETH tokens worth roughly $8.01 million. The sell-off was executed at a price of $1,465 per ETH, a significant drop from its previous value of over $1,600.
Notably, World Liberty Finance’s ETH sell-off move has raised eyebrows across the crypto community. It appears to mark a shift in strategy for a player who was previously known for large-scale ETH accumulation.
According to Lookonchain, the wallet address linked to World Liberty Finance had accumulated a total of 67,498 ETH at an average price of $3,259. This means that the decentralized finance protocol spent a total of $210 million to amass such a large amount of ETH.
At its sell-off price, this leaves the entity sitting on a staggering unrealized loss of around $125 million. The recent sell-off also adds more fuel to the growing uncertainty surrounding Ethereum’s future outlook, as the cryptocurrency’s recent price crash has sparked even more bearish predictions of continued decline.
Although the reason behind World Liberty Finance’s unexpected ETH sell-off remains unclear, some believe that the dump was likely triggered by Ethereum’s ongoing price decline, while others suggest it could signal a market bottom.
Ethereum Price Crash To $1,400
Ethereum’s price decline to $1,400 came as a shock to the market, making it the first time the cryptocurrency had fallen so low in seven years. Notably, Ethereum was not the only leading cryptocurrency that was affected by the market turmoil, as big players like Bitcoin also suffered losses.
Related Reading
Currently, Ethereum seems to be recovering slightly from its previous low and is now trading at $1,591 after jumping 7.44%. Although this recovery brings hope of a rebound, the cryptocurrency’s value has still dropped by 16.63% over the past month. Moreover, technical indicators from CoinCodex highlight that sentiment surrounding the cryptocurrency is still deeply bearish, suggesting that further declines could be on the horizon.
Featured image from Unsplash, chart from Tradingview.com
Reason to trust
![]()
Strict editorial policy that focuses on accuracy, relevance, and impartiality
Created by industry experts and meticulously reviewed
The highest standards in reporting and publishing
Strict editorial policy that focuses on accuracy, relevance, and impartiality
Morbi pretium leo et nisl aliquam mollis. Quisque arcu lorem, ultricies quis pellentesque nec, ullamcorper eu odio.
Ethereum saw a dramatic turnaround this week, bouncing over 21% from its recent low of $1,380 in just hours. The sharp recovery came in response to an unexpected shift in macroeconomic policy: US President Donald Trump announced a 90-day pause on reciprocal tariffs for all countries—except China, which now faces a steep 125% tariff. The news sent a ripple through global markets, sparking a short-term rally in risk assets, including crypto.
Related Reading
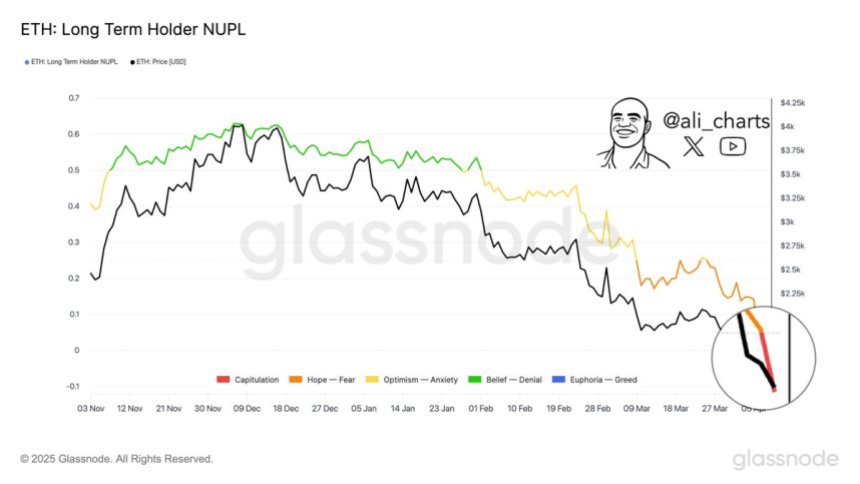
Ethereum, which had been under heavy selling pressure for weeks, appears to have found temporary relief. According to Glassnode data, long-term Ethereum holders are starting to fold, offloading positions at a loss after months of decline. Historically, these moments of long-term holder capitulation have often marked bottoming phases and preceded meaningful rebounds.
While short-term volatility remains elevated, some analysts view this setup as a potential opportunity zone, especially for contrarian investors looking to accumulate during peak fear. The market now watches to see if ETH can hold its gains or if broader uncertainty will drag prices back down. One thing is clear: the next few days could be pivotal for Ethereum’s trend heading into the second half of 2025.
Ethereum Finds Relief Amid Chaos, But Market Remains On Edge
Ethereum is now at a pivotal crossroads after enduring weeks of relentless selling pressure and uncertainty. The recent surge from sub-$1,400 levels has offered a glimmer of hope, as bulls begin to push back against the downtrend. This bounce follows aggressive volatility not just in crypto but across global equities, with price action rocked by continued geopolitical unrest and macroeconomic instability. US President Donald Trump’s unpredictable stance on tariffs remains a wildcard, keeping global markets on edge.
Since peaking in late December, Ethereum has shed over 60% of its value, triggering growing concern that a full-scale bear market may be unfolding. Many investors have already exited positions, while others remain sidelined waiting for clarity. Still, some see opportunity.
According to top analyst Ali Martinez, long-term Ethereum holders have now entered what’s commonly referred to as “capitulation” mode—a stage when even the most patient investors begin to fold under pressure. Martinez believes this could present a rare window for contrarian buyers. “For those watching risk-reward dynamics, this phase has historically marked prime accumulation zones,” he shared on X.
While Ethereum’s path forward is still uncertain, current sentiment suggests that a critical test is underway—one that could determine whether this recovery has legs, or if further pain lies ahead.
Related Reading
Bulls Look To Confirm Recovery With Key Breakout
Ethereum is showing signs of short-term strength as it forms an “Adam & Eve” bullish reversal pattern on the 4-hour chart. This classic technical formation, which starts with a sharp V-shaped low followed by a rounded bottom, often signals a potential breakout if price action holds and follows through. For Ethereum, reclaiming the $1,820 level is the first step to confirm this bullish structure.
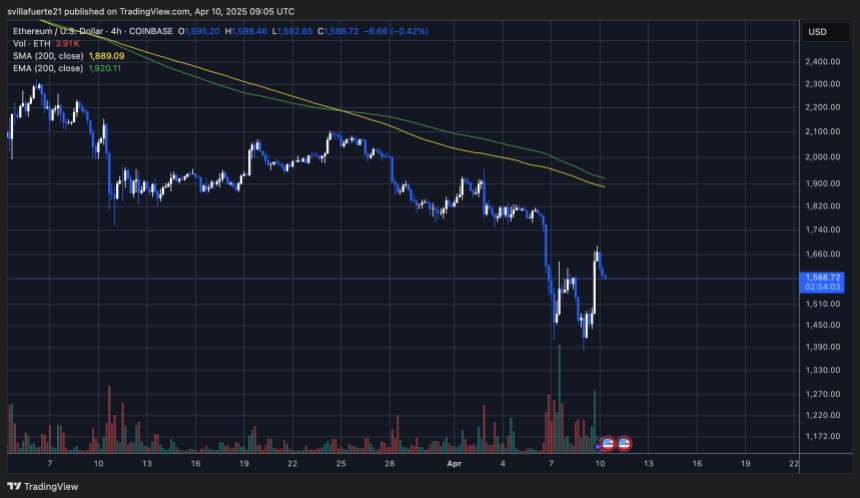
If bulls can push ETH above this level with conviction, the next key challenge lies at the 4-hour 200 moving average (MA) and exponential moving average (EMA), both of which converge around the $1,900 mark. A decisive breakout through this zone would validate the recovery setup and could kickstart a more sustained move higher.
Related Reading
However, failure to reclaim the $1,800 level in the coming days may keep ETH stuck in a consolidation range. If rejected, price could remain rangebound between current levels and the lower support area near $1,300, where ETH recently bounced. For now, all eyes are on how price reacts to the resistance levels ahead, as bulls aim to regain control and shift the short-term momentum in their favor.
Featured image from Dall-E, chart from TradingView

Ethereum has suffered yet another blow this week, sliding to a fresh low of around $1,380 — a level not seen since March 2023. The ongoing downtrend has left investors increasingly concerned, with many now questioning whether ETH’s long-term bullish structure is still intact. Market conditions remain harsh, driven by persistent macroeconomic tensions, rising global instability, and uncertainty stemming from U.S. trade and fiscal policies.
Sentiment across the crypto space continues to deteriorate, and Ethereum’s price action reflects that unease. After months of struggling to hold key support levels, the breakdown below $1,500 has added to fears that a deeper correction may be unfolding.
However, amidst the gloom, there may be a silver lining. According to CryptoRank data, Ethereum is now trading below its realized price — a rare occurrence historically associated with market bottoms and strong recovery phases.
While the near-term outlook remains uncertain, such rare on-chain signals could indicate that Ethereum is entering a key accumulation zone. The coming days and weeks will be critical in determining whether this is just another leg down — or the beginning of a long-term reversal.
Ethereum Sinks Below Realized Price As Fear Takes Over The Market
Ethereum has now lost over 33% of its value since late March, triggering deep concern among investors and analysts alike. The price plunge has brought ETH down to levels not seen in over two years, sparking panic and despair among holders who once expected 2025 to be a breakout year for altcoins. Instead, Ethereum has become a symbol of market fragility as the broader macroeconomic landscape continues to worsen.
Trade war fears, inflationary pressure, and a potential global recession are shaking financial markets to their core. In this climate, high-risk assets like Ethereum are among the first to suffer. As capital exits speculative assets in favor of safer havens, ETH’s selloff has only accelerated — and investor confidence has taken a serious hit.
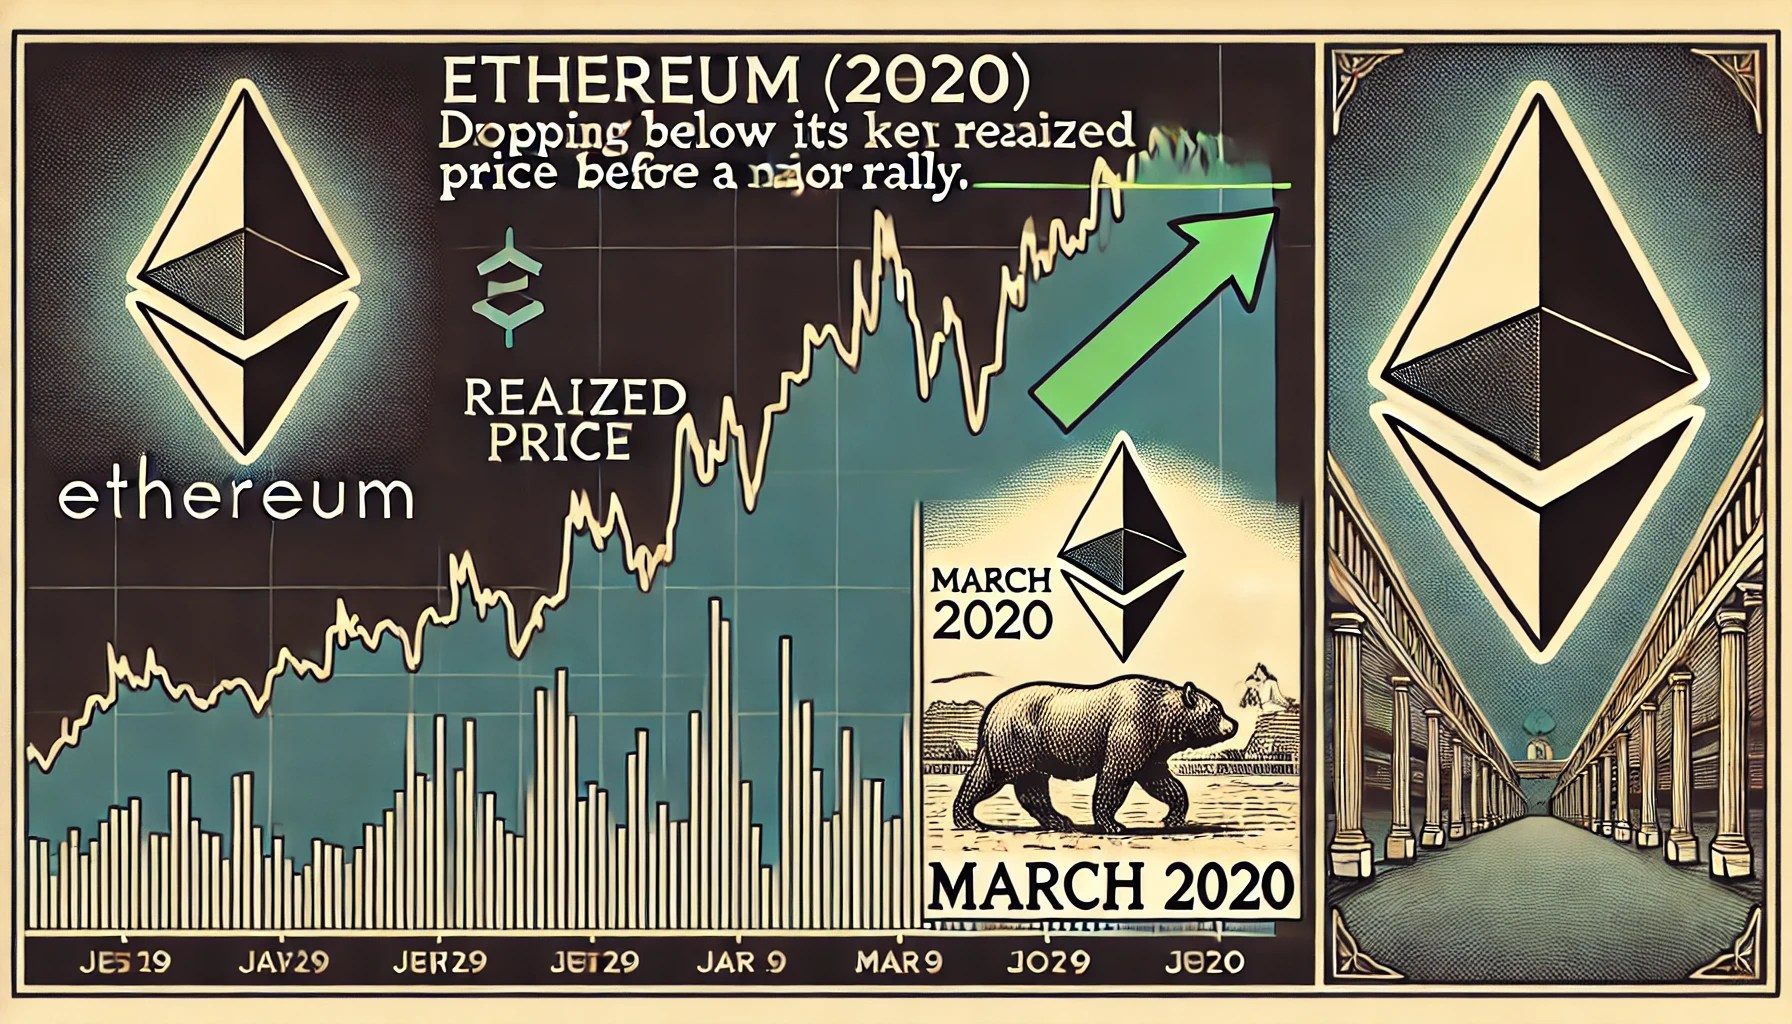
However, there may be a glimmer of hope in the data. Top crypto analyst Carl Runefelt recently pointed out on X that Ethereum is now trading below its realized price of $2,000 — a rare occurrence that has historically signaled major turning points in ETH’s price trajectory.
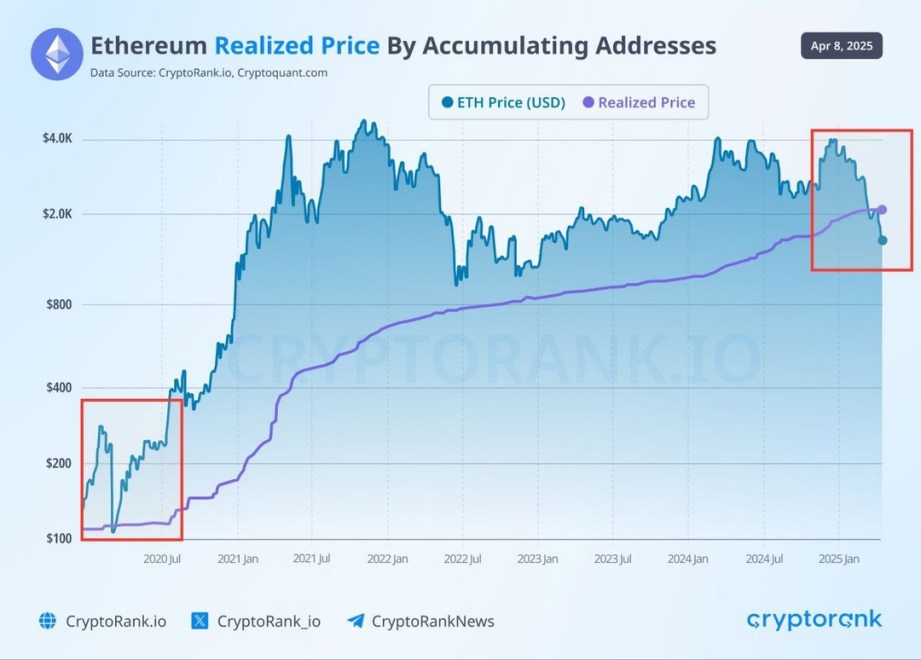
Runefelt emphasized that the last time ETH dipped below its realized price was in March 2020, when it crashed from $283 to $109 — only to recover strongly in the following months. While the current environment is full of uncertainty, such on-chain metrics hint at the possibility that ETH is entering an accumulation phase once again.
Still, confidence remains fragile, and price action must stabilize before any real bullish narrative can return. Ethereum’s next moves will be critical in determining whether this level marks a true bottom — or just another stop on the way down.
ETH Struggles Below $1,500 With No Clear Support in Sight
Ethereum is currently trading below the $1,500 level after suffering a brutal 50% decline since late February. The aggressive selloff has erased months of gains and left investors in a state of uncertainty, as ETH shows no signs of recovery. Market sentiment remains overwhelmingly bearish, and there is little indication that a bottom has been reached.
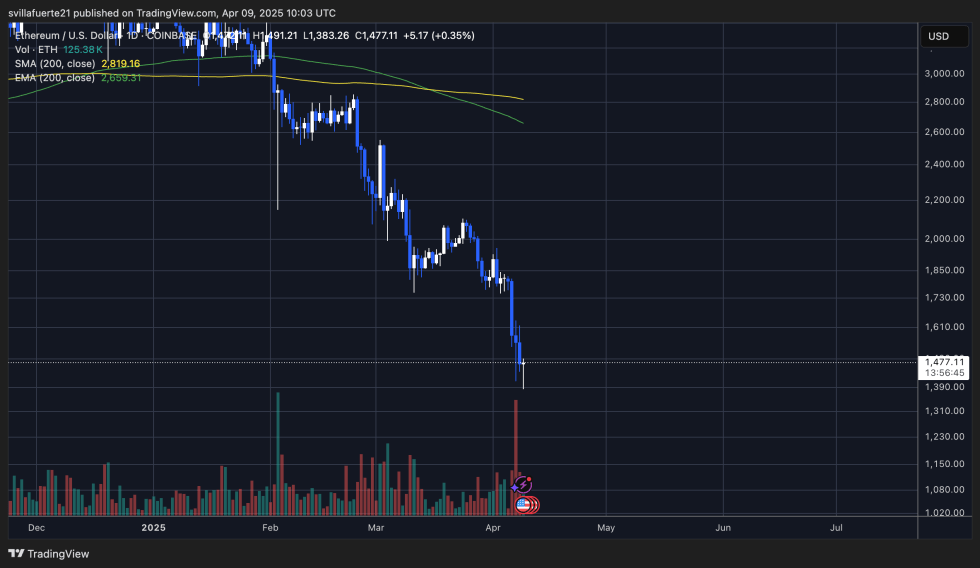
At this stage, Ethereum lacks a clearly defined support zone. Bulls have lost control, and price action continues to drift lower with weak demand and increasing fear. For a meaningful reversal to begin, ETH must first reclaim the $1,850 level — a zone that previously served as a key support and now stands as major resistance.
Until that happens, any upside attempt is likely to be met with strong selling pressure. The situation becomes even more precarious if Ethereum loses the $1,380 level, which has so far acted as a psychological threshold. Falling below this area could open the door to a deeper correction toward the $1,100–$1,200 range.
With macroeconomic tensions still high and volatility expected to persist, traders and investors will be watching closely to see whether Ethereum can stabilize — or continue its sharp decline.
Featured image from Dall-E, chart from TradingView
Editorial Process for bitcoinist is centered on delivering thoroughly researched, accurate, and unbiased content. We uphold strict sourcing standards, and each page undergoes diligent review by our team of top technology experts and seasoned editors. This process ensures the integrity, relevance, and value of our content for our readers.
Investors Shift to Crypto, Gold, and Equities Amid Tariff Volatility

How You Can Find Altcoin Winners Early

Binance, Trade Wars, Ripple and SEC

China Raises Tariffs on US to 125%, Crypto Markets Steady

Is Bitcoin Ready for Another Surge?

Sonic Surges to $1 Billion TVL in 66 Days Amid DeFi Market Slump

2.52 Million Altcoins Are Ruining Crypto’s Future

Animoca Brands Valuation Tanks 75% In Two Years, Here’s Why

Crypto exchange BingX hacked for $43 million

Are The Big Players Losing Interest?

Hong Kong’s Securities Association Tips Authorities On Crypto Self-Regulation

Coinbase cbBTC Set to go Live on Solana
2.52 Million Altcoins Are Ruining Crypto’s Future
Animoca Brands Valuation Tanks 75% In Two Years, Here’s Why
Crypto exchange BingX hacked for $43 million
Are The Big Players Losing Interest?
Hong Kong’s Securities Association Tips Authorities On Crypto Self-Regulation
Coinbase cbBTC Set to go Live on Solana
-

 Bitcoin24 hours ago
Florida Bitcoin Reserve Bill Passes House With Zero Votes Against
-

 Market20 hours ago
ADA Price Surge Signals a Potential Breakout
-

 Market23 hours ago
Fuser on How Crypto Regulation in Europe is Finally Catching Up
-
 Altcoin23 hours ago
Dogecoin (DOGE) Reclaims Previous Breakdown, Will This Mark The Bottom?
-

 Market22 hours ago
3 Bullish Altcoins Surging After Trump’s Tariff Pause
-

 Bitcoin20 hours ago
Bitcoin Holders are More Profitable Than Ethereum Since 2023
-

 Market10 hours ago
XRP Price Ready to Run? Bulls Eyes Fresh Gains Amid Bullish Setup
-

 Market19 hours ago
Ethereum Price Climbs, But Key Indicators Still Flash Bearish