Bitcoin
Here’s Why The Bitcoin Price Crashed Below $58,000

Bitcoin has dropped to as low as $58,000 in the last 24 hours, having failed to once again hold above the crucial support at $60,000. Different analysts have suggested that the CME gap caused this price decline and that BTC could enjoy a relief bounce going forward.
The CME Gap Caused Bitcoin To Decline Below $60,000
Crypto analyst Daan Crypto hinted in an X (formerly Twitter) post that Bitcoin experienced this recent price decline to close the CME gap around the $60,000 range. The CME gap is the difference between BTC’s price on the Chicago Mercantile Exchange (CME) futures market between when the market closed on Friday and reopened on Monday.
Related Reading: Is A Shiba Inu Comeback Imminent? 72,453% Surge In Burn Rate Could Send Price Flying

While sharing a chart of Bitcoin CME futures, crypto analyst Speed Racer also alluded to the CME gap as responsible for Bitcoin’s recent decline. He stated that the market makers were running the BTC market in the short term as there was no way they would leave a “$1650 CME gap from the weekend.”

Crypto analyst Ninja also explained that the recent price decline was caused by the CME gap and even tagged it as “bullish selling.” He assured that everything would be okay, with a market rebound likely on the cards. Ninja also urged market Bitcoin bulls not to panic, although he subtly admitted that the current market conditions are enough to make anyone panic.
Fortunately, the worst looks to be over, as Daan Crypto revealed that the CME gap has been fully closed. This suggests that Bitcoin should enjoy a relief bounce from its current price level. Crypto expert Michael van de Poppe also confirmed that the CME gap has closed and predicted that it’s time for BTC to bounce up.
Crypto analyst Titan of Crypto shared a similar sentiment while revealing that the CME gap has been filled. He claimed that nothing was holding Bitcoin back now and that it was time for the flagship crypto to send. From the chart the analyst shared, BTC could rise to $72,000 on its next leg up.

The CME Gap Might Not Be The Only Problem
Selling pressure on Bitcoin is another problem that is responsible for its price decline. Data from Farside Investors shows that the Spot Bitcoin ETFs are still witnessing huge net outflows, with fund issuers having to offload their BTC holdings to fulfil redemptions.
There is also significant selling pressure from the German government, which still appears to be selling its Bitcoin holdings based on data from Arkham Intelligence. This is in addition to concerns about the selling pressure that BTC could witness once the defunct crypto exchange Mt. Gox begins to repay its creditors about $9 billion worth of crypto.
At the time of writing, Bitcoin is trading at around $58,600, down over 3% in the last 24 hours, according to data from CoinMarketCap.
Featured image created with Dall.E, chart from Tradingview.com
Bitcoin
Altseason Dead On Arrival? Data Shows Bitcoin Outperforming All Categories


The first quarter of 2025 was dominated by talks of the altcoin season, as is usually the case when the bull cycle is ending. In past cycles, capital tends to rotate from Bitcoin to other cryptocurrencies as investors look for maximum gain before the arrival of the bear market.
However, the story has been very different for the cryptocurrency market so far this year, with most large-cap assets failing to enjoy the same capital rotation seen in past cycles. The latest on-chain data shows that Bitcoin has continued to dominate the crypto market, outperforming all categories of altcoins.
Is It Time To Buy Altcoins?
In an April 5 post on the X platform, pseudonymous analyst Darkfost shared an interesting on-chain insight into the performance of all altcoin categories relative to the world’s largest cryptocurrency. According to the online pundit, the altcoins are underperforming compared to Bitcoin in terms of market capitalization growth.
In their post, Darkfost compared the market cap growth of Bitcoin, large-cap altcoins (the top 20 largest altcoins), and mid-to-small cap altcoins by calculating the difference between their 365-day and the 30-day moving average (MAs). According to the analyst, the variation between the 365-day MA and the 30-day MA serves as an indicator of growth momentum.
Typically, when the short-term moving average (30-day MA) rises faster than the long-term moving average (365-day MA), it implies rapid market cap growth. On the flip side, a reduced growth momentum is indicated by a lagging 30-day moving average.
Source: @Darkfost_Coc on X
As observed in the chart above, Bitcoin is outpacing the large-cap and mid-to-small-cap altcoins in terms of their market cap growth. Darkfost noted that this difference in the growth ratio has reached a level last seen in October 2023, a period correlated with a brief altcoin rally and subsequently BTC’s dominance.
The analyst further highlighted that when this growth ratio turns negative, it often signals that a strong correction has occurred. Historically, a negative ratio might present a potential buying opportunity for investors looking to get into the market.
Bitcoin And Ethereum Price Quick Look
As of this writing, the price of BTC stands at around $83,500, reflecting no significant movement in the past 24 hours. At the same time, the ETH token is valued at around $1,805, with no change in the past day.
While the premier cryptocurrency dropped by about 15% in the first quarter of 2025, Ethereum lost almost double its value in the same period. This gap in performance underscores how woeful the “king of altcoins” has been in the past few months.
The price of BTC on the daily timeframe | Source: BTCUSDT chart on TradingView
Featured image from iStock, chart from TradingView

Editorial Process for bitcoinist is centered on delivering thoroughly researched, accurate, and unbiased content. We uphold strict sourcing standards, and each page undergoes diligent review by our team of top technology experts and seasoned editors. This process ensures the integrity, relevance, and value of our content for our readers.
Bitcoin
Bitcoin Traders’ Realized Losses Reach FTX Crash Levels — What’s Happening?


The price of Bitcoin has had an interesting performance so far in 2025, starting the year with a run to a new all-time high. However, the flagship cryptocurrency finished the year’s first quarter with over 15% of its value shaved off in those three months.
While the BTC price appears to be steadying within a consolidation range, the prognosis doesn’t look all positive for the world’s largest cryptocurrency. This explains why several short-term investors are getting frustrated and, as a result, exiting the market.
Is Bitcoin About To Go Up?
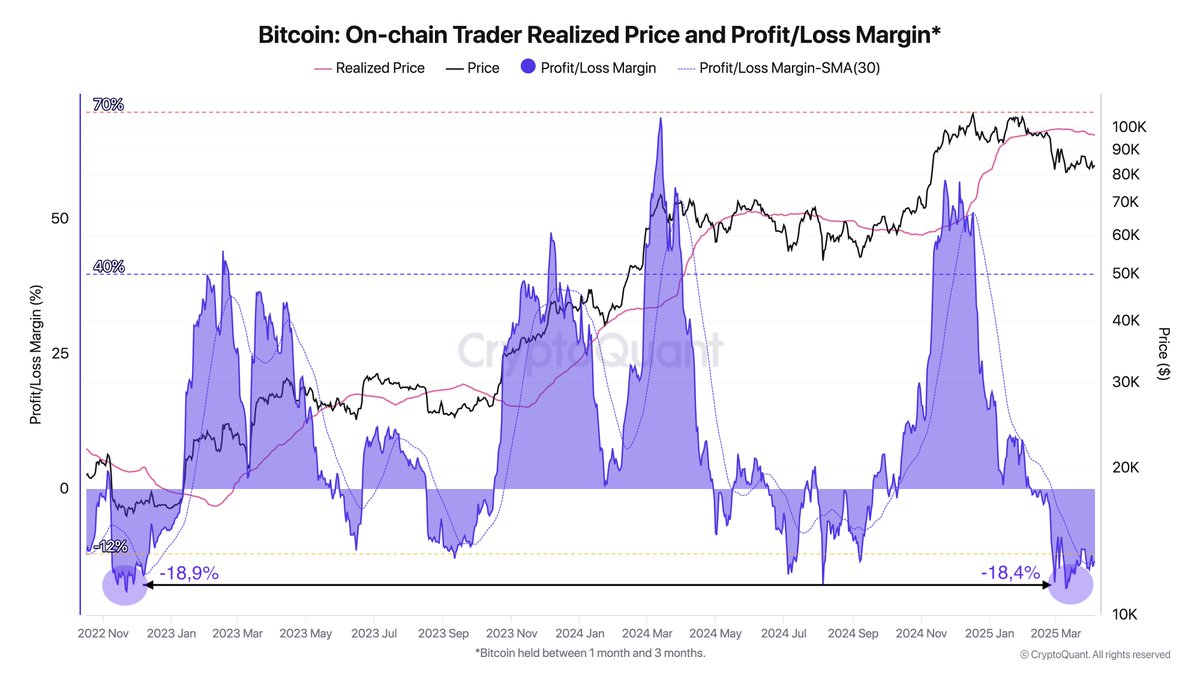
In a new post on the X platform, an on-chain analyst with the pseudonym Darkfost revealed that a certain class of Bitcoin holders have been selling their assets at a loss. According to the crypto pundit, the sell-offs are occurring at a rate not seen since the FTX collapse.
This on-chain observation is based on a significant drop in the Profit/Loss Margin, which tracks the profitability of investors by comparing their purchase price to the current price of a cryptocurrency. This metric offers insight into whether the market is in a state of unrealized profit or loss.
Specifically, Darkfost’s analysis focuses on Bitcoin investors who have been holding BTC for between one to three months (otherwise known as short-term holders). These traders are considered the most reactive class of holders, a trait highlighted by their recent activity.
Source: @Darkfost_Coc on X
According to Darkfost, BTC short-term holders have been offloading their coins at a loss since early February. These realized losses have now reached levels last seen in the FTX crash and are even higher than the losses recorded during the 2024 price pullback.
Historically, significant loss realization by the Bitcoin short-term holders has preceded substantial upward price movements, especially when long-term holders continue to accumulate. Hence, the persistence of this trend means that long-term investors will take the coins off the weak hands before the next bullish jump.
BTC Price At A Glance
As of this writing, the price of BTC stands at around $83,700, reflecting no significant change in the past 24 hours. According to data from CoinGecko, the market leader is up by 1% in the last seven days.
The price of Bitcoin is thickening around the $84,000 level on the daily timeframe | Source: BTCUSDT chart on TradingView
Featured image from iStock, chart from TradingView

Editorial Process for bitcoinist is centered on delivering thoroughly researched, accurate, and unbiased content. We uphold strict sourcing standards, and each page undergoes diligent review by our team of top technology experts and seasoned editors. This process ensures the integrity, relevance, and value of our content for our readers.
Bitcoin
Bitcoin (BTC) To Take Off In June, Analyst Pins Market Target At $175,000


Since hitting a new all-time high in January, Bitcoin (BTC) has struggled to establish a bullish form resulting in a downtrend that has lasted over the last two months. According to prominent market analyst Egrag Crypto, the premier cryptocurrency could likely remain in correction for the next few months before launching a price rally.
Bitcoin’s 231-Day Cycle Hints At $175,000 Target By September
Following an initial price decline in February, Egrag Crypto had postulated Bitcoin could experience a price correction due to a CME gap before experiencing a price bounce. However, the lack of strong bullish convictions over the past weeks has forced a conclusion that the premier cryptocurrency is stuck in a potentially long corrective phase.
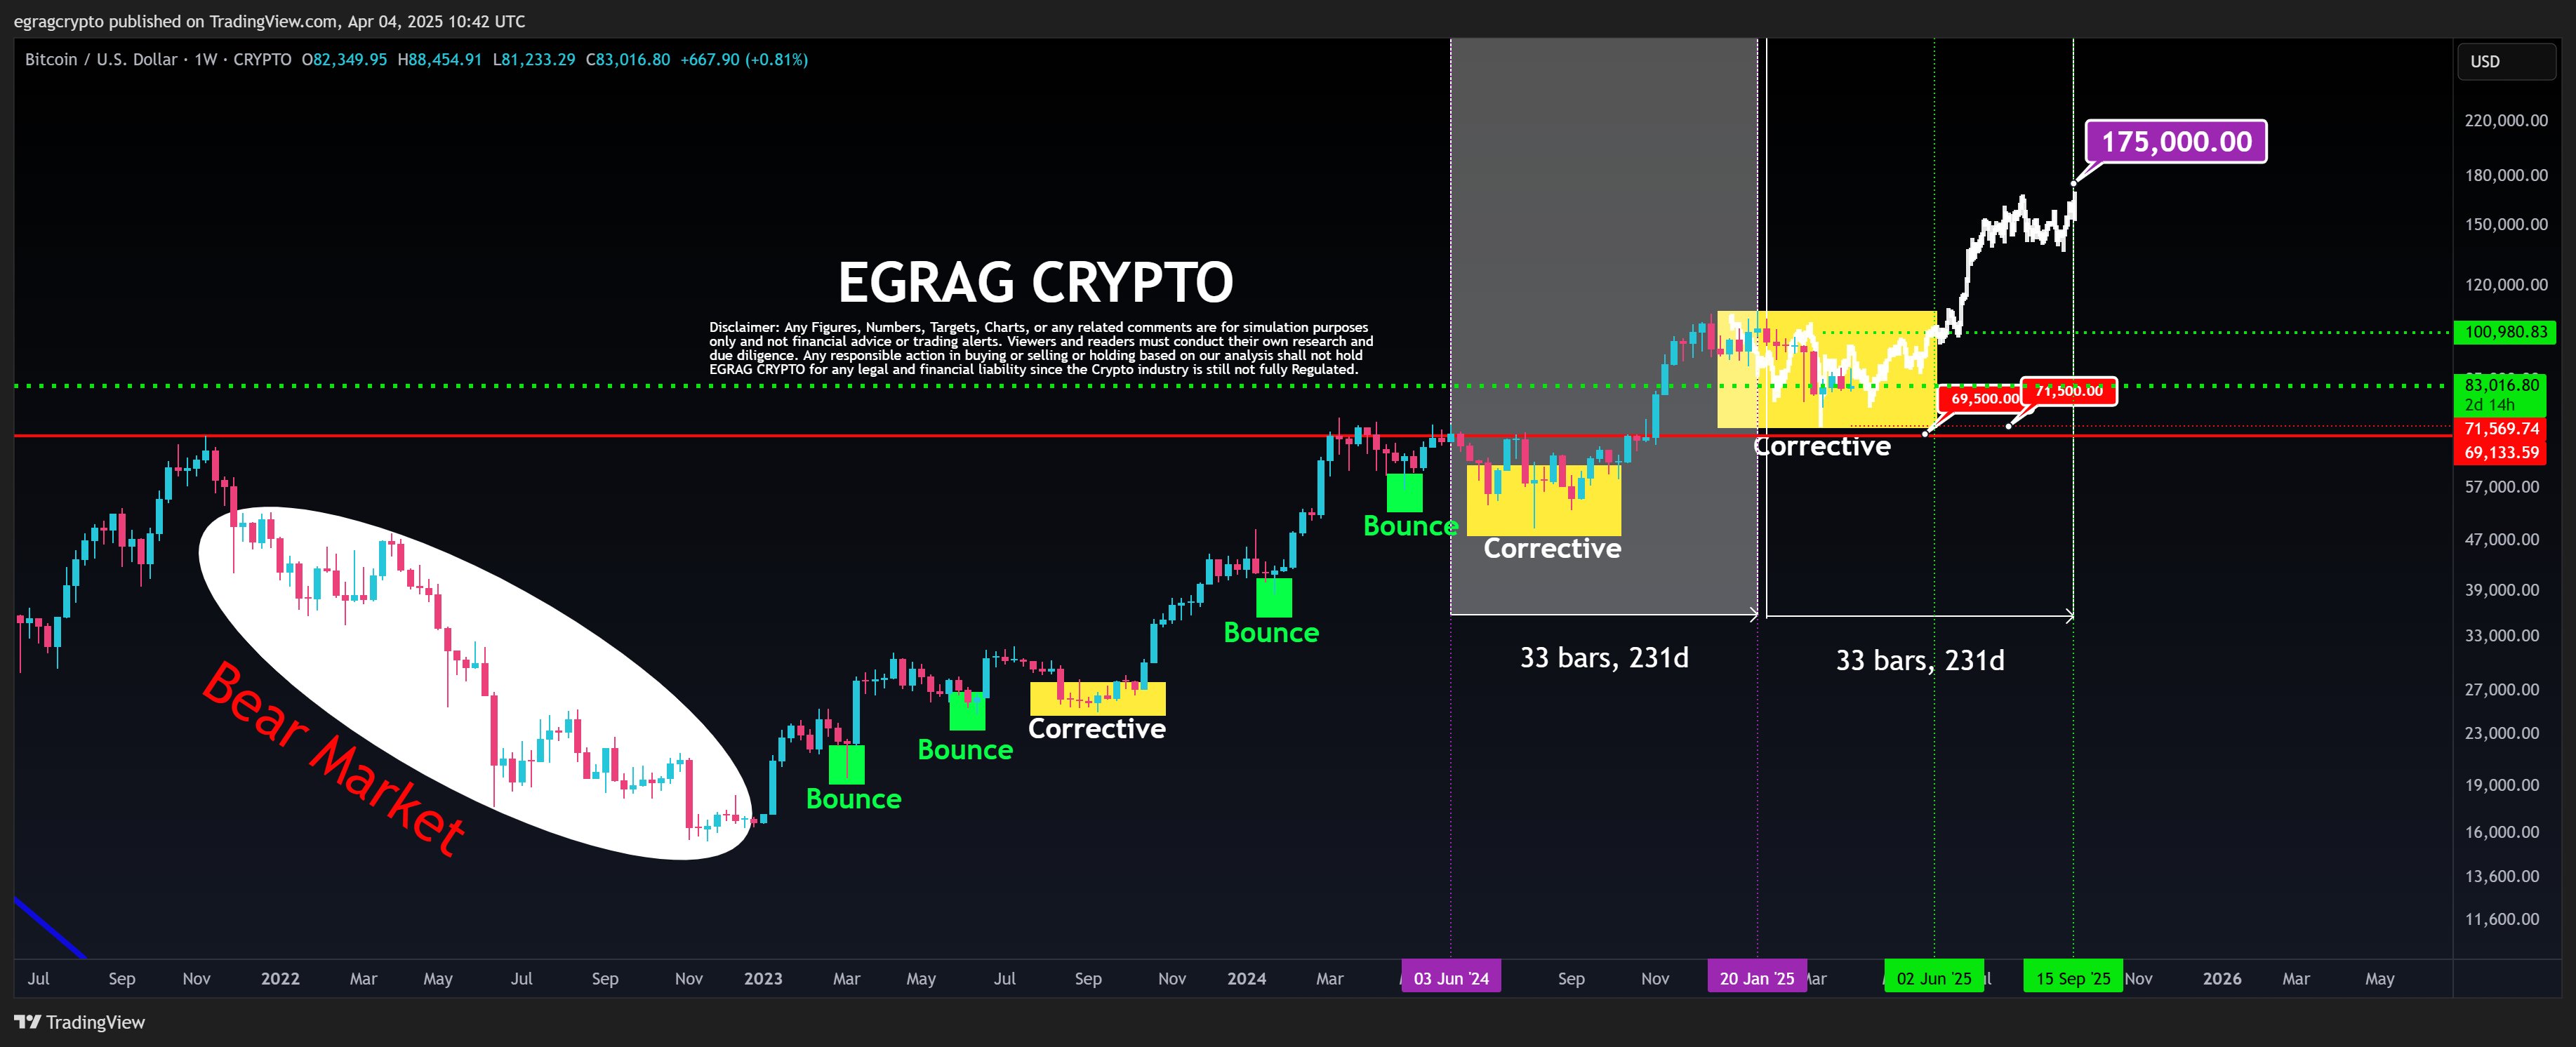
According to Egrag in a recent post, Bitcoin’s ongoing correction aligns with a fractal pattern i.e. a repeating price structure that has appeared across multiple timeframes. This pattern is based on a 33-bar (231-day) cycle during which BTC transits from a corrective phase to an explosive price rally.

In comparing previous cycles to the current developing one, Egrag has predicted Bitcoin could potentially break out of its recalibration by June. In this case, the analyst expects the crypto market leader to hit a market top of $175,000 by September, hinting at a potential 107.83% gain on current market prices.
However, in igniting this price rally, market bulls must ensure a breakout above the stiff price barrier at $100,000. On the other hand, any potential fall below the $69,500-$71,500 support price level could invalidate this current bullish setup and possibly signal the end of the current bull run.
BTC Investors Wait As Exchange Activity Slows Down
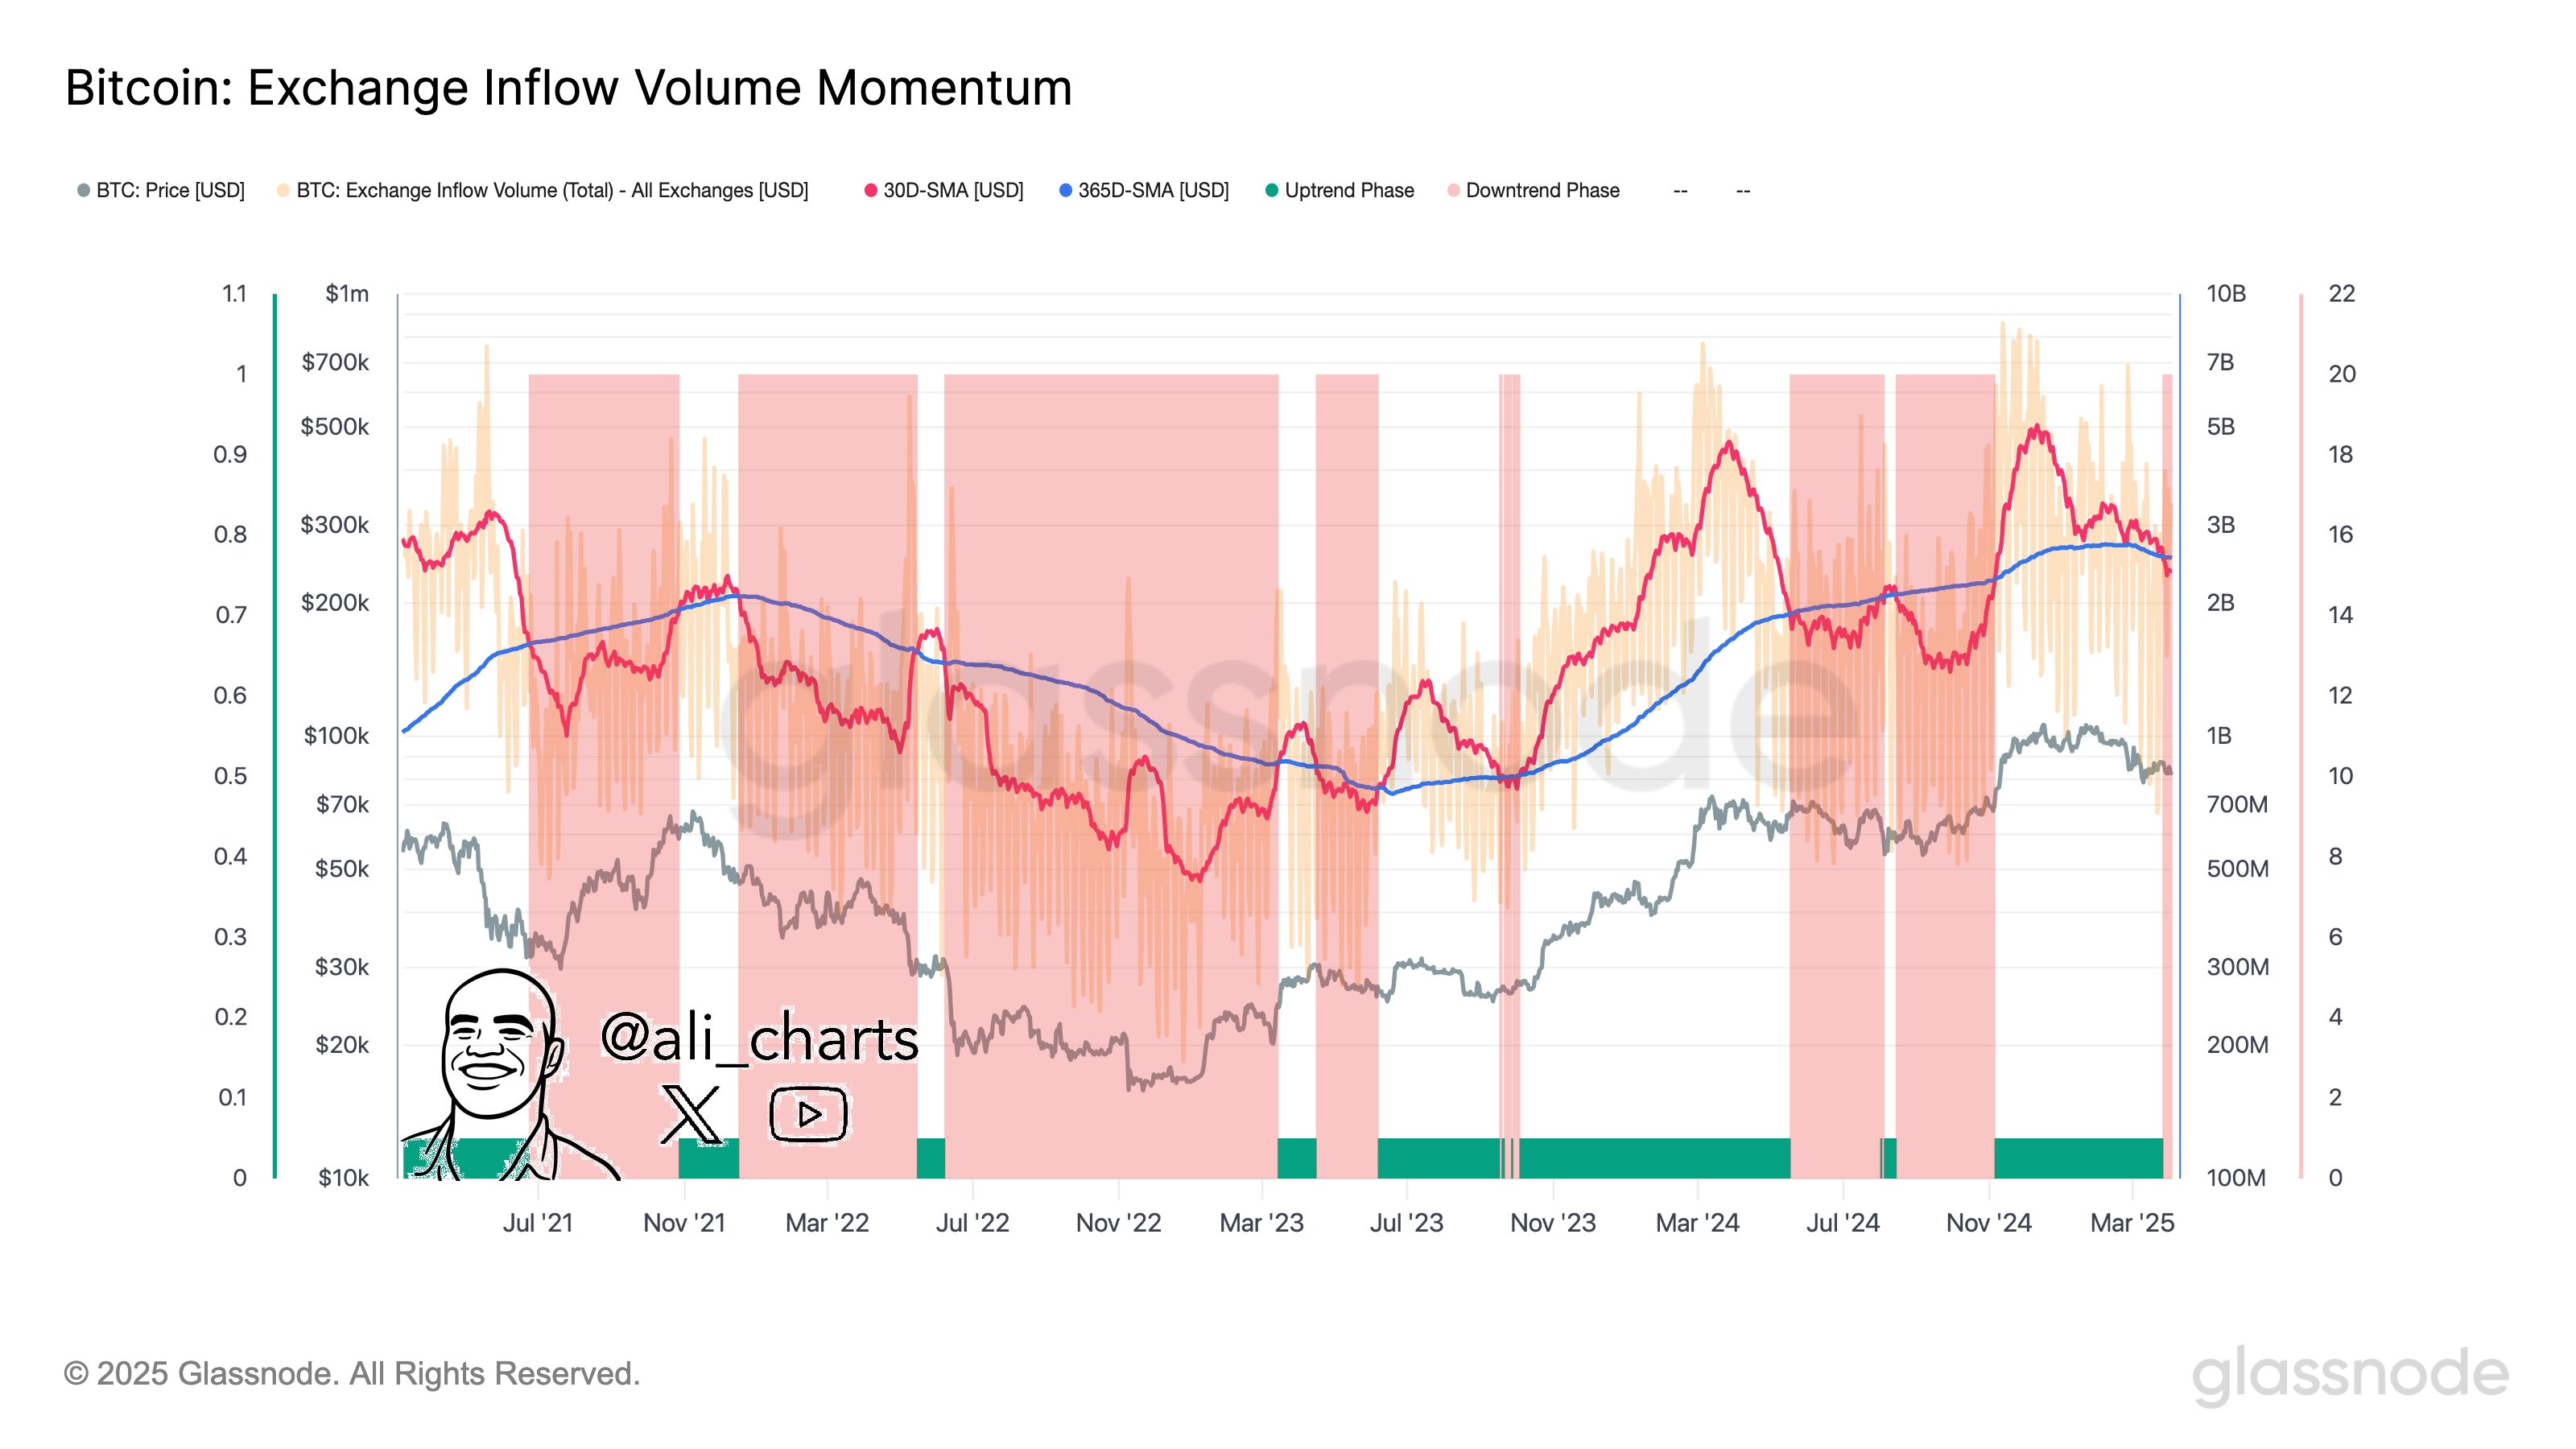
In other news, popular crypto expert Ali Martinez has reported a decline in Bitcoin exchange-related activity indicating reduced investors’ interest and network utilization. Notably, this development suggests that investors are hesitating to deposit or withdraw Bitcoin on exchanges perhaps due to market uncertainty on the asset’s immediate future trajectory.

According to Martinez, Bitcoin is now likely to undergo a trend shift as investors wait for the next market catalyst. Notably, Bitcoin has shown commendable resilience despite the new tariffs imposed by the US government on April 2. According to data from Santiment, BTC’s price dipped only 4% in the hours following the announcement—a milder reaction compared to previous tariff-related market moves.
Since then, BTC has made some price gains and currently trades at $83,805 as investors flock to the crypto market which has recorded a $5.16 billion inflow over the past day. Meanwhile, BTC’s trading volume is up by 26.52% and is valued at $43.48 billion.
Featured image from UF News, chart from Tradingview

Editorial Process for bitcoinist is centered on delivering thoroughly researched, accurate, and unbiased content. We uphold strict sourcing standards, and each page undergoes diligent review by our team of top technology experts and seasoned editors. This process ensures the integrity, relevance, and value of our content for our readers.
-

 Altcoin23 hours ago
Expert Calls On Pi Network To Burn Tokens To Revive Pi Coin Price
-

 Ethereum23 hours ago
Crypto Analyst Who Called Ethereum Price Dump Says ETH Is Now Undervalued, Time To Buy?
-

 Market21 hours ago
IMX Price Nears All-Time Low After 30 Million Token Sell-Off
-

 Bitcoin24 hours ago
Arthur Hayes Sees Tariff War Pushing Bitcoin Toward $1 Million
-

 Market23 hours ago
Dogecoin Faces $200 Million Liquidation If It Slips To This Price
-

 Market22 hours ago
SEC’s Guidance Raises Questions About Tether’s USDT
-

 Market20 hours ago
Key Levels To Watch For Potential Breakout
-

 Market19 hours ago
Solana Altcoin Saros Rallies 1000% Since March, Hits New High


