Bitcoin
Bitcoin Holders Resume Buying After Market Sell-Off

The basic laws of supply and demand determine the price action of any asset, including Bitcoin. When supply exceeds demand, the asset’s price tends to decline. Conversely, when demand outstrips supply, the price usually rises.
These same principles apply to cryptocurrencies, and on-chain metrics can provide valuable insights into Bitcoin holders’ behavior.
The Impact of Heightened Profit-Taking
When analyzing a Bitcoin bull market over the long term, the price movement typically exhibits significant upward volatility, mixed with periods of corrections and consolidation. Most investors know that financial markets do not consistently rise, leading to a dynamic interplay between supply and demand, resulting in periodic corrections.
This trend is evident when observing Bitcoin’s Realized Cap and Realized Profits.
- Realized Cap: This adds up the value of all BTC based on the price when they were last moved, giving a clearer picture of the money truly invested in Bitcoin.
- Realized Profits: This refers to the actual gains that BTC holders have made when they sell their Bitcoin for more than they paid.
As Bitcoin reached a new all-time high of over $73,000 in mid-March, its Realized Cap also increased, suggesting that most long-term holders were profitable. Consequently, some exited their positions, resulting in a significant spike in Realized Profits.

The rising supply of BTC on the market surpassed the demand levels, leading to a corrective phase that saw the price of Bitcoin dip below $57,000. This drop brought Bitcoin below its Short-Term Holder Realized Price, creating a sense of fear in the market, given that short-term holders are more prone to sell based on price volatility.
- Realized Price: The average price at which all BTC were last bought. It is like finding out the average cost everyone paid for their BTC.
- Short-Term Holder Realized Price: The average price investors paid for BTC that they have moved around in the last 155 days. These BTC are the ones most likely to be spent or sold soon.
- Long-Term Holder Realized Price: The average price investors paid for BTC that they have not moved in over 155 days. These BTC are the least likely to be spent or sold soon.
The Short-Term Holder Realized Price, which currently stands at $60,500, served as an accumulation point despite investors’ fears. Indeed, long-term holders felt comfortable adding more BTC to their positions at this level after realizing profits in March.

Bitcoin Supply-Demand Trends Shift
Bitcoin’s Long-Term Holder Net Position Change provides a glimpse into this behavior. After undergoing a prolonged distribution period, long-term holders have begun accumulating again, having amassed more than 70,000 BTC since early May.
- Long-Term Holder Net Position Change: It shows how the amount of Bitcoin held by long-term investors increases or decreases over time.
Based on the simple laws of supply and demand, as demand for Bitcoin begins to outstrip the available supply of BTC in the market, the odds of Bitcoin resuming its upward trajectory improve.

Observing Bitcoin’s Balance on Exchanges can corroborate these supply and demand dynamics.
- Balance on Exchanges: This refers to the total amount of Bitcoin held in cryptocurrency exchange wallets.
Since early May, more than 30,000 BTC have moved to private cryptocurrency wallets for long-term holding, showing confidence among holders in Bitcoin’s future value.

While assessing the future price action of any asset can be challenging, multiple on-chain metrics can hint at potential price points investors should pay attention to. One of these metrics is the MVRV Extreme Deviation Pricing Bands, which determines whether the price of Bitcoin is unusually high or low based on its historical averages.
- MVRV: It stands for Market Value to Realized Value. Market Value is the current price of Bitcoin times the number of BTC in circulation, while Realized Value is the average price at which all BTC were last bought.
- Pricing Bands: These bands show the upper and lower limits of Bitcoin’s price based on its historical MVRV values to help identify when Bitcoin is either extremely overvalued or undervalued based on historical price data.
Bitcoin recently moved back above the +0.5σ pricing band, which currently stands at $64,600. Historically, such an upswing has led Bitcoin to test the 1.0σ pricing band supported by rising demand. This pricing band is currently hovering around $77,000.
Read more: Bitcoin Price Prediction 2024/2025/2030

Summary and Conclusions
The basic laws of supply and demand dictate Bitcoin’s price movements. Indeed, prices fall when supply exceeds demand and rise when demand exceeds supply. On-chain metrics offer valuable insights into these dynamics, allowing analysts to understand Bitcoin holders’ behavior.
Recent data reveals a price decline below $57,000 as supply increased. However, long-term holders have demonstrated confidence by accumulating over 70,000 BTC since early May. This trend suggests resilience in the market despite short-term volatility.
Key metrics like Realized Cap and Realized Profits illustrate that many long-term holders were profitable at Bitcoin’s recent all-time high, leading to a wave of selling and subsequent price corrections. However, the accumulation by long-term holders at lower prices indicates a positive outlook for Bitcoin’s future value.
Read more: How To Buy Bitcoin (BTC) and Everything You Need To Know
Overall, these on-chain metrics help identify shifts in supply and demand, providing a framework to understand Bitcoin’s price action and investor behavior and indicating potential upward trends as demand begins to outstrip supply.
Disclaimer
In line with the Trust Project guidelines, this price analysis article is for informational purposes only and should not be considered financial or investment advice. BeInCrypto is committed to accurate, unbiased reporting, but market conditions are subject to change without notice. Always conduct your own research and consult with a professional before making any financial decisions. Please note that our Terms and Conditions, Privacy Policy, and Disclaimers have been updated.
Bitcoin
Is Bitcoin Ready for Another Surge?

The US Dollar Index (DXY), which measures the dollar’s value against a basket of foreign currencies, has dropped to a three-year low. The decline contrasts with gold’s performance, which hit an all-time high of $3,220 amid rising trade war tensions.
Yet, DXY’s dip has sparked optimism among cryptocurrency investors. Many see the weakening dollar as a bullish signal for Bitcoin (BTC), which has recently shown signs of modest recovery.
Will Bitcoin Rally Following the DXY Index’s Fall?
Data shows that the DXY index dropped by 1.5% in the last 24 hours. As of press time, it stood at 99.4, marking its lowest level since April 2022. The decline is part of a broader trend in 2025, with the DXY down 8.3% since January.
“The US dollar index dropped to its lowest level in nearly three years amid capital outflows from American assets. Escalating trade tensions and growing concerns over broader economic fallout, particularly for the US, have weighed heavily on market sentiment,” CryptoQuant’s Alex Adler told BeInCrypto.
Notably, the index’s fall below 100 marks a critical threshold. Historical data highlights a strong correlation between a declining DXY and substantial Bitcoin price surges.
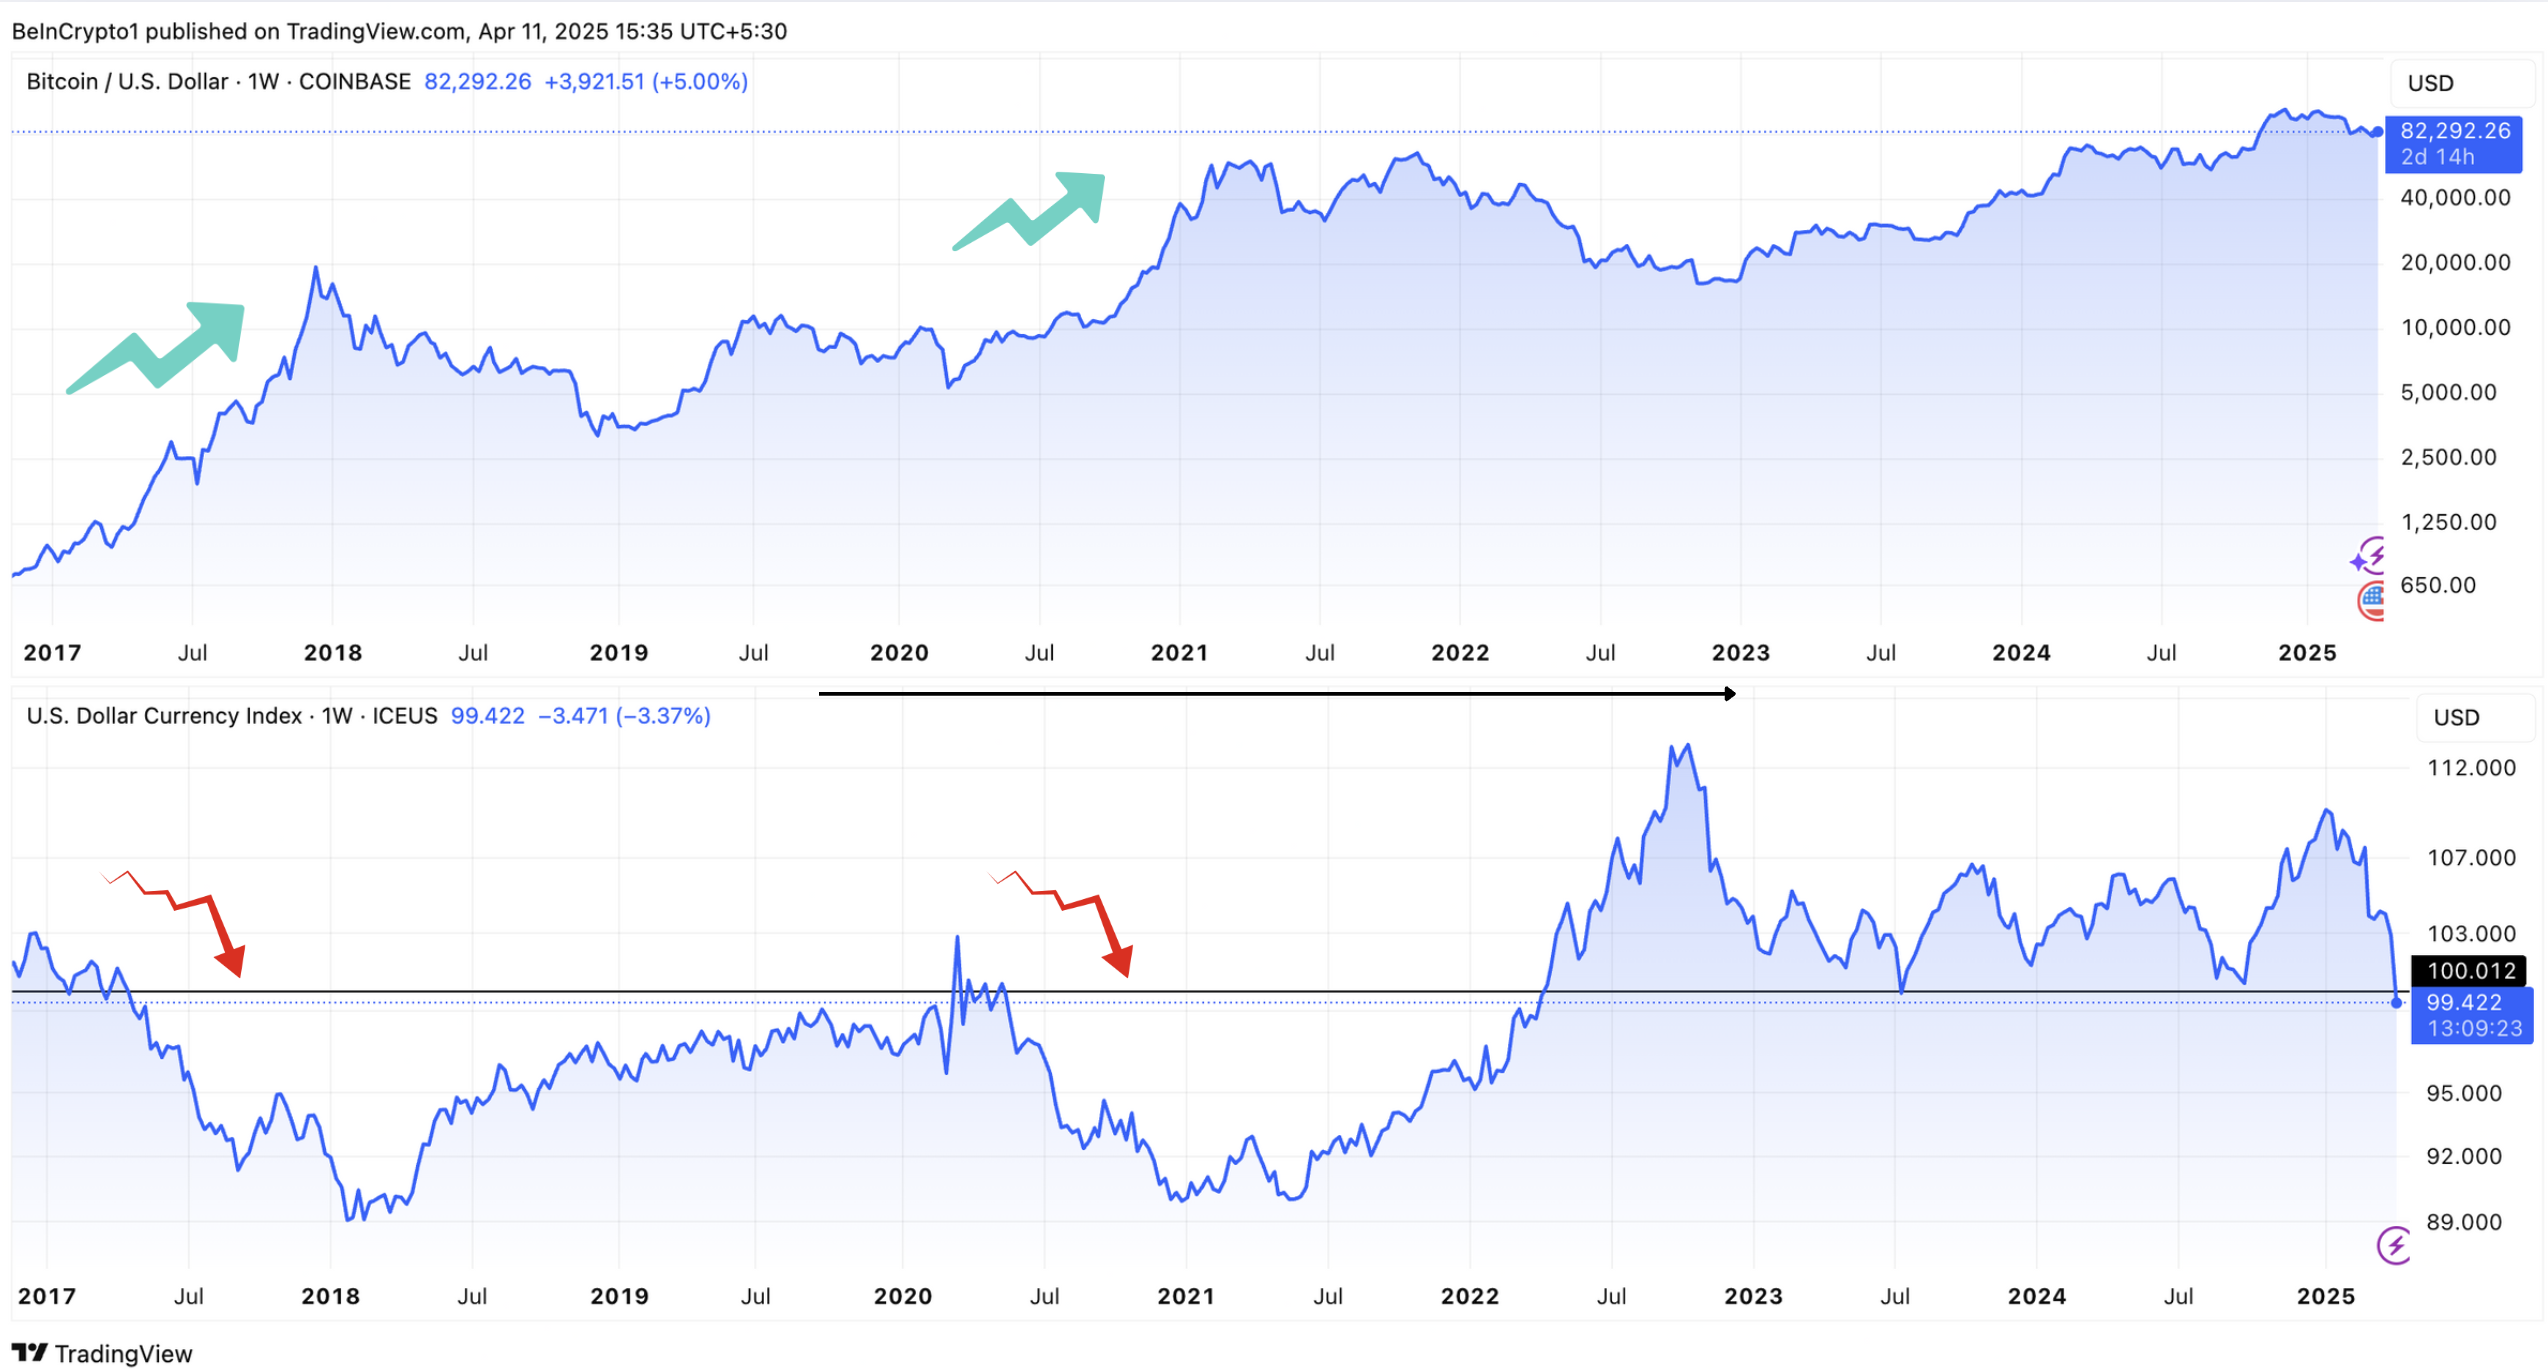
The last two times the DXY fell below the 100 mark—in April 2017 and May 2020—Bitcoin experienced significant, months-long rallies. These substantial increases have led to speculation that history could repeat itself. If it does, Bitcoin could potentially be poised for another major surge.
Interestingly, Bitcoin has already shown signs of recovery after the 90-day tariff pause. The largest cryptocurrency reclaimed the $80,000 level, signaling renewed investor confidence. According to BeInCrypto data, Bitcoin appreciated by 0.8% over the past 24 hours. This reflected minor but positive gains that suggest momentum could be building.
In fact, the market watchers on X (formerly Twitter) share a similar outlook.
“Weak dollar is going to be a surprising tailwind for emerging markets this year that wasn’t on anyone’s bingo card,” a user wrote.
Meanwhile, an analyst observed that the US dollar’s decline has occurred despite the Federal Reserve’s failure to reduce interest rates or implement quantitative easing (QE).
“Traditionally, DXY going down is very bullish for BTC,” he said.
The analyst also highlighted a notable bearish divergence on the charts. Thus, he predicted that the dollar could potentially drop to 90, signaling a further decline in its value.
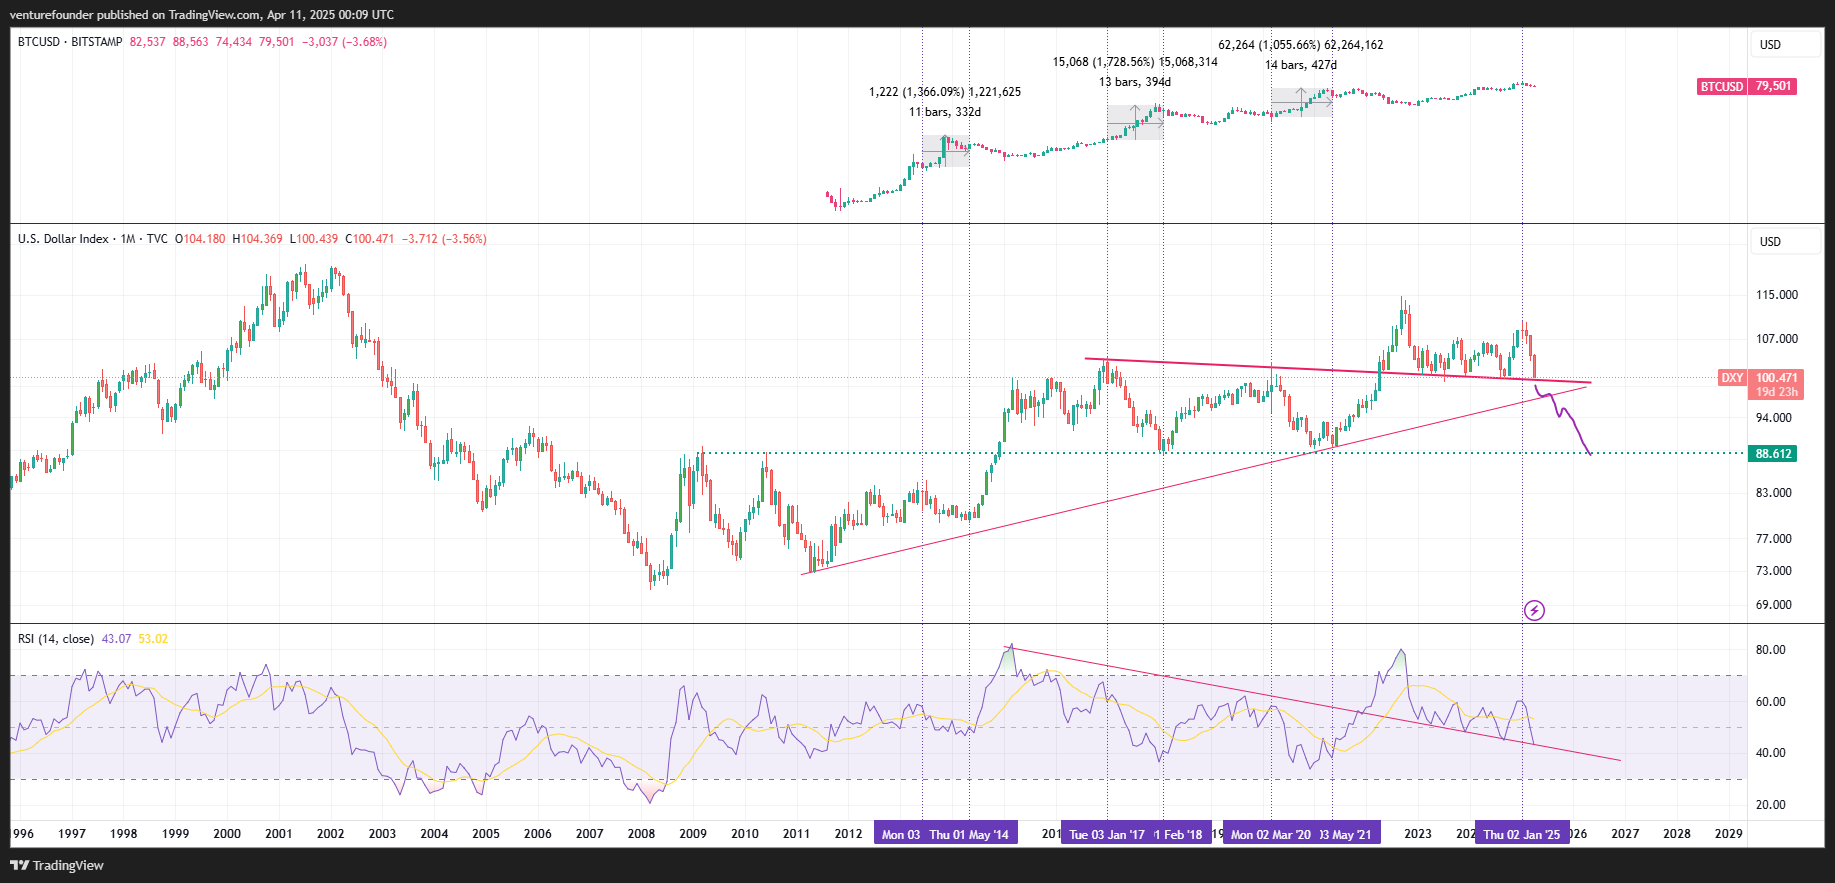
Similarly, another analyst described DXY’s decline as “one of the best anticipated macro moves ahead.”
“Each time this has happened in the past, it resulted in a massive bull market for Bitcoin, Crypto, and stocks,” Jackis remarked.
He also acknowledged that the markets have been slow to react, attributing this delay to a lag of more than three months. Additionally, he noted that the ongoing bond situation between China and the US, driven by escalating trade tensions, is contributing to this slow reaction.
Yet, he believes this situation will either be resolved through a deal between the two countries or the Federal Reserve will intervene by buying long-term bonds to stabilize the market. Now, the coming weeks will be crucial to determine whether Bitcoin will actually enter another bull run or falter under geopolitical tensions and broader market shifts.
Disclaimer
In adherence to the Trust Project guidelines, BeInCrypto is committed to unbiased, transparent reporting. This news article aims to provide accurate, timely information. However, readers are advised to verify facts independently and consult with a professional before making any decisions based on this content. Please note that our Terms and Conditions, Privacy Policy, and Disclaimers have been updated.
Bitcoin
Over $2.5 Billion in Bitcoin and Ethereum Options Expire Today

Crypto markets will witness over $2.5 billion worth of Bitcoin (BTC) and Ethereum (ETH) options expire today.
Traders are particularly attentive to this event because it has the potential to influence short-term trends through the volume of contracts due for expiry and their notional value. Examining the put-to-call ratios and maximum pain points can provide insights into traders’ expectations and possible market directions.
Bitcoin and Ethereum Options Expiring Today
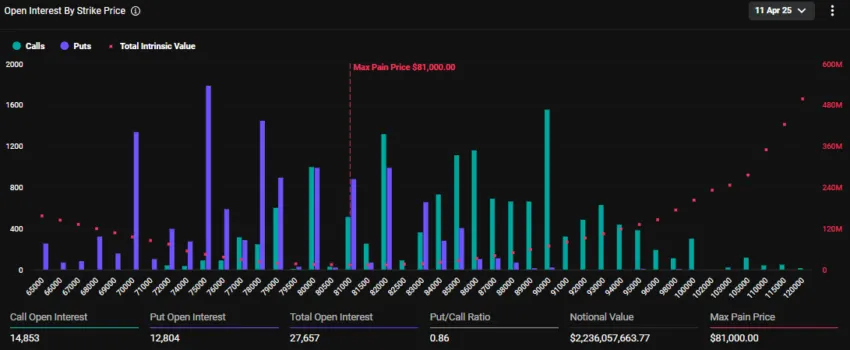
The notional value of today’s expiring BTC options is $2.23 billion. According to Deribit’s data, these 27,657 expiring Bitcoin options have a put-to-call ratio of 0.86. This ratio suggests a prevalence of purchase options (calls) over sales options (puts).
The data also reveals that the maximum pain point for these expiring options is $81,000. In crypto options trading, the maximum pain point is the price at which most contracts expire worthless. Here, the asset will cause the greatest number of holders’ financial losses.
In addition to Bitcoin options, 183,468 Ethereum contracts are set to expire today. These expiring options have a notional value of $283.6 million and a put-to-call ratio of 0.92. The maximum pain point is $1,700.
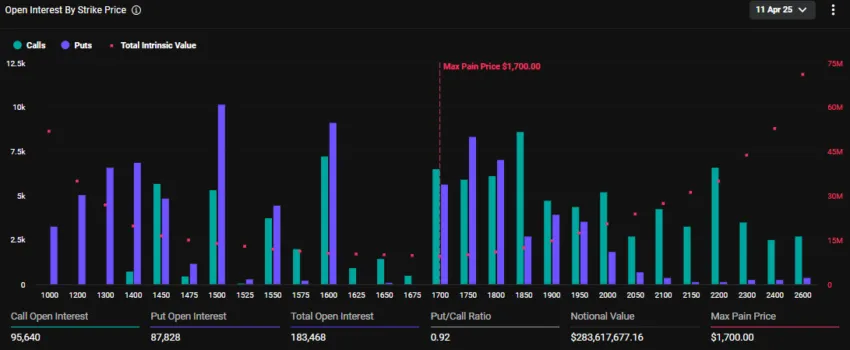
The current market prices for Bitcoin and Ethereum are below their respective maximum pain points. BTC is trading at $80,622, while ETH sits at $1,543.
“With recent market volatility and ongoing tariff developments, how do you think these expiries will impact price action?” Deribit posed.
Deribit is a crypto options and futures exchange. Indeed, crypto markets are reeling from massive volatility induced by the trade war chaos following President Trump’s tariffs. Meanwhile, Cardano founder Charles Hoskinson says future tariffs will be ineffective on crypto.
He thinks that tariffs are already priced and that future announcements will be a ‘dud’ for the crypto market.
Traders Brace for Extended Weakness as Call Premium Fades Until September
Elsewhere, analysts at Deribit note a shift in crypto options, with short-term dips still bringing put demand. Meanwhile, the call premium is further out of the curve and fades.
“You now have to look all the way to September before calls retake the skew. Traders might be bracing for extended weakness,” Deribit noted.
This suggests traders might be bracing for extended weakness in the crypto market. A fading call premium, where the implied volatility (IV) of calls drops relative to puts, suggests that traders are less optimistic about price increases in the near to medium term.
A negative or reverse volatility skew, where OTM puts ((out-of-the-money puts) have higher IV than OTM calls ((out-of-the-money calls), is common in equity markets when investors fear price drops.
This pattern appears to play out in the crypto options market, reflecting heightened concerns about downside risks. Analysts at Greeks.live note that BTC’s IV has declined significantly and is now largely holding nearly 50% across all maturities.
On the other hand, ETH’s IV has maintained a higher level, with short to medium-term volatility holding near 80%. Selling ETH options in the short term would be a good trade for traders.
Global economic uncertainty, including the US-China tariff war, has dampened risk appetite. Crypto’s inherent volatility could also be fueling this cautious outlook.
“Sentiment was more panicky this week, with Trump’s frequent switching of tariff policies making the market extremely risk averse,” analysts at Greeks.live wrote.
The Greeks.live analysts agree with Deribit’s expectations of extended weakness. However, unlike Hoskinson, they expect continued uncertainty and volatility in the market for a long time.
For traders, this suggests a need for hedging strategies, like buying puts or diversifying into stablecoins.
“Cryptocurrencies are currently suffering from a lack of new incoming money, a lack of new narratives, and a more subdued investor sentiment. In this worse market of bulls to bears, the probability of a black swan will be significantly higher, and buying some deep vanilla puts would be a good choice,” Greeks.live analysts concluded.
Disclaimer
In adherence to the Trust Project guidelines, BeInCrypto is committed to unbiased, transparent reporting. This news article aims to provide accurate, timely information. However, readers are advised to verify facts independently and consult with a professional before making any decisions based on this content. Please note that our Terms and Conditions, Privacy Policy, and Disclaimers have been updated.
Bitcoin
Bitcoin Holders are More Profitable Than Ethereum Since 2023

New data from Glassnode suggests that Bitcoin’s MVRV (Market Value to Realized Value) has been higher than Ethereum’s for 812 consecutive days. This means that the average BTC investor has accumulated much larger profits than their ETH counterpart since 2023.
Due to recent losses, Ethereum’s MVRV actually fell below 1.0, suggesting that the average investor has lost money. It may be undervalued and well-posed for a resurgence, but this will take time.
Bitcoin vs Ethereum: Which is More Profitable?
Despite a few recent market turmoils, the price of Bitcoin is doing reasonably well right now. Although much of its gains since Trump’s election have been wiped out, its pre-election value spent most of 2024 at a shelf near its previous all-time high.
According to new data from Glassnode, Bitcoin’s investor profitability is far above Ethereum’s.
“Since November 2022 (FTX collapse), Bitcoin’s realized cap has grown by $468 billion (+117%), while Ethereum’s increased by just $61 billion (+32%). Bitcoin investors have held consistently larger unrealized profits than #Ethereum holders since January 2023. BTC investor profitability has exceeded ETH for 812 consecutive days – an all-time record,” Glassnode said.
Glassnode came to these conclusions by analyzing both tokens’ MVRV and their ratio of market value to realized value. This metric compares the listed price of Bitcoin and Ethereum to the actual price at which these tokens were most recently traded.
Despite maintaining similar MVRVs for a prolonged period, Bitcoin is plowing well ahead today:

While Bitcoin has been more volatile than Ethereum, the altcoin has seen a much smaller uptick during bullish cycles. For instance, in the latest bull run between October and December 2024, Bitcoin surged by nearly 70%.
In the same period, Ethereum’s price increase was less than 50%. Yet, if we look at the drop during the current market downturn, BTC lost 3% in the first week of April, while ETH lost over 15%.
Meanwhile, the altcoin’s investor sentiment is also dropping. Major whales who HODL’ed the token for many years are now selling their ETH holdings.
Also, the average Bitcoin holder enjoys an MVRV of around 2.0, meaning that they have huge unrealized gains. Most of their counterparts have an MVRV below 1.0, signifying that they have lost money. These data points are concerning, especially for the median ETH holder.
However, there’s a silver lining. Ethereum recently fell to a yearly low, but there’s also a strong uptick of new investors. New developments, like the SEC approving ETH ETF options trading, could spur a recovery.
In other words, Ethereum may be highly undervalued and, therefore, an attractive investment.
Still, for the time being, Bitcoin holders are in a much better position than ETH holders. Ethereum is still the second-largest cryptoasset by market cap, and it can always make a comeback. This will almost certainly pose a significant challenge.
Disclaimer
In adherence to the Trust Project guidelines, BeInCrypto is committed to unbiased, transparent reporting. This news article aims to provide accurate, timely information. However, readers are advised to verify facts independently and consult with a professional before making any decisions based on this content. Please note that our Terms and Conditions, Privacy Policy, and Disclaimers have been updated.
-

 Altcoin19 hours ago
XRP Price Risks 40% Drop to $1.20 If It Doesn’t Regain This Level
-

 Market18 hours ago
President Trump Signs First-Ever Crypto Bill into Law
-

 Market19 hours ago
Ethereum Price Cools Off—Can Bulls Stay in Control or Is Momentum Fading?
-

 Market17 hours ago
XRP Price Ready to Run? Bulls Eyes Fresh Gains Amid Bullish Setup
-

 Altcoin17 hours ago
BNB Chain Completes Lorentz Testnet Hardforks; Here’s The Timeline For Mainnet
-

 Market23 hours ago
How SEC Chair Paul Atkins Will Reset US Crypto Policy
-

 Market14 hours ago
How Vitalik Buterin Plans to Enhance Ethereum’s Privacy
-

 Market15 hours ago
BNB Price Recovery in Motion—Uphill Battle Ahead Near Crucial $600 Level


