
Bitcoin
Analyst Breaks Down the Real Reason Why

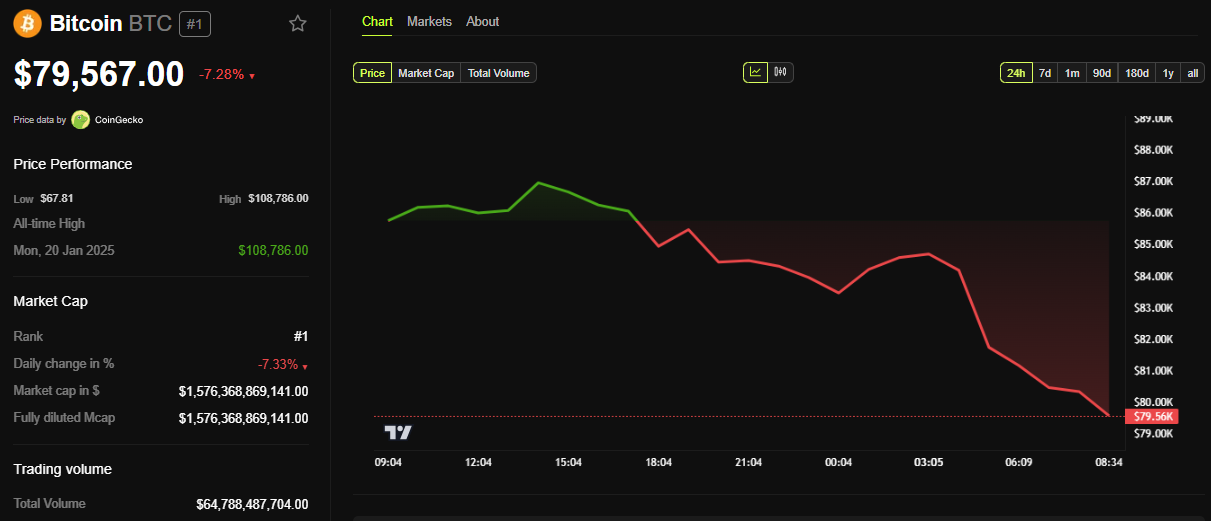
Bitcoin’s (BTC) price has hit a three-month low, reversing its post-election gains following Donald Trump’s victory.
While initial market sentiment blamed the downturn on US President Donald Trump’s tariffs and the recent Bybit hack, analysts are now pointing to a more structural cause.
Why Bitcoin Is Crashing, Analyst Offers New Perspective
Crypto analyst Kyle Chasse ascribes the ongoing crypto market crash to unwinding the cash and carry trade that has been suppressing BTC’s price for months. He explains that hedge funds have exploited a low-risk arbitrage trade involving Bitcoin spot ETFs (exchange-traded funds) and CME futures.
“Bitcoin is crashing. Wondering why? The cash & carry trade that’s been suppressing BTC’s price is now unwinding,” he stated.
The strategy involved buying Bitcoin spot ETFs such as those from BlackRock (IBIT) and Fidelity (FBTC). It also involved shorting BTC futures on the CME and farming the spread for an annualized return of approximately 5.68%.
According to the analyst, some funds used leverage to boost double-digit returns. However, this trade is now collapsing, causing massive liquidity withdrawals from the market and sending Bitcoin’s price into free fall.
The collapse of the cash and carry trade has led to over $1.9 billion in Bitcoin sold in the past week. This marks a significant decline in CME open interest as hedge funds unwind positions. It has also caused a double-digit percentage drop in Bitcoin’s price within days.
According to Chasse, hedge funds never bet on Bitcoin’s long-term price appreciation. Instead, they were farming a risk-free yield using arbitrage. Now that the trade is dead, they are rapidly pulling liquidity, intensifying Bitcoin’s sell-off.
“Why is this happening? Because hedge funds don’t care about Bitcoin. They weren’t betting on BTC mooning. They were farming low-risk yield. Now that the trade is dead, they’re pulling liquidity—leaving the market in free fall,” the analyst added.
Before the cash and carry unwind was identified, many traders blamed Trump’s aggressive tariffs. More recently, tariffs against the European Union sparked market fears. The recent Bybit hack also contributed to soured investor sentiment.
While Bitcoin remains under pressure, Kyle Chasse sees a path forward. More cash and carry unwinding is expected, meaning forced selling will continue until all hedge fund positions are cleared. Volatility will likely increase as leveraged positions get liquidated, leading to sharp swings in Bitcoin’s price.
If the analyst’s perspective is true, Bitcoin would need real, long-term holders to step in and absorb the selling pressure. According to technical analysis, Bitcoin’s next target could be around $70,000, a key support level that might stabilize the market.
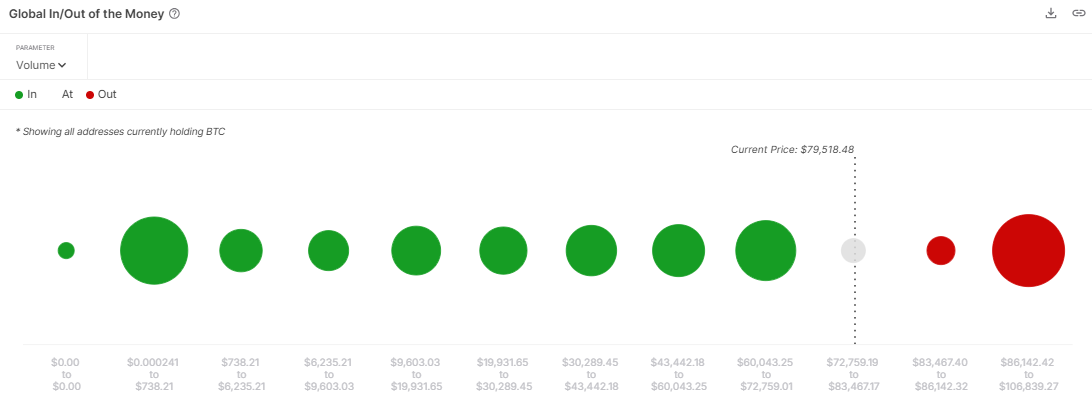
Around this level, 6.76 million addresses hold approximately 2.64 million BTC tokens acquired at an average price of $65,296. Therefore, this zone may offer significant support for Bitcoin price, as holders prevent further losses.
The analyst acknowledges that ETF-driven demand was partly real but heavily influenced by arbitrage players looking for quick profits. For now, the market is undergoing a painful but necessary reset. With it, traders and investors should brace for volatility in what could lay the groundwork for Bitcoin’s next directional bias.
Disclaimer
In adherence to the Trust Project guidelines, BeInCrypto is committed to unbiased, transparent reporting. This news article aims to provide accurate, timely information. However, readers are advised to verify facts independently and consult with a professional before making any decisions based on this content. Please note that our Terms and Conditions, Privacy Policy, and Disclaimers have been updated.


Several US economic indicators are in the pipeline this week, with potential implications for Bitcoin and crypto.
US macroeconomic data have broadly influenced sentiment in the cryptocurrency market over the past several months. Therefore, it is imperative that traders and investors adjust their portfolios and align their trading strategies to capitalize on key economic events.
US Economic Events This Week
Several factors, including macroeconomic sentiment, monetary policy expectations, and Bitcoin’s growing narrative as a hedge or risk asset, influence Bitcoin’s price dynamics. These make the following indicators particularly relevant this week.
US Leading Economic Indicators
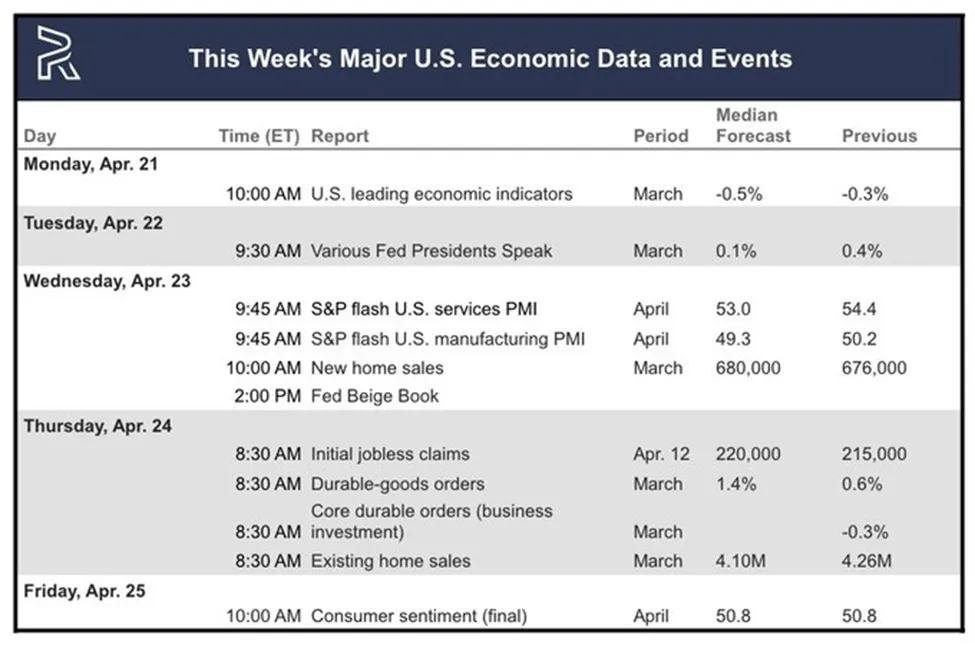
The first US economic indicator that could influence Bitcoin price is March’s leading economic indicator, due today, Monday, April 21.
The Conference Board Leading Economic Index (LEI), last reported for February 2025, declined by 0.3% month-over-month (MoM) after a revised 0.1% increase in December 2024.
This drop, driven by pessimistic consumer expectations and weaker manufacturing orders, continued a trend of negative signals. However, the six-month growth rate is improving, suggesting less severe headwinds than in 2024.
There is a median forecast of a 0.5% decline for the March report, versus a consensus of -0.6%. While these data points to economic slowdown, stabilizing trends and a projected 2.0% GDP growth for 2025 offer some optimism.
However, policy uncertainties, such as Trump’s tariffs, could exacerbate risks. For Bitcoin, declining LEI may dampen risk appetite, pushing investors toward safer assets like bonds and pressuring prices in the short term.
Conversely, Bitcoin’s “digital gold” narrative could gain traction if economic uncertainty fuels distrust in fiat systems. However, this is less likely unless broader trade tensions or policy shocks amplify the effect.
Services PMI
The S&P Global US Services PMI for March 2025 climbed to 54.4 from 51.0 in February, signaling strong expansion in the services sector. This rise, paired with a composite PMI 53.5, reflects resilient consumer demand.
This strength bolsters the US dollar, reducing expectations for Federal Reserve (Fed) rate cuts, which could challenge Bitcoin’s appeal. A stronger dollar and higher yields typically weigh on Bitcoin, as seen in past cycles when real yields rise.
However, rising input costs and tariff concerns temper business confidence. For the April Services PMI, the median forecast is 53.0.
Strong services activity may support broader risk-on sentiment, potentially lifting Bitcoin if equity markets rally, given its occasional correlation with indices like the Nasdaq.
Still, tariff uncertainties could cap any negative pressure, keeping the impact neutral to slightly bearish, as dollar strength overshadows marginal risk-on gains.
Manufacturing PMI
In contrast, the S&P Global US Manufacturing PMI for March 2025 fell to 50.2 from 52.7, hovering near stagnation. Meanwhile, the ISM Manufacturing PMI contracted to 49.0 from 50.3, with new orders, production, and employment declines.
This weakness, consistent with October 2024’s ISM reading 46.5, reflects high interest rates, weak global demand, and tariff-related uncertainty.
Moody’s Analytics and Statista highlight manufacturing’s struggles, warning of broader slowdown risks, especially with trade policy volatility under the Trump administration.
For Bitcoin, weak manufacturing data signals reduced risk appetite, likely exerting downward pressure, particularly given its equity market correlation.
While a sharp manufacturing decline could theoretically spur rate-cut expectations, persistent inflation and tariff-driven cost pressures make this unlikely. The outlook here is bearish, as fears of economic slowdown dominate.
“S&P Global Services/ManufacturingPMI (Wednesday): The pulse of the economy. Watch for a dip or rise in the numbers…it could hint at whether the recovery is running out of gas or shifting into overdrive,” one user remarked.
Initial Jobless Claims
Initial Jobless Claims for the week ending April 19 recorded 215,000, down from 223,000 the week before.
It indicates a slight improvement but still reflects a labor market under pressure, suggesting ongoing challenges. High interest rates, cautious business investment, and uncertainties surrounding tariff policies likely drive this sentiment by eroding employer confidence.
“…66% of Americans expect higher unemployment in the next 12 months, the highest share since the Great Financial Crisis. Such sharp spikes have never occurred outside of recessions. The job market is set to get worse pretty quickly,” one analyst noted recently.
Nevertheless, despite reduced hiring and economic pressures, the decline suggests some layoff stabilization.
Analysts note that lower claims could ease concerns about rapid deterioration, persistent inflation, and policy uncertainties, which limit expectations for Fed rate cuts.
Meanwhile, jobless claims are a critical driver of Bitcoin sentiment. The modest drop in claims may temper economic weakness signals. If claims continue to decline significantly, sparking hopes of monetary easing, Bitcoin could benefit from increased liquidity and lower yields.
Consumer Sentiment
Consumer Sentiment, as measured by the University of Michigan’s index, was 50.8 in March 2025. This was a modest drop from February’s reading, reflecting tariff-related pessimism and inflation fears despite solid economic conditions.
Preliminary March data suggests a reading of 50.8, with sentiment still sour, per TradingEconomics estimates.
“US consumer sentiment is lower than in the great financial crisis. Consumer sentiment fell to 50.8, the 2nd-lowest level in history. The sentiment is lower than during every US recession over the last 50 years…This is a crisis,” a global markets investor noted.
Consumer sentiment is a gauge of retail investor confidence, critical for Bitcoin’s retail-driven market. Lower sentiment could sap enthusiasm for speculative assets, pushing Bitcoin lower, especially if risk-off sentiment dominates.
Conversely, if sentiment stabilizes or tariff fears ease, Bitcoin could ride a risk-on wave, though this seems unlikely given current trends.
The probable effect is bearish, as declining confidence aligns with broader economic caution.
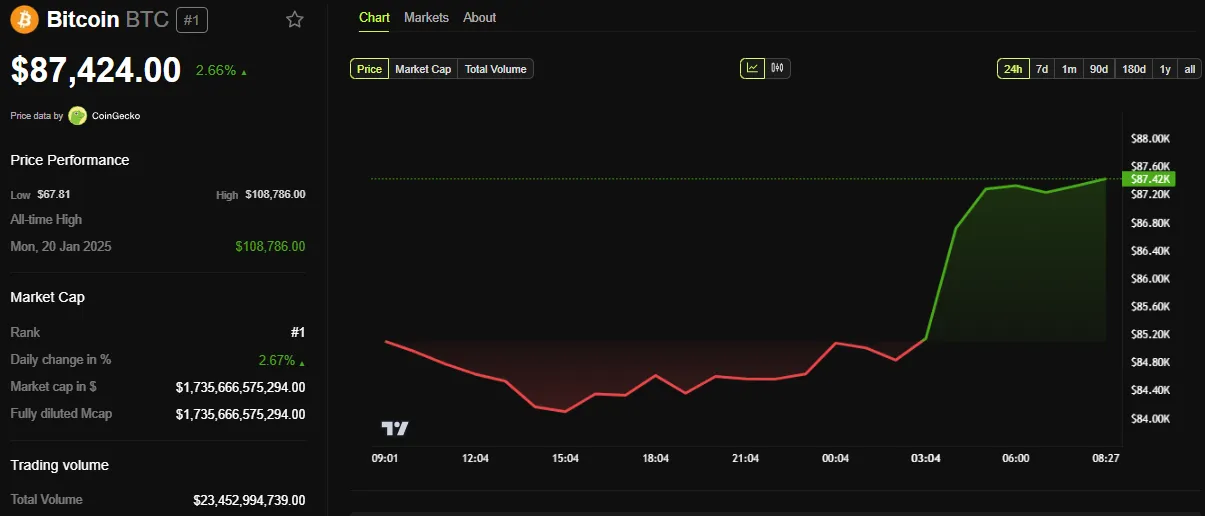
BeInCrypto data shows Bitcoin (BTC) was trading for $87,424 as of this writing. This represents a modest 2.66% gain in the last 24 hours.
Disclaimer
In adherence to the Trust Project guidelines, BeInCrypto is committed to unbiased, transparent reporting. This news article aims to provide accurate, timely information. However, readers are advised to verify facts independently and consult with a professional before making any decisions based on this content. Please note that our Terms and Conditions, Privacy Policy, and Disclaimers have been updated.


Bitcoin has produced a range-bound movement recently, with prices oscillating between $83,000 and 86,000. Interestingly, popular crypto analyst Burak Kesmeci has identified the important price levels for any short-term action.
Support At 82,800, Resistance At 92,000 – But Where Is Bitcoin Headed?
In a new post on X, Kesmeci shared an interesting on-chain analysis of the Bitcoin market. Using the short-term investor cost basis, the analyst identified two key price levels that could prove critical to Bitcoin’s next major move.
Firstly, Burak Kesmeci focuses on the average cost prices of new traders over the past 1-4 weeks, which are likely the most reactive to price changes. The realized price for these traders currently stands at $82,800, forming a near-term support that indicates many recent buyers are still in profit and may defend this level as a psychological floor.
Meanwhile, Kesmeci also highlights the $92,000 price level, which marks the average cost basis for BTC holders for 1-3 months. This price point has emerged as an important resistance zone, as investors are likely to exit the market once they break even. Furthermore, the $92,000 price level is also marked by a confluence with various technical indicators.
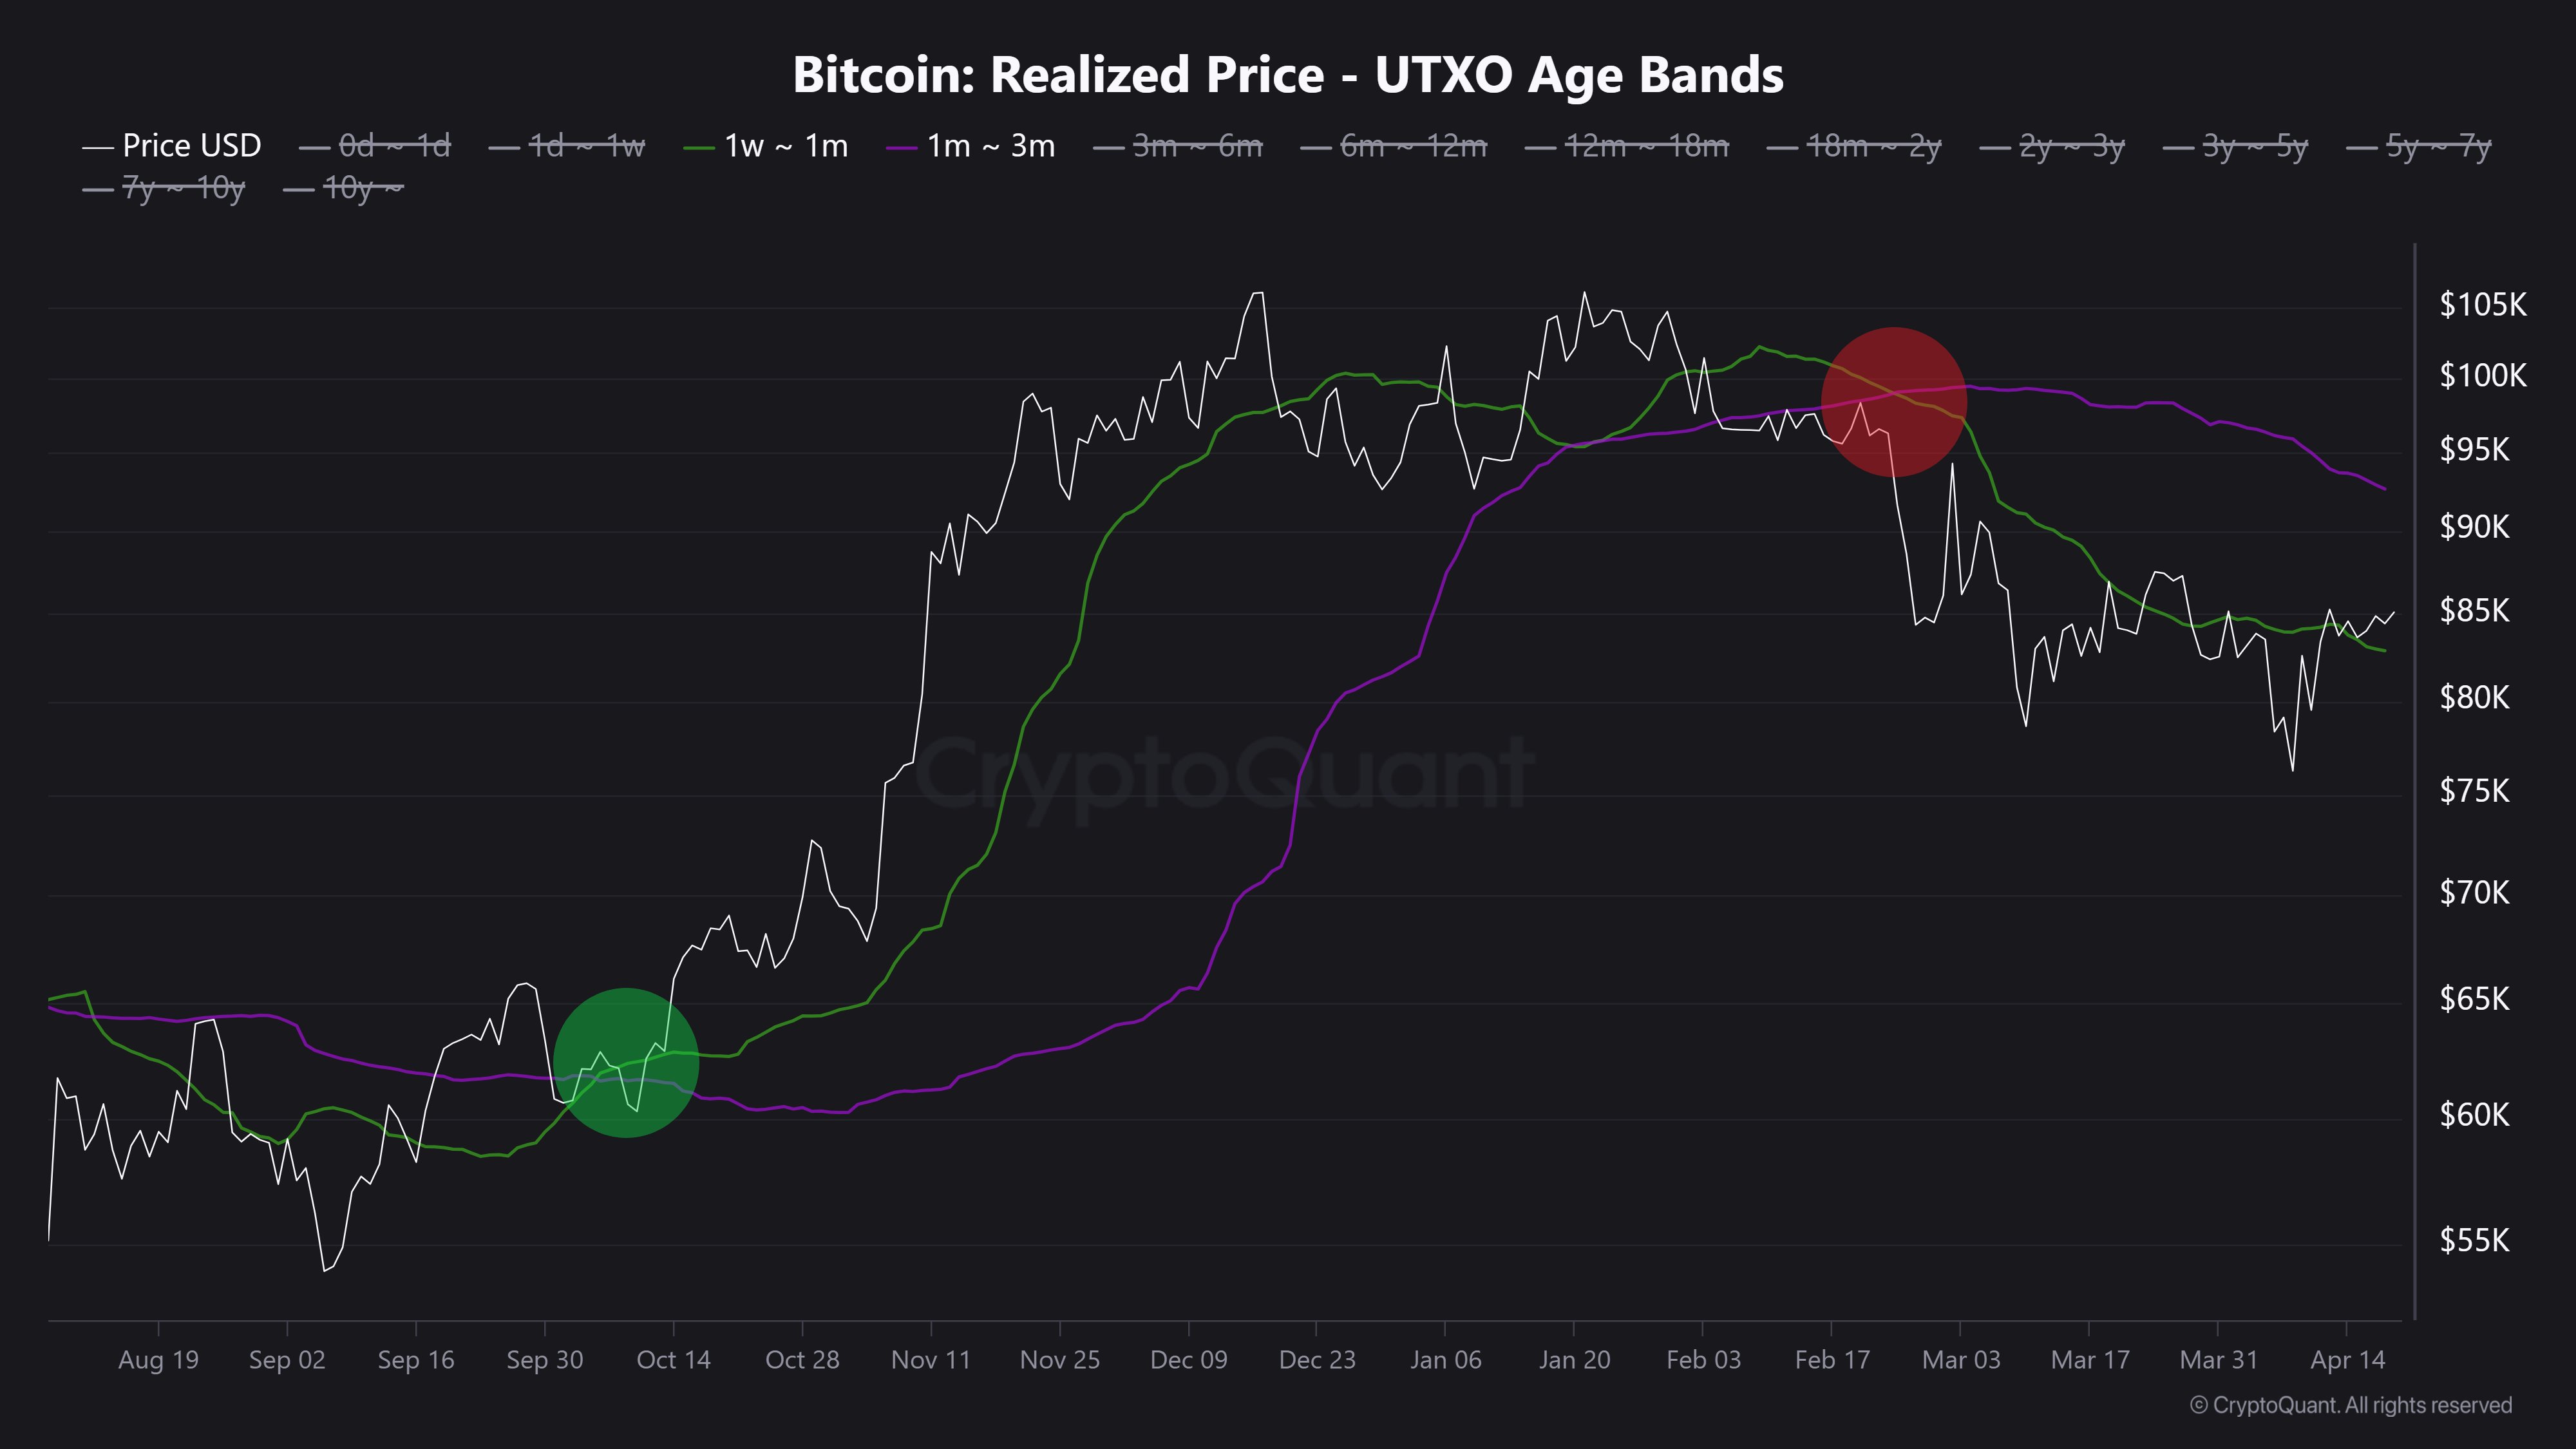
The interplay between these two levels is significant. Historically, short-term bullish trends in BTC tend to begin when the cost basis of more recent investors, 1–4 weeks, crosses above that of the 1–3 BTC holders. This shift signals increased confidence and willingness to buy at higher levels, which often fuels broader rallies.
However, that dynamic remains to play out in the current market. As of now, Bitcoin is trading around 85,000, positioning it above its support at the 1–4 week average of $82,800 but still below the 1–3 month resistance of $92,000. Furthermore, both cost basis levels have been declining over the past two months, reflecting hesitation or a lack of aggressive buying from new entrants.
Notably, Kesmeci states that BTC must surge above $92,000 to confirm a strong bullish momentum for a price reversal.
Bitcoin ETFs Offload 1,725 BTC
In other news, Ali Martinez reports that the Bitcoin ETFs have suffered withdrawals of 1,725 Bitcoin, valued at $146.92 million, over the past week. This development illustrates a high level of negative sentiment among institutional investors, adding to market uncertainty around the BTC market.
Meanwhile, Bitcoin trades at $85,249 following a price change of 0.89% in the past day. The premier cryptocurrency also reflects a 0.58% loss on the weekly chart and a 1.06% gain on a monthly chart.
Feature image from Adobe Stock, chart from Tradingview
Editorial Process for bitcoinist is centered on delivering thoroughly researched, accurate, and unbiased content. We uphold strict sourcing standards, and each page undergoes diligent review by our team of top technology experts and seasoned editors. This process ensures the integrity, relevance, and value of our content for our readers.

Following an extensive price correction in the past three months, the Bitcoin bull market continues to hang in the balance. Despite a modest price rebound in April, the premier cryptocurrency is yet to display a strong intent to resume its bull rally amidst a lack of positive market factors. However, crypto analyst Axel Adler Jr. has highlighted a promising development that could signal major upside potential for Bitcoin.
Bitcoin Long-Term Holders Looking To Halt Selling Pressure
In a recent post on X, Adler Jr. shared an important update in Bitcoin long-term holders (LTH) activity, which could prove significantly positive for the broader BTC market.
Using on-chain data from CryptoQuant, the renowned analyst reports that selling pressure by long-term holders, i.e. amount of LTH holdings on exchanges, has now hit its lowest point at 1.1% over the past year. This development indicates that Bitcoin LTH are now opting to hold on to their assets rather than take profits.
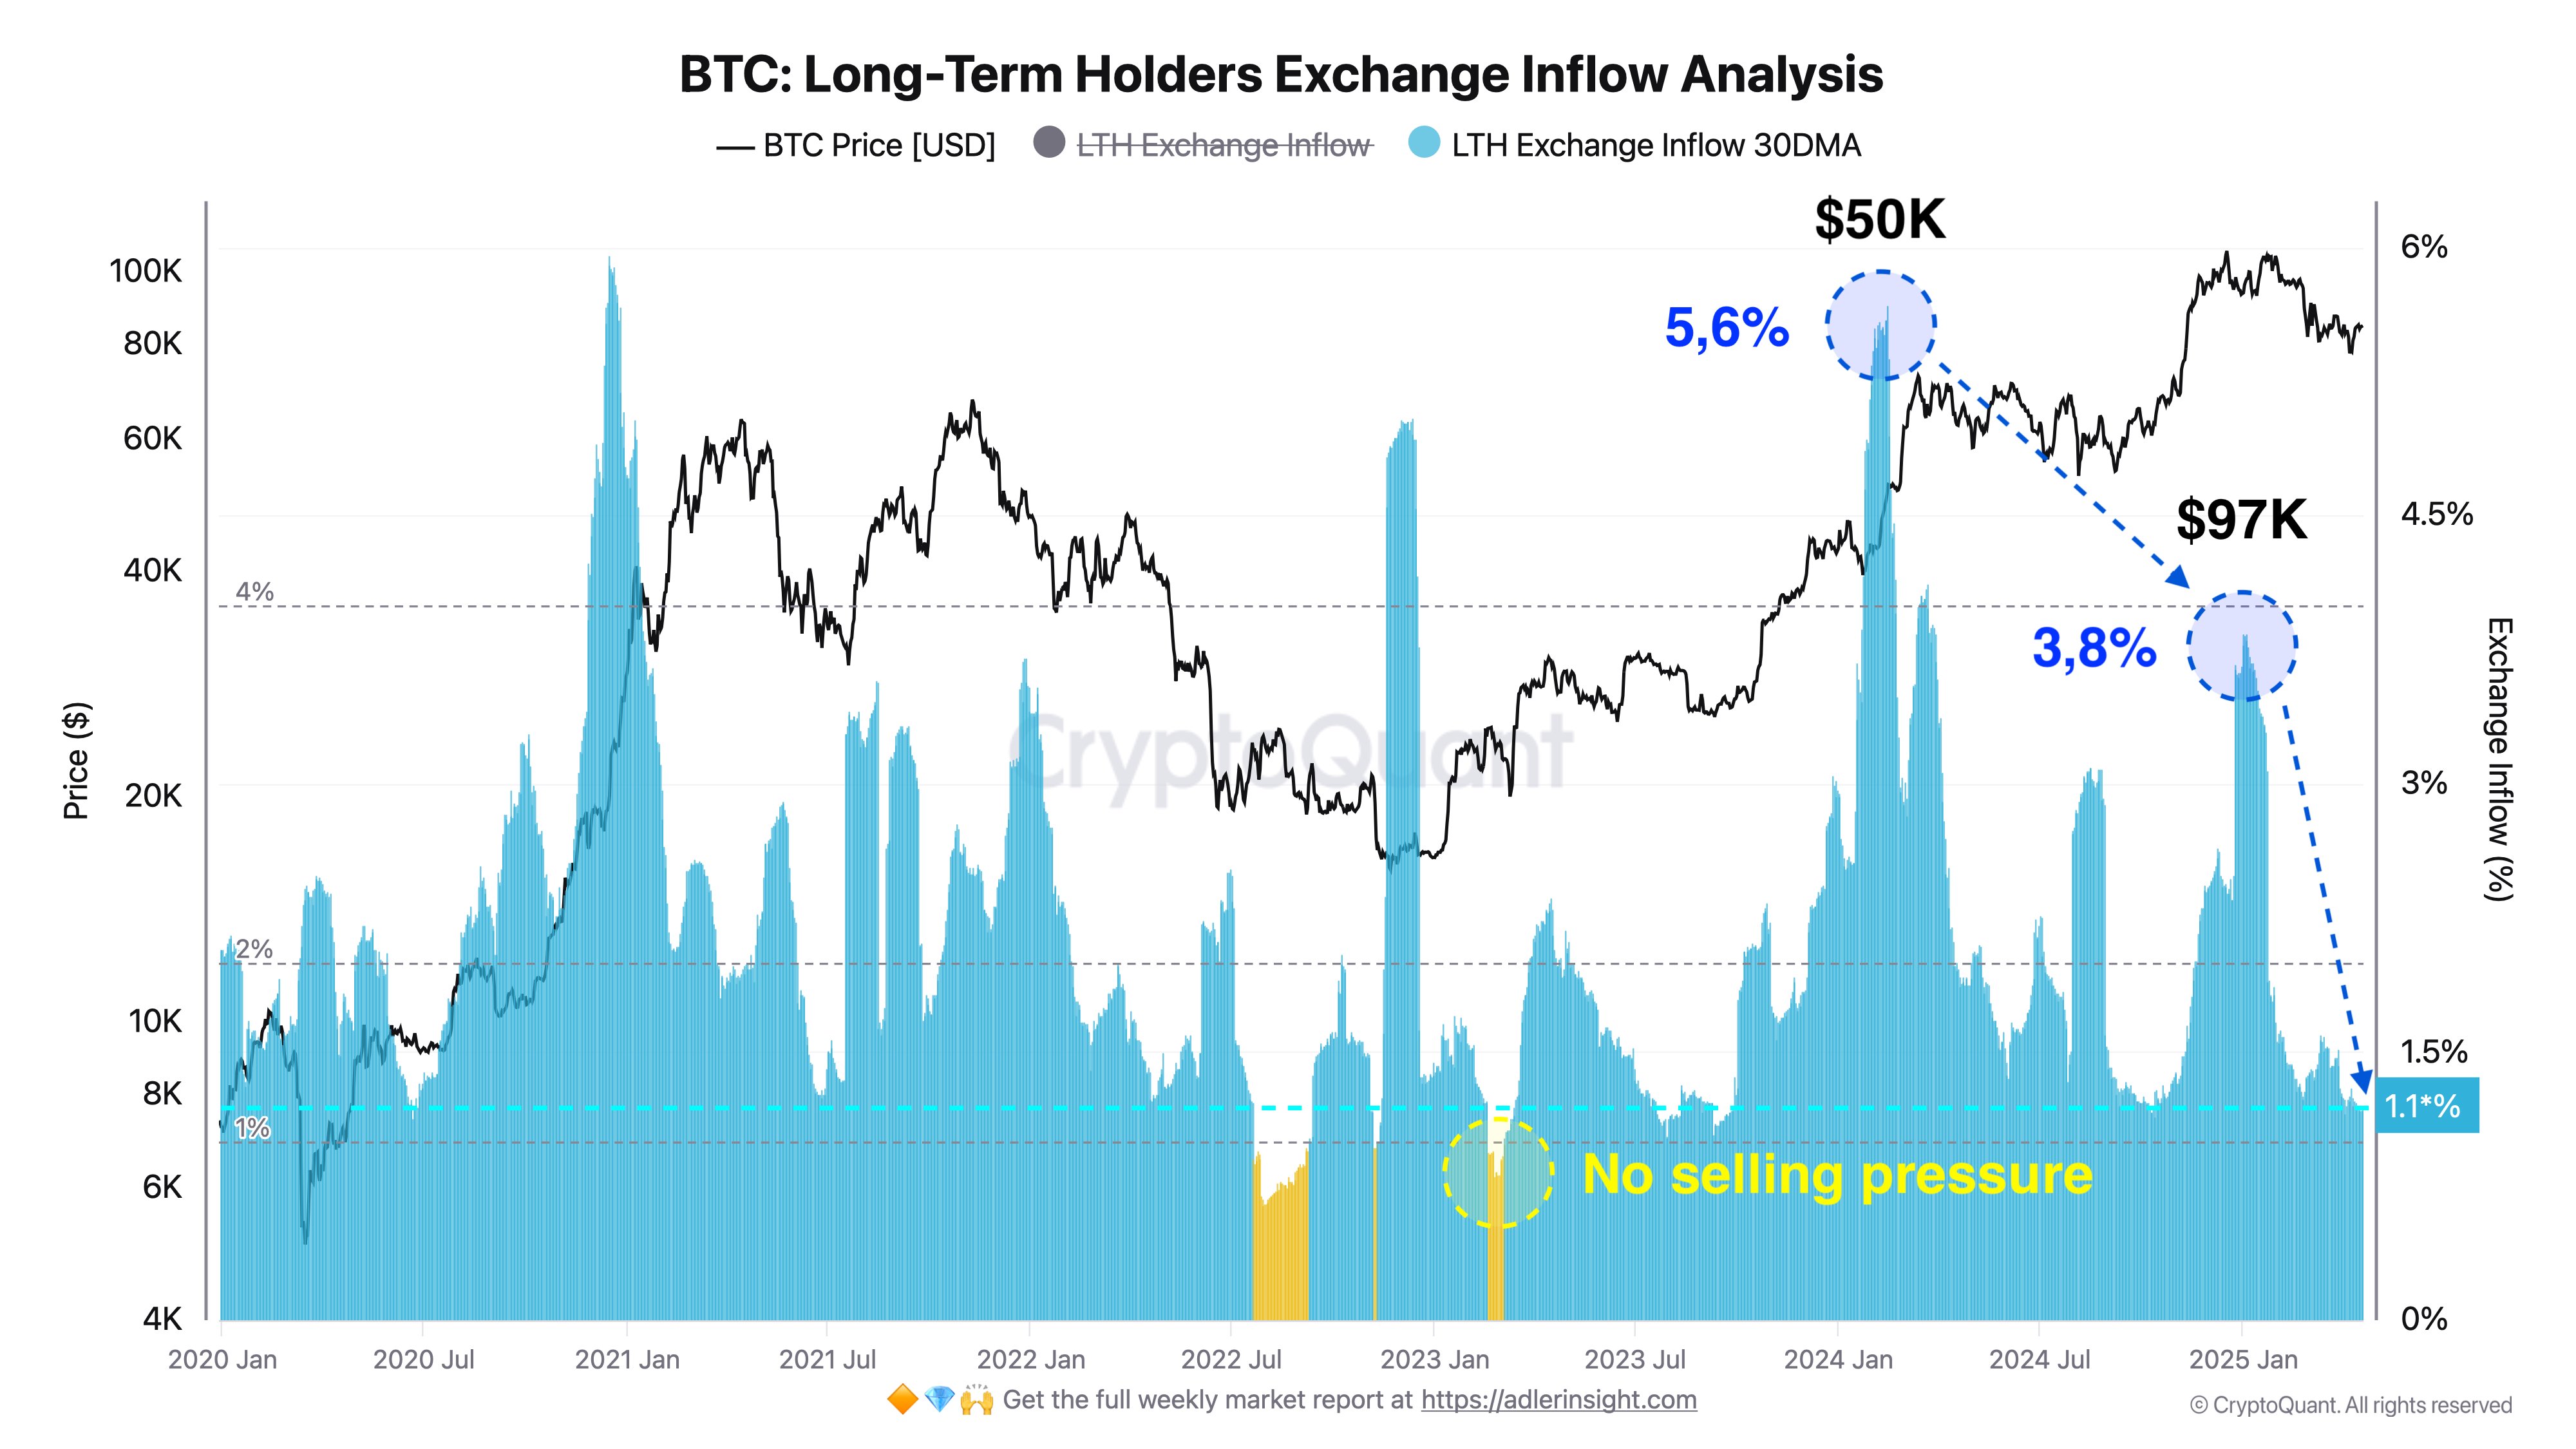
Adler explains that a further decline in these LTH exchange holdings to 1.0% would signal the total absence of selling pressure. Notably, this development could encourage new market entry and sustained accumulation, creating a strong bullish momentum in the BTC market.
Importantly, Alder highlights that the majority of the Bitcoin LTH entered the market at an average price of $25,000, Since then, CryptoQuant has recorded the highest LTH selling pressure of 5.6% at $50,000 in early 2024 and 3.8% at $97,000 in early 2025.
According to Adler, these two instances likely represent the primary profit-taking phases for long-term holders who intended to exit the market. Therefore, a resurgence in selling pressure from this cohort of BTC investors is unlikely in the short-term, which supports a building bullish case as long-term holders currently control 77.5% of Bitcoin in circulation.
BTC Price Overview
At the time of writing, Bitcoin was trading at $85,226 following a 0.36% gain in the past day and a 0.02% loss in the past week. Both metrics only reflect the ongoing market consolidation as BTC continues to struggle to achieve a convincing price breakout beyond $86,000.
Meanwhile, the asset’s performance on the monthly chat now reflects a 1.97% gain, indicating a potential trend reversal as the market correction ceases. Nevertheless, BTC remains in need of a strong market catalyst to ignite any sustainable price rally. With a market cap of $1.67 trillion, Bitcoin is ranked as the largest digital asset, controlling 62.9% of the crypto market.
Featured image from Adobe Stock, chart from Tradingview
Editorial Process for bitcoinist is centered on delivering thoroughly researched, accurate, and unbiased content. We uphold strict sourcing standards, and each page undergoes diligent review by our team of top technology experts and seasoned editors. This process ensures the integrity, relevance, and value of our content for our readers.

Vitalik Buterin Proposes to Replace EVM with RISC-V
US Economic Indicators to Watch & Potential Impact on Bitcoin

Solana Rallies Past Bitcoin—Momentum Tilts In Favor of SOL

Expert Says Solana Price To $2,000 Is Within Reach, Here’s How

Bitcoin Price Breakout In Progress—Momentum Builds Above Resistance

Here Are The Bitcoin Levels To Watch For The Short Term

2.52 Million Altcoins Are Ruining Crypto’s Future

Animoca Brands Valuation Tanks 75% In Two Years, Here’s Why

Crypto exchange BingX hacked for $43 million

Are The Big Players Losing Interest?

Hong Kong’s Securities Association Tips Authorities On Crypto Self-Regulation

Coinbase cbBTC Set to go Live on Solana
2.52 Million Altcoins Are Ruining Crypto’s Future
Animoca Brands Valuation Tanks 75% In Two Years, Here’s Why
Crypto exchange BingX hacked for $43 million
Are The Big Players Losing Interest?
Hong Kong’s Securities Association Tips Authorities On Crypto Self-Regulation
Coinbase cbBTC Set to go Live on Solana
-

 Ethereum22 hours ago
Ethereum Consolidates In Symmetrical Triangle: Expert Predicts 17% Price Move
-
 Market15 hours ago
1 Year After Bitcoin Halving: What’s Different This Time?
-

 Market21 hours ago
Today’s $1K XRP Bag May Become Tomorrow’s Jackpot, Crypto Founder Says
-

 Market19 hours ago
MELANIA Crashes to All-Time Low Amid Insiders Continued Sales
-

 Market20 hours ago
Charles Schwab Plans Spot Crypto Trading Rollout in 2026
-

 Ethereum21 hours ago
Ethereum Enters Historic Buy Zone As Price Dips Below Key Level – Insights
-

 Market16 hours ago
VOXEL Climbs 200% After Suspected Bitget Bot Glitch
-

 Ethereum24 hours ago
Ethereum Accumulators At A Crucial Moment: ETH Realized Price Tests Make-Or-Break Point