Altcoin
Veteran Trader Finds Ethereum Price Chart “Intriguing,” Rally Ahead?

Veteran trader Peter Brandt has once again captured the attention of the cryptocurrency community with his analysis of Ethereum’s chart, deeming it “very intriguing.” Brandt, renowned for his insightful analysis and decades of experience in financial markets, shared his perspective on Ethereum’s price action, sparking discussions among traders and investors.
Uncertainty Surrounds Ethereum Price Move
Brandt’s analysis of Ethereum’s chart comes at a crucial time as the cryptocurrency market navigates through volatility and uncertainty. Ethereum, the second-largest cryptocurrency by market value, recently experienced a series of price declines, mirroring Bitcoin’s downward trend. Ethereum price fell for three consecutive days to a low of $2,937 on May 8 and is currently trading at $3,000, up by 0.61% at the time of writing.
In his assessment, Brandt considered two chart patterns to gauge Ethereum’s potential trajectory. While he initially viewed the pattern as resembling a flag—a continuation pattern often observed during brief pauses in trends—Brandt later suggested it might align more with a channel due to its length. A channel forms when price action is controlled by two parallel, sloping lines, and the price has tested each line at least twice. Despite the uncertainty in labeling the pattern, Brandt emphasized the potential for a breakout in either direction.
ETH $ETH is becoming a very intriguing chart to me
The pattern is too long to be considered a flag, but a channel is the most likely labeling
I could go either way with this chart pic.twitter.com/EeSa7SyAmA— Peter Brandt (@PeterLBrandt) May 9, 2024
Brandt’s analysis underscores the need for careful consideration and analysis of Ethereum’s chart amidst the uncertainty surrounding its next price movements. Whether a flag or a channel, both patterns present possibilities of a breakout in either direction—up or down. Brandt expressed his neutrality towards the chart, stating, “I could go either way with this chart.”
Ethereum’s Market Sees Subtle Shifts Amid Open Interest Rise
In the 24-hour price analysis, Ethereum’s market exhibited subtle movements, indicated by key technical indicators such as the Relative Strength Index (RSI) and Stoch RSI. The RSI, positioned at 41.12, suggests Ethereum is neither significantly overbought nor oversold, signaling a potential phase of equilibrium or indecision within the market. This neutral positioning may lead to stability or slight price fluctuations in the short term.


Furthermore, the Stochastic RSI, a sensitive indicator signaling potential trend reversals, appears in the lower region. This indicates Ethereum might be approaching a condition where a short-term upward correction is possible following recent price declines.
Ethereum’s open interest (OI) has increased by over 2% in the last 24 hours, indicating growing interest and activity in the Ethereum market. This rise in OI may suggest a potential uptrend in the near future.
Read Also: Ripple & XRPL Labs Join Swirlds Labs & Algorand Foundation As Founding Members Of DeRec Alliance
The presented content may include the personal opinion of the author and is subject to market condition. Do your market research before investing in cryptocurrencies. The author or the publication does not hold any responsibility for your personal financial loss.
Altcoin
Solana Price Drops 15% Amid $46M Whale Dump, Will SOL Recover Anytime Soon?

Solana price has extended weekly losses to 14% amid heightened selling pressure for the cryptocurrency. Whale data on Friday revealed that roughly $46M worth of SOL was unstaked and offloaded to exchanges in recent days. The outcome? Crypto market traders and investors are speculating if a recovery is even possible ahead as the broader market faces turmoil amid Trump’s reciprocal tariff announcement.
Solana Price Takes Bearish Turn Amid Rising Whale Dumps, What’s Happening?
As of press time, Solana price traded at $115.91, down slightly over 3% in the past 24 hours. The weekly chart for the crypto showcases a 14% decline, further accompanied by a monthly drop of over 18%. This waning action falls in line with the recent broader market trends and heightened selling pressure for the cryptocurrency.
Data from the tracker Lookonchain suggested that crypto whales are on a SOL dumping spree in tandem with the coin’s slumping action. Notably, 4 wallet addresses collectively unstaked and offloaded $46 million worth of coins in the past 24 hours, per whale data.
Here Are The Addresses & Amounts of SOL Dumped
- ‘HUJBzd’ – $30.3 million worth of coins.
- ‘BnwZvG’ – $9.47 million worth of coins.
- ‘8rWuQ5’ – $3.53 million worth of coins.
- 2UhUo1′ – $3 million worth of coins.
For context, usual market sentiments reflect bearishness in light of such massive dumps as the selling pressure for a crypto increases. Solana’s waning price action has contributed to investors’ cautious outlook toward the coin amid negative market dynamics.
SOL Price Faces Pressure Amid Broader Trends
It’s worth pointing out that SOL is currently facing immense heat due to broader macro trends presenting risk assets with uncertainty. CoinGape recently reported that Bitcoin price saw an offsetting movement with Donald Trump’s reciprocal tariffs commencement. In turn, even the altcoin market mimicked a bearish movement lately.
Another report revealed that BTC price is expected to follow the stock market action in light of the new reciprocal tariffs. Matrixport strongly asserted that the broader crypto market could potentially sustain volatility in the short run as BTC price is expected to mimic stock market movements.
Analyst Forecasts Bullish Outlook Despite Downtrend
However, a crypto market analyst named ‘Brandon Hong’ has conversely highlighted a bullish outlook for Solana price regardless of the broader turmoil. The analyst recently posted on X, stating, “SOL is about to have its biggest breakout ever.”


This bullish anticipation rides the back of the coin about to break its 400-day range. “Buy now or regret later,” the analyst concluded, sparking contrary speculations. Crypto market participants continue to extensively eye the token for price action shifts amid uncertain dynamics.
Disclaimer: The presented content may include the personal opinion of the author and is subject to market condition. Do your market research before investing in cryptocurrencies. The author or the publication does not hold any responsibility for your personal financial loss.
Altcoin
Cardano Price Can Clinch $1 As It Eyes Bounce From New Support Zone

While predictions for Cardano to $1 may seem like a far cry, a cryptocurrency expert has injected new life into the claims. Cardano’s price is headed below 50 cents in search of a new support zone that can serve as a springboard to reach new highs.
Cardano Price Can Still Clinch $1 Despite Price Slump
Market technician Jonathan Carter in an analysis on X predicts that Cardano’s price can reclaim the $1 price point in the coming months. According to Carter, the recent ADA correction will not be a hindrance for Cardano’s price to reach $1.
ADA has lost a jarring 13% over the last week and trades at $0.64 in an unremarkable week for the cryptocurrency. On the daily charts, prices have generally moved sideways, underscoring a lack of investor enthusiasm.
For Carter, Cardano’s recent decline has seen it fail to stay above the $0.65 support level. The analyst opined that a downtrend is the offing for the Cardano price that could see a new support zone of $0.59. Carter says the new $0.59 support zone will hurl Cardano price to reach $1.


“Despite the long correction, the price still has a chance to bounce off this support and rise towards $1,” said Carter. “Otherwise, we will fall to the lower border of the broadening wedge.”
While some investors are eyeing an ADA bounce to $0.70, a plausible play will be a slump below $0.60 before the start of a rally.
A Slew Of Positives For ADA
Despite the pervading negative sentiment around ADA price, the cryptocurrency has a wave of positive fundamentals going for it. Cardano price spiked following Charles Hoskinson’s confirmation of Ripple’s RLUSD on ADA.
Furthermore, Charles Hoskinson reveals that Cardano will play a major role in Bitcoin decentralized finance (DeFi) application. In more positive technicals, Cardano price is forming a cyclical pattern from 2024 that can send prices to astronomical proportions in May.
While the prediction pegged prices at $2.5, optimists say ADA price to $10 is not a crazy hypothesis. The report cites present solid fundamentals and ADA’s over 1,000% spike to set its all-time high back in 2021 as pointers for the seismic rally to $10.
Disclaimer: The presented content may include the personal opinion of the author and is subject to market condition. Do your market research before investing in cryptocurrencies. The author or the publication does not hold any responsibility for your personal financial loss.
Altcoin
Expert Reveals XRP Price Could Drop To $1.90 Before Rally To New Highs
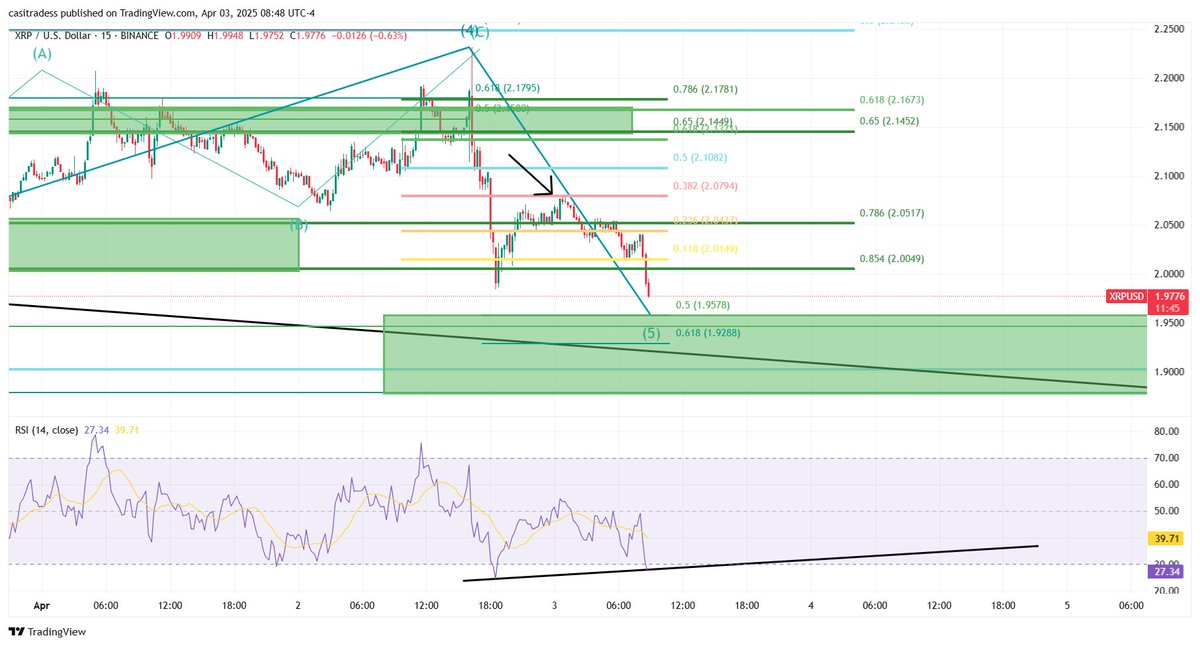
Crypto analyst CasiTrades has provided a roadmap for the XRP price, revealing what could happen before the altcoin reaches a new all-time high (ATH). Based on her analysis, XRP could still witness a price decline before it potentially rallies past its current ATH of $3.4.
XRP Price Could Drop To $1.9 Before Rally To New Highs
In an X post, CasiTrades stated that in the event of a deeper flush, the XRP price could wick down to $1.90, suggesting that the altcoin could visit this low before it rallies to new highs. She believes XRP will ideally hold above this $1.90 and avoid dropping to new lows.
The crypto expert noted that the next move is critical. She claimed that if XRP gets that flush with bullish RSI divergence, it could mark the bottom before the altcoin rockets into Wave 3. However, CasiTrades warned that a break below $1.90 could force a reset of the entire new trend count.
Meanwhile, there is still the possibility that the XRP price might not drop to as low as $1.90. CasiTrades stated that $1.95 is the prime target, with subwaves heavily aligning there and a drop to $1.90 only likely to occur in the event of a deeper flush.
It is worth mentioning that US President Donald Trump recently announced reciprocal tariffs on all countries, a move which is set to ignite a global trade war and is bearish for XRP and the broader crypto market. As such, this development could be what sparks the deeper flush and send the altcoin to as low as $1.90.
A Drop To $1.4 Is Also The Cards
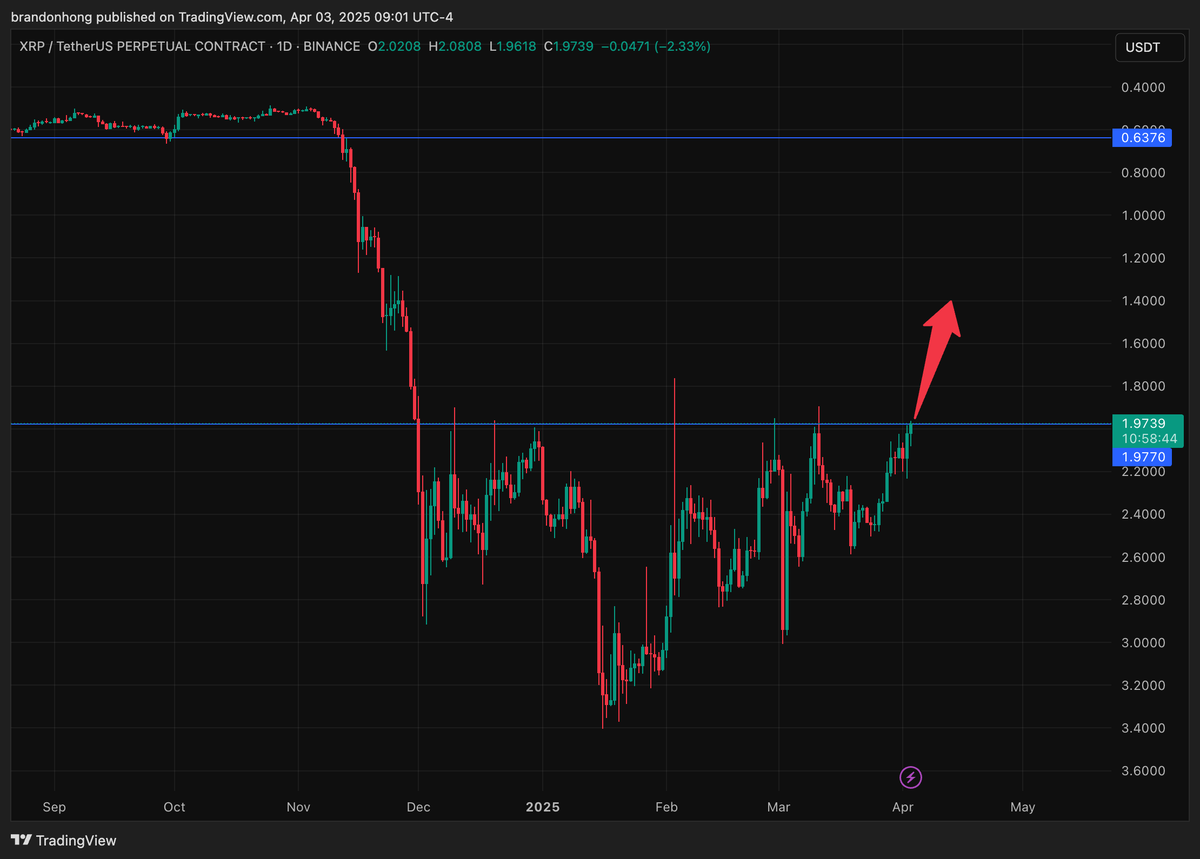
In an X post, crypto analyst Brandon asserted that the XRP price is about to have a massive breakout, to the downside. His accompanying chart showed that XRP could drop to as low as $1.4.
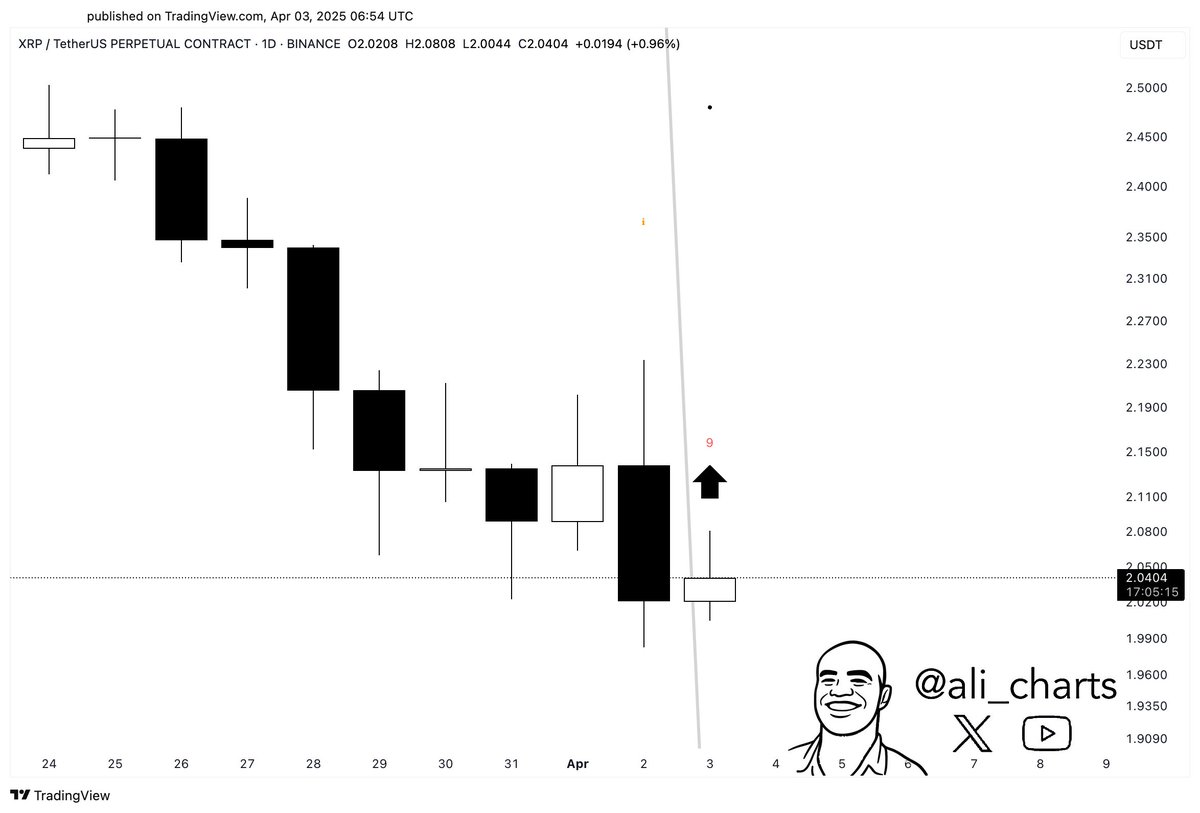
On the other hand, crypto analysts such as Ali Martinez have provided a bullish outlook for the XRP price. In an X post, he stated that XRP could be setting up for a rebound. The analyst further remarked that the altcoin is holding above $2 while the TD Sequential flashes a buy signal.
Crypto analyst Javon Marks also recently predicted that Ripple’s coin could surge 44x and reach as high as $99. He alluded to the 2017 bull run as the reason why he is confident that the altcoin could record such a parabolic rally.
Disclaimer: The presented content may include the personal opinion of the author and is subject to market condition. Do your market research before investing in cryptocurrencies. The author or the publication does not hold any responsibility for your personal financial loss.
-

 Market19 hours ago
Bitcoin’s Future After Trump Tariffs
-

 Market23 hours ago
IP Token Price Surges, but Weak Demand Hints at Reversal
-

 Altcoin23 hours ago
Movimiento millonario de Solana, SOLX es la mejor opción
-

 Ethereum22 hours ago
Ethereum Trading In ‘No Man’s Land’, Breakout A ‘Matter Of Time’?
-

 Bitcoin22 hours ago
BlackRock Approved by FCA to Operate as UK Crypto Asset Firm
-

 Market22 hours ago
HBAR Foundation Eyes TikTok, Price Rally To $0.20 Possible
-

 Altcoin22 hours ago
John Squire Says XRP Could Spark A Wave of Early Retirements
-

 Market21 hours ago
10 Altcoins at Risk of Binance Delisting




✓ Share: