
Altcoin
Shiba Inu Burns Slow To A Crawl With Only 2 Transactions In 24 Hours, What’s Happening?


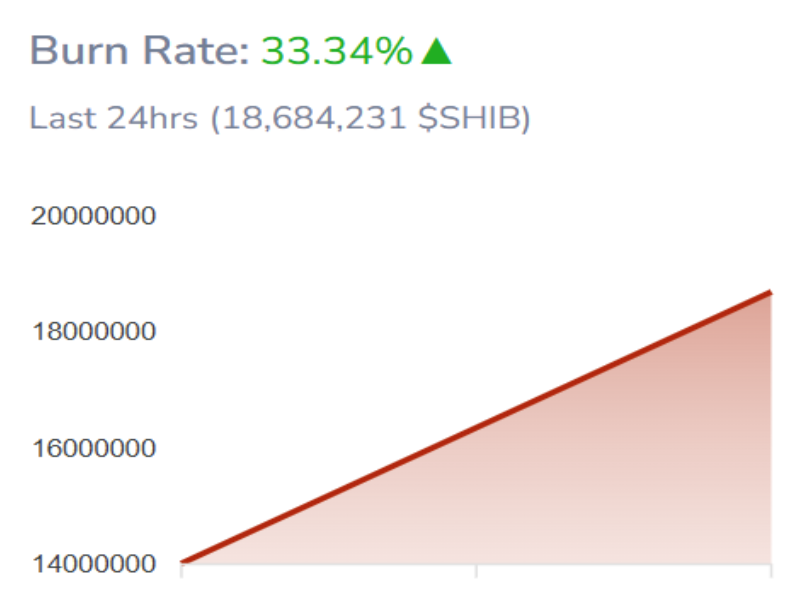
After a slow start to the week, Shiba Inu’s burn activity has sprung back to life with a 33% spike in the last 24 hours, according to data from Shibburn.com. The jump comes amid a noticeable dip in the number of SHIB burn transactions, which raises the question of whether these burns can have any effect on Shiba Inu’s struggle to transition away from selling pressure.
Small But Noteworthy SHIB Burn Amid Sluggish Market Conditions
The Shiba Inu burn metric is one of the most essential factors in determining the sentiment surrounding the meme coin. The latest burn activity has seen a total of 18,684,231 SHIB permanently removed from circulation in the past 24 hours, translating to a 33% increase from the previous 24-hour period. These burns were delivered through four separate transactions, the most significant of which involved 16,035,545 tokens sent to a burn address. This was followed by three smaller burns of 1,070,154, 788,643, and 789,889 SHIB, respectively.
Although these figures are modest compared to past high-volume burn sessions, they are notable, considering how subdued SHIB burns have been in recent days. Notably, SHIB’s burn rate remained unusually stagnant throughout this week. Current crypto market sentiment played a considerable role in this slow down in burns, with the Shiba Inu price essentially declining for the majority of the week. Therefore, the sudden 33% jump raises questions of whether this is a one-off spike.
Burn Rate Falls Short Of Meaningful Tokenomic Impact – Bullish Technical Signs?
Even with the 33% boost, the current SHIB burn rate is far too small to have a transformative effect on the token’s supply dynamics. Shiba Inu currently has a supply of over 500 trillions tokens, making these burn volumes a drop in the ocean. As such, the Shiba Inu tokenomics will likely remain unchanged at the current rate without sustained and exponential increases in daily burns.
In terms of price action, the Shiba Inu price has been tethered to the $0.0000125 and $0.000013 range. Despite this, some analysts remain optimistic.
One analyst pointed to a bullish ascending triangle forming on SHIB’s chart and predicted that the meme coin is ready to bounce off the lower trendline of this triangle and push to new highs. This outlook is most likely in reaction to Shiba Inu’s recent double bounce on support at $0.0000125.
If it holds this level and successfully pushes through the resistance at $0.000013, momentum could begin to shift back in favor of the bulls. A healthy and continuous burn rate, while not a miracle solution, could contribute to this recovery by creating positive sentiment.
At the time of writing, Shiba Inu is trading at $0.00001272, down by 1% in the past 24 hours. Shiba Inu’s trading volume is also down by 14.5% in the same timeframe, according to data from Coinmarketcap.
Featured image from DALL-E, chart from TradingView
Editorial Process for bitcoinist is centered on delivering thoroughly researched, accurate, and unbiased content. We uphold strict sourcing standards, and each page undergoes diligent review by our team of top technology experts and seasoned editors. This process ensures the integrity, relevance, and value of our content for our readers.


Dogecoin price is attracting renewed attention from technical analysts, with several chart formations pointing to a meme coin rally. According to multiple analysts, DOGE price is displaying a combination of technical indicators and structures that suggest the potential for a 10X rally. These include a breakout from a triangle pattern, a developing “cup and handle” formation, and historical pattern similarities to the 2017 bull market.
Dogecoin Price Prediction: Chart Patterns Point to 10X Meme Coin Rally
In a recent post on X, analyst Trader Tardigrade shared a chart showing the MACD indicator breaking out from a triangle formation. This setup has historically been linked with strong upward momentum in Dogecoin price. The MACD breakout is accompanied by a rounded bottom pattern, often seen as a preparatory phase before bullish moves.
Notably, during previous instances in September and March, similar MACD triangle breakouts occurred. In both cases, the breakout led to a rapid acceleration in Dogecoin price. These historical movements suggest that the current meme coin rally may lead to a new all-time high.

The MACD lines have crossed again in recent sessions, with the indicator moving above the triangle’s downtrend line. Analysts are observing similar conditions that were present during previous rallies. The upward curl in the price structure reinforces the breakout narrative.
Meanwhile, following the recent move by House of Doge, market analysts are forecasting a 16% rise in Dogecoin price as bullish momentum builds.
Cup and Handle Pattern Suggests Upside Toward $2.00
Additionally, according to Crypto Elites, DOGE price is forming a cup and handle pattern, a technical formation often associated with bullish continuation. The rounded bottom of the cup has already developed, and the handle phase is underway. This formation typically leads to a breakout once the price surpasses the neckline resistance.
The key resistance level is positioned near $0.185. A confirmed break above this threshold could open the door to a sharp upward movement. Based on this chart pattern, the projected target is in the $1.85 to $2.00 range. The projection is calculated using the depth of the cup formation.

However, the analyst noted that the current retracement to the handle’s lower range may act as a support zone. This area has historically been where momentum builds ahead of breakouts.
Historical Behavior Resembling 2017 Cycle
Concurrently, analyst KrissPax has identified similarities between the current Dogecoin price movement and the 2017 bull run. KrissPax posted a chart on X that compares both periods, showing the current phase aligning closely with the structure before DOGE price previous surge. According to the chart, the current meme coin cycle could extend beyond the previous all-time high.
KrissPax projected that the top meme coin could rise to $4 if the second major breakout occurs, similar to the 2017 pattern. While this is a longer-term scenario, it is based on recurring patterns observed in past market cycles.
A recent CoinGape report supports the bullish outlook on DOGE price, noting that a breakout above the $0.18 resistance could ignite a meme coin rally toward the $20 mark.
Ronny Mugendi
Ronny Mugendi is a seasoned crypto journalist with four years of professional experience, having contributed significantly to various media outlets on cryptocurrency trends and technologies. With over 4000 published articles across various media outlets, he aims to inform, educate and introduce more people to the Blockchain and DeFi world. Outside of his journalism career, Ronny enjoys the thrill of bike riding, exploring new trails and landscapes.
Disclaimer: The presented content may include the personal opinion of the author and is subject to market condition. Do your market research before investing in cryptocurrencies. The author or the publication does not hold any responsibility for your personal financial loss.

Ethereum price is attracting renewed market attention as analysts present technical scenarios pointing toward a potential move above the $2100 mark. Recent analyses from experts suggest that Ethereum price behavior is showing both bullish short-term structure and macro-level cyclical patterns, which could support an upward continuation if key levels hold.
Ethereum Price Could Surge Past $2100 on Liquidity Grab
Analyst Crypto Patel shared insight on the X platform, identifying a bullish price setup on the ETH/USDT chart. According to Patel, the top altcoin has shown a strong displacement move to the upside, which has led to a shift in market structure. This move followed a reaction from a previously identified bullish Point of Interest (POI).
Ethereum price is reacting positively from a key mitigation block near $2064.60, indicating strong institutional demand. The mitigation block represents a zone where the top altcoin price retraced after a breakout, often used by institutional traders to mitigate prior orders before continuing the trend. This setup places the entry for a long position within the upper mitigation zone, aligning with smart money principles.

The price target of $2128.12 aligns with a swing high liquidity zone, suggesting a likely smart money-driven move upward. These zones often hold clustered stop-loss orders and pending buy positions. A move into this area could allow investors to capture liquidity before a reversal. Patel sets a stop-loss at $2027.20, just below the mitigation block, providing a defined risk level if the altcoin price structure fails.
Current ETH Cycle Compared to 2018–2020 Pattern
Another analyst, TimeFreedomROB, posted a chart on X comparing Ethereum price weekly structure to its 2018–2020 cycle. The analysis shows ETH breaking below an ascending triangle, mirroring its past breakdown below a descending triangle before its major 2020 recovery. In that prior cycle, ETH price formed a macro bottom and rallied from under $100 to nearly $4800.
According to the chart, Ethereum price is currently trading near $2060. It recently broke below the $2300 psychological level and tested the lower diagonal trendline around $1800. This area corresponds with horizontal demand levels from previous years. The chart implies this could represent a final shakeout phase before a strong upward move, similar to historical cycles.

The support zone between $1800 and $2000 has acted as a long-term base in earlier market periods. A reclaim of the $2200–$2400 range is important for Ethereum price to confirm a shift back into bullish momentum on the weekly timeframe.
Altcoin Price Prediction
Additionally, the macro view provided by TimeFreedomROB outlines possible reversal targets if the price continues to follow historical patterns. In 2020, ETH saw a 40x increase following structure reclaim. While current conditions differ, the projected path includes potential resistance levels at $3600, $4870, and an extended range of $6000–$7500.
Supporting the bullish projections, analyst MAXPAIN noted that ETH price could retrace to the $1,900 zone before a potential rally to $3,000. His analysis, based on the TPO chart, identifies the $1,874–$1,924 range as a key support and accumulation area.
The top altcoin is currently trading at $2,064.98, showing an 8.10% gain over the past 7 days. Its market cap stands at $249.12 billion, with a 24-hour trading volume of $11.71 billion.
Ronny Mugendi
Ronny Mugendi is a seasoned crypto journalist with four years of professional experience, having contributed significantly to various media outlets on cryptocurrency trends and technologies. With over 4000 published articles across various media outlets, he aims to inform, educate and introduce more people to the Blockchain and DeFi world. Outside of his journalism career, Ronny enjoys the thrill of bike riding, exploring new trails and landscapes.
Disclaimer: The presented content may include the personal opinion of the author and is subject to market condition. Do your market research before investing in cryptocurrencies. The author or the publication does not hold any responsibility for your personal financial loss.

Crypto analyst Dark Defender has issued a bold outlook for XRP, stating on X that the asset is on a clear path toward multiple upside targets. His remarks come at a time when the asset bulls are trying to hold a support level at $2.42, with technical patterns suggesting the asset may be preparing for a significant breakout.
XRP Faces Minor Resistance on the Way to $2.75, $5.85 in Sight
XRP’s price action is starting to see some positive note, recently pushing as high as $2.56 in a 7-day timeframe. Although it met resistance and reversed on a downtrend early last week, it eventually found support at $2.36 and started a fresh uptrend. This up-and-down movement is seemingly an average price action playout, but technical analysis on the daily candlestick timeframe chart shows that the price quietly changed a downward sloping resistance trendline into support at $2.36.
Now, the next outlook for the altcoin is an upward movement after this fresh uptrend above the resistance trendline. With this in mind, crypto analyst Dark Defender predicted that the cryptocurrency is on the road to $5.85. The analyst also highlighted, a closer price target at $2.75, though noting that XRP may experience some difficulty breaking through $2.55.

The predicted difficulty at $2.55 is in response to its rejection last week. However, Dark Defender’s phrasing was straightforward; “XRP looks excellent,” reflecting strong conviction in the token’s current setup after his analysis.
Exponential Fibonacci: $5.85 Isn’t The Limit For The Altcoin
Dark Defender’s prediction of a $5.85 price target for XRP would see the crypto breaking above its current all-time high. However, this pales in comparison to the analyst’s long-term projection.
The projection to $5.85 is only one part of Dark Defender’s broader analysis. In a previous post, he outlined a more ambitious long-term scenario using exponential Fibonacci levels and Elliott Wave theory. According to him, the common belief that XRP cannot exceed $10 is a misunderstanding of exponential modeling. He argued that the altcoin is currently in an impulse wave 3 on a multi-year timeframe. If wave 3 fully extends during this phase, it could reach $77.7, with wave 5 targeting a three-digit price zone.
His roadmap emphasizes staying above the $2.3951 median, a level he says has been in play since November. From there, the chart suggests a run to $8, which could lead the asset toward a new range between $18 and $23. These projections are based not only on wave extensions but also on volume trends, RSI behavior, and repeating historical patterns, which the analyst believes all align to support an incoming rally.
At the time of writing, XRP is trading at $2.42.
Featured image from iStock, chart from Tradingview.com
Editorial Process for bitcoinist is centered on delivering thoroughly researched, accurate, and unbiased content. We uphold strict sourcing standards, and each page undergoes diligent review by our team of top technology experts and seasoned editors. This process ensures the integrity, relevance, and value of our content for our readers.

PI Coin Decline Continues as Market Participation Dwindles

XRP Loses Steam After SEC Win, Enters Consolidation Mode
Dogecoin Price Set To Rally 10X Amid This Bullish Pattern

This is Why Q2 2025 Could Be Bullish for Crypto Markets

Ethereum Forms Complex iH&S Structure, Why $18,000 Is The Possible Target
Ethereum Price Eyes Breakout as Analyst Predicts Next Leg Up Above $2100

2.52 Million Altcoins Are Ruining Crypto’s Future

Animoca Brands Valuation Tanks 75% In Two Years, Here’s Why

Crypto exchange BingX hacked for $43 million

Are The Big Players Losing Interest?

Hong Kong’s Securities Association Tips Authorities On Crypto Self-Regulation

Coinbase cbBTC Set to go Live on Solana
2.52 Million Altcoins Are Ruining Crypto’s Future
Animoca Brands Valuation Tanks 75% In Two Years, Here’s Why
Crypto exchange BingX hacked for $43 million
Are The Big Players Losing Interest?
Hong Kong’s Securities Association Tips Authorities On Crypto Self-Regulation
Coinbase cbBTC Set to go Live on Solana
-

 Market23 hours ago
Ethereum Price Back Above $2,000—Breakout or Just a Temporary Bounce?
-

 Market19 hours ago
XRP Price Consolidates—Breakout Incoming or More Choppy Moves?
-
 Altcoin19 hours ago
Ethereum Price To Hit $5K Before SOL Rally To $300, Arthur Hayes Says
-

 Altcoin12 hours ago
CBOE Files 19b-4 For Fidelity’s Solana ETF With US SEC
-

 Market18 hours ago
BlackRock Expands Bitcoin ETPs to Europe After US ETF Success
-
 Altcoin18 hours ago
Why Is Pi Coin Price Down 5% Today?
-

 Market17 hours ago
Bitcoin Price Dips After Rally—Is This the Perfect Entry Point?
-
 Market22 hours ago
Bitcoin Price Breaks Out with First Spot ETF Inflows in A Month
✓ Share: