Altcoin
Most Altcoins Now In ‘Opportunity’ Zone, Santiment Reveals


The on-chain analytics firm Santiment has revealed how the majority of the altcoins are currently in what has historically been a buy zone.
Mid-Term Trading Returns Are Extremely Negative For Most Altcoins
In a new post on X, Santiment has shared an update for its MVRV Opportunity & Danger Zone Divergence Model for the various altcoins in the sector. The model is based on the popular “Market Value to Realized Value (MVRV) Ratio.”
The MVRV Ratio is an on-chain indicator that basically tells us whether the investors of a cryptocurrency as a whole are holding their coins at a net profit or loss.
When the value of this metric is greater than 1, it means the average investor is holding a profit. On the other hand, it being under this threshold suggests the dominance of loss.
Historically, holder profitability is something that has tended to have an effect on the prices of digital assets. Whenever the investors are in large profits, they can become tempted to sell their coins in order to realize the piled-up gains. This can impede bullish momentum and result in a top for the price.
Similarly, holders being significantly underwater results in market conditions where profit-takers have run out, thus allowing for the cryptocurrency to reach a bottom.
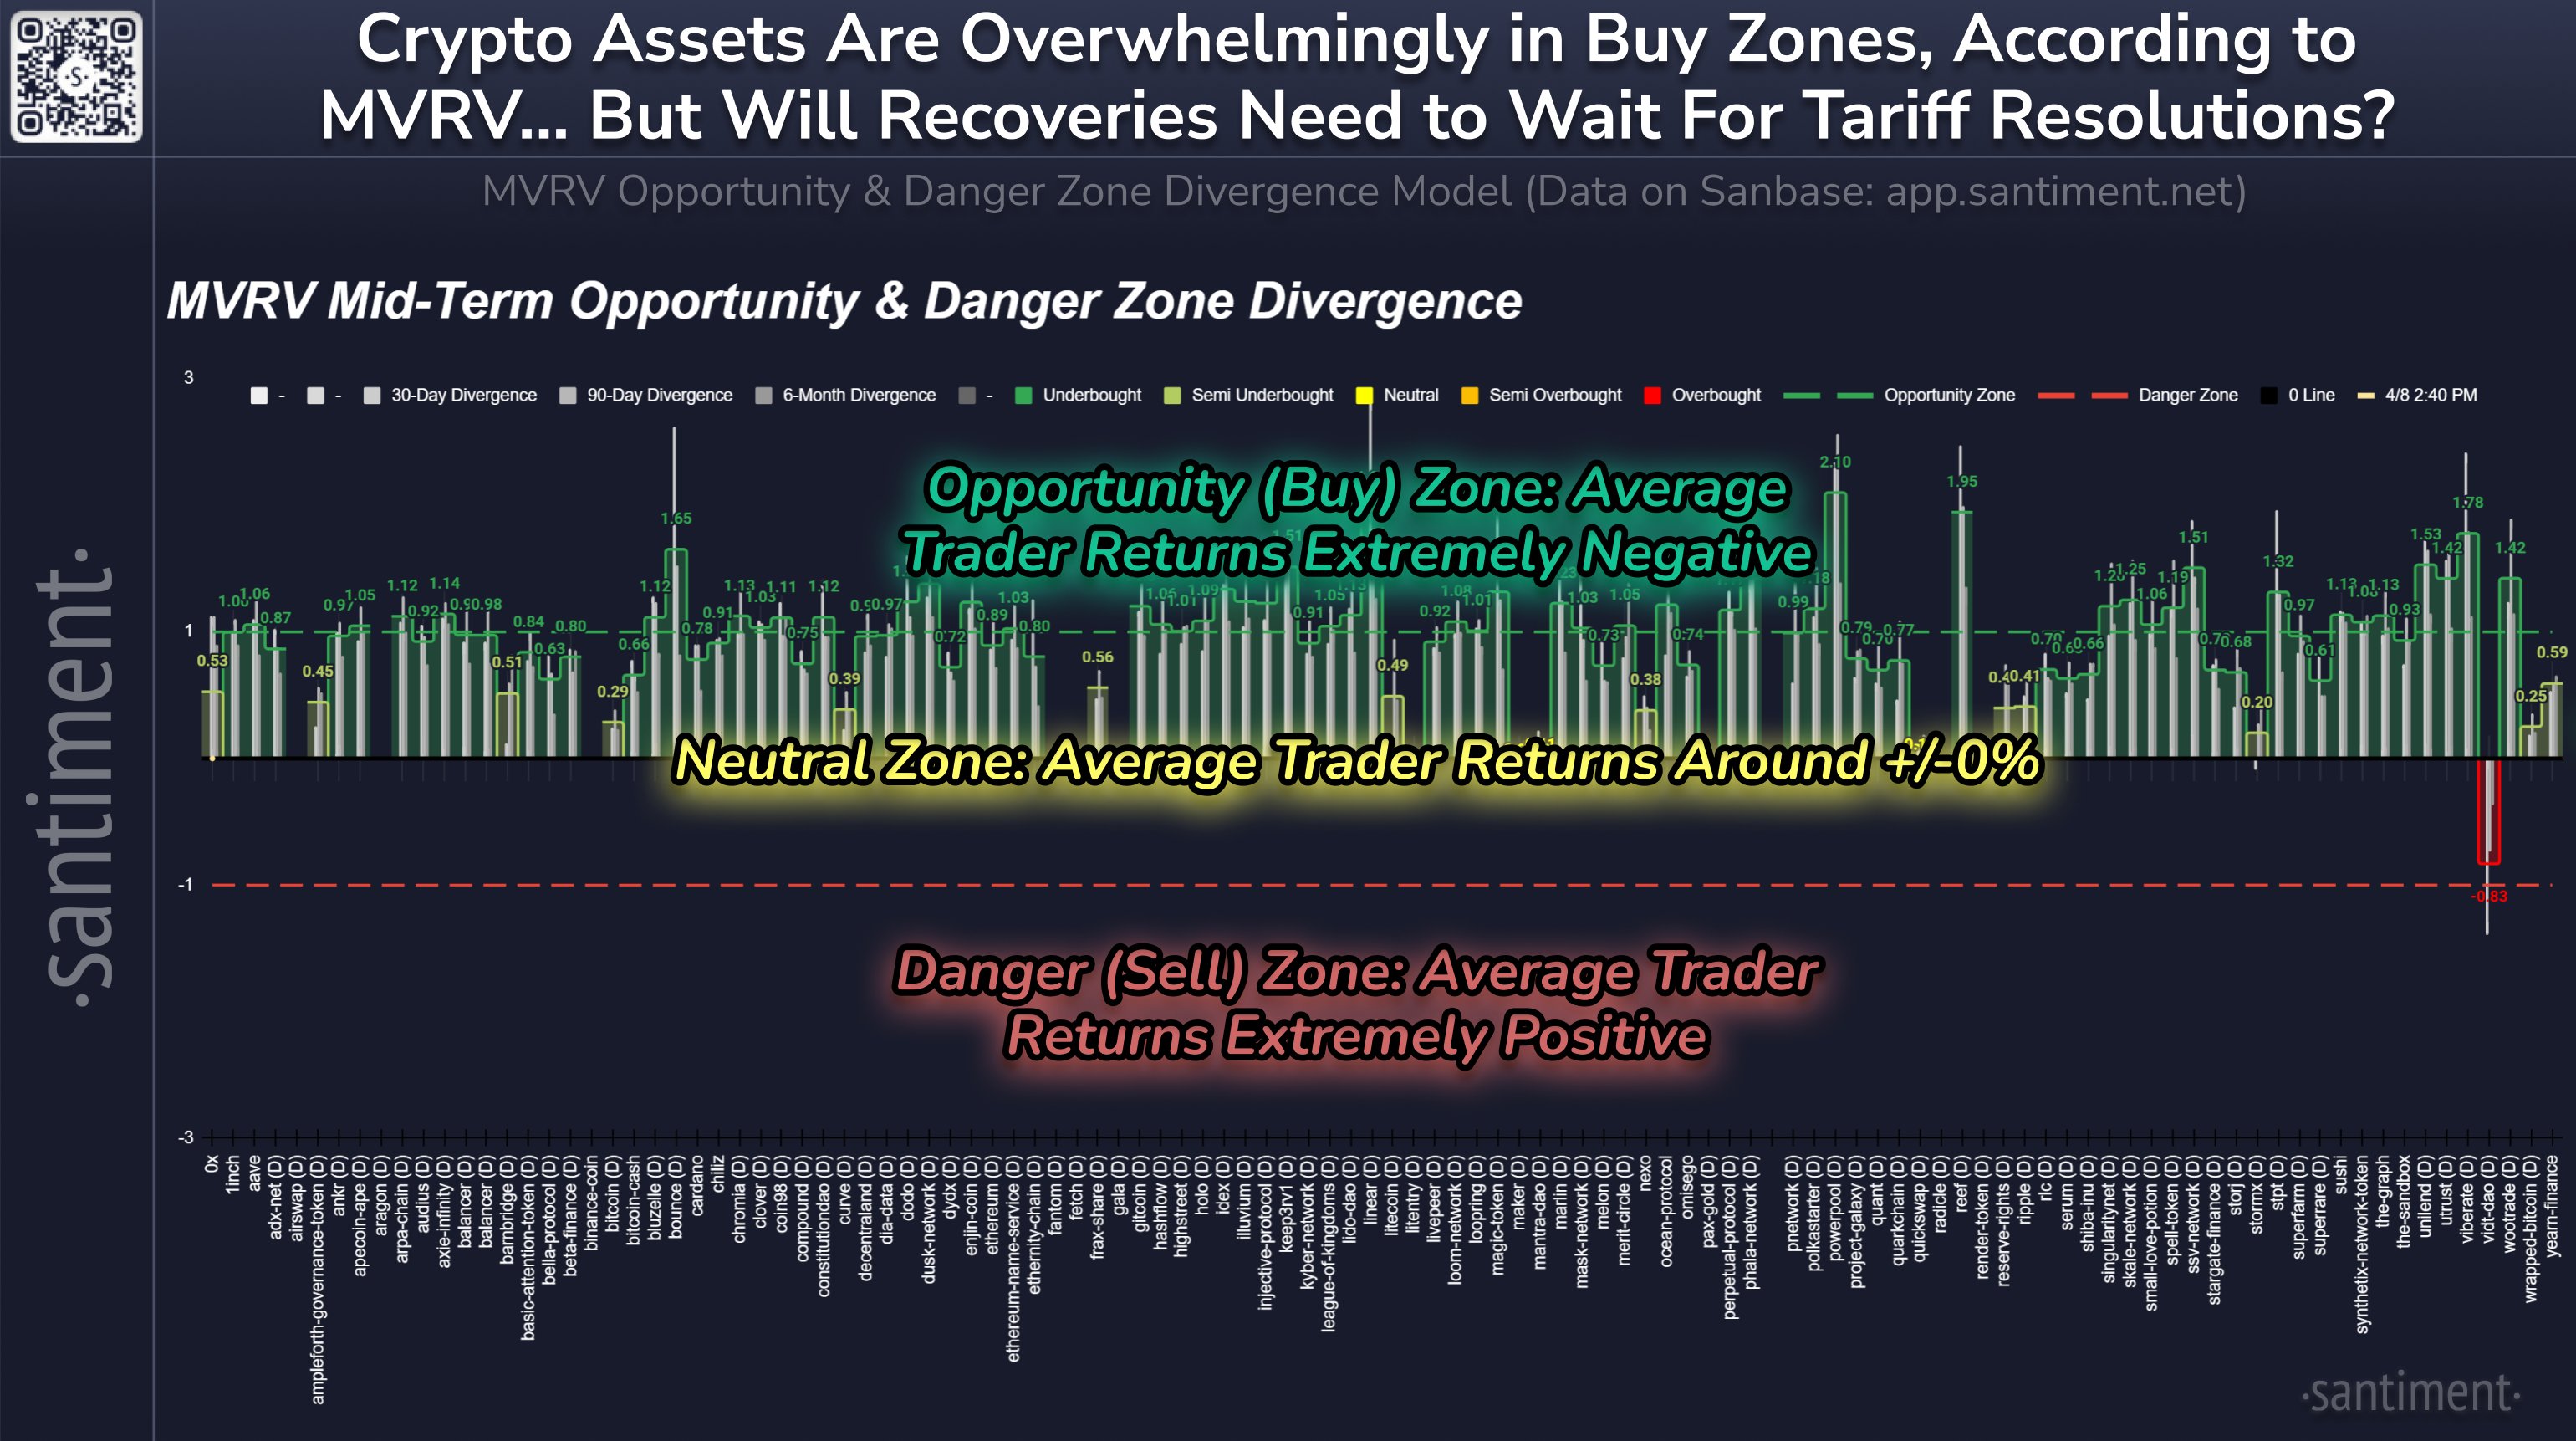
Santiment’s MVRV Opportunity & Danger Zone Divergence Model exploits these facts in order to define buy and sell zones for the altcoins. The model calculates the divergence of the MVRV Ratio on various timeframes (30 days, 90 days, and 6 months) to find whether an asset is inside one of these zones or not.
Here is the chart shared by the analytics firm that shows how the different altcoins are currently looking based on this model:
Looks like most of the sector is currently in the buy region | Source: Santiment on X
In this model, a value greater than zero suggests average trader returns are negative for that timeframe and that below it is positive. This is the opposite orientation of what it’s like in the MVRV Ratio, with the zero level taking the role of the 1 mark from the indicator.
From the graph, it’s visible that almost all of the altcoins have their MVRV divergence greater than zero on the different timeframes. Out of these, most of them have their mid-term MVRV divergence greater than 1. The opportunity zone mentioned earlier lies beyond this mark, so the model is currently showing a buy signal for the majority of the altcoins.
The average negative returns have come for these coins as the market has been in turmoil following the news related to tariffs. While the model may be showing a buy signal for the altcoins, it’s possible that this uncertainty will continue to haunt the market. As Santiment explains,
If and when a global tariff solution is reached, it would undoubtedly trigger a very rapid cryptocurrency recovery,” notes However, this is currently a very big “if” based on the latest media coverage on what is quickly being referred to as a full-fledged “trade war” between the US and the majority of the world.
BTC Price
At the time of writing, Bitcoin is floating around $76,900, down more than 9% in the last seven days.
The price of the coin has already erased its attempt at recovery | Source: BTCUSDT on TradingView
Featured image from Dall-E, Santiment.net, chart from TradingView.com

Editorial Process for bitcoinist is centered on delivering thoroughly researched, accurate, and unbiased content. We uphold strict sourcing standards, and each page undergoes diligent review by our team of top technology experts and seasoned editors. This process ensures the integrity, relevance, and value of our content for our readers.
Altcoin
Could Tomorrow’s Canada Solana ETF Launch Push SOL Price to $200?

The Solana community and crypto market are watching closely as the world’s first spot Solana ETFs prepare to launch in Canada tomorrow, April 16, 2025. With this key launch, the speculation has also grown about whether this milestone could push SOL’s price toward the $200 mark.
The Ontario Securities Commission (OSC) has approved multiple ETF issuers, including Purpose, Evolve, CI, and 3iQ, to list their products. This could potentially open Solana to a new class of institutional investors.
Comparing Past ETF Launches To Solana ETF
Bloomberg ETF analyst Eric Balchunas offers a measured perspective on expectations for the Solana ETFs. He noted that “Canada is readying spot Solana ETFs to launch this week after regulator gave green light to multiple issuers, including Purpose, Evolve, CI, and 3iQ. ETFs will include staking via TD.”
Canada is readying spot Solana ETFs to launch this week after regulator gave green light to multiple issuers incl Purpose, Evolve, CI and 3iQ. ETFs will include staking via TD pic.twitter.com/FSw149Xkm4
— Eric Balchunas (@EricBalchunas) April 14, 2025
However, Balchunas cautions against expecting too dramatic a market reaction based on previous altcoin ETF launches. He points out that “the 2 Solana ETFs in US (which track futures so not a perfect ginnea pig) haven’t done much. Very little in aum. The 2x XRP already has more aum than both the Solana ETFs and it came out after.”
This is supported by Volatility Shares Solana ETF (SOLZ) statistics, which launched in March as the first financial derivative-based ETF tracking Solana. SOLZ has accumulated only approximately $5 million in net assets as of April 14. This reflects relatively weak investor interest in Solana ETF products to date.
The reception by Canadian investors may vary from U.S. futures-based products. However, experience has shown that investors must have realistic expectations towards short-term pricing effects.
Analyst SOL Price Forecasts Provide Divergent Outlook
Market analysts are offering varying estimates of SOL price prospects following the listing of the ETF. Some are predicting gains, while others are more cautious in their estimates, according to current market trends.
CoinGape has also published a detailed Solana prediction for April 2025. Analyst MANDO CT expressed optimism about the development, tweeting: “Bullish for the SOL community! ‘The world’s first spot Solana ETF is expected to launch on April 16th!’.
Bullish for the $SOL community! 👇
“The world’s first spot Solana ETF is expected to launch on April 16th!” pic.twitter.com/tD5fTKwk3t
— MANDO CT (@XMaximist) April 15, 2025
This positive sentiment was shared as SOL touched its “HIGHEST $SOL/ ETH WEEKLY CLOSE IN HISTORY” on April 14.
Analyst Momin suggests conditional upside. He noted: “Solana usually front-runs the market. If we see $SOL close above $120 on weekly, expecting it to visit $180 in [the] coming weeks!” However, Momin also cautions that “macro is uncertain due to random decisions.”
Solana usually front-runs the market
If we see $SOL close above $120 on weekly, expecting it to visit $180 in coming weeks!
Onchain activity seems back in action, expect some good plays & action for the next few weeks!
But beware, macro is uncertain due to random decisions! pic.twitter.com/9vfel9SgI4
— Momin (@mominsaqib) April 12, 2025
One of the more bullish perspectives comes from analyst BitBull, who draws parallels to Ethereum’s 2021 performance: “SOL 2025 = $ETH 2021. Just like Ethereum’s run in 2021, Solana is setting up for a massive move in 2025.” BitBull identifies an “Accumulation Zone: $120–$130” with a target of $300+, based on pattern congruity in chart behavior between SOL and ETH’s historical performance.
With all these points kept in mind, it is extremely unlikely that the Canada Solana ETF launch can propel the SOL price towards $200 in the short term. Assuming that the overall market is bullish and with continued fund inflows through the ETFs, Solana can witness a price surge in the short term.
Disclaimer: The presented content may include the personal opinion of the author and is subject to market condition. Do your market research before investing in cryptocurrencies. The author or the publication does not hold any responsibility for your personal financial loss.
Altcoin
Whispers Of Insider Selling As Mantra DAO Relocates Nearly $27 Million In OM To Binance


The cryptocurrency project Mantra is coming under increasing suspicion after its OM token shed 90% of its value within a single day. The value dropped from $6.27 to only $0.72, erasing more than $5 billion in market value. What transpired next only served to worsen the situation.
Based on blockchain data, Mantra DAO—the project’s behind-the-scenes organization—sent $26.95 million of OM tokens to a Binance wallet on Monday, April 14. This is just after the price’s massive dump, which triggered red flags among observers.
Detractors cite a disturbing fact: the Mantra team owns around 90% of all OM tokens. The high concentration of ownership and timing of the exchange transfers have fueled accusations of potential insider selling.
With 90% already dumped in $OM, it seems like the $OM team is about to sell more.
2 hours ago, the @MANTRA_Chain DAO staked wallet sent 38M $OM ($26.96M) to #Binance Cold Wallet.https://t.co/nSttgmuqzg pic.twitter.com/Vsc2q346fC
— Onchain Lens (@OnchainLens) April 14, 2025
Mantra CEO Denies Token Dumping Accusations
Mantra chief executive JP Mullin has rebutted such allegations. He said the team and investors didn’t dump their holdings during the crash.
Instead, Mullin attributed the price decline to “forced liquidations” instigated by cryptocurrency exchanges. Such liquidations occur when exchanges sell traders’ holdings automatically after they are unable to cover margin calls.
But his account is not to everyone’s liking. Various independent analysts have monitored suspicious token transfers that point to a different narrative.

OM price has sustained a steep drop in the last week. Source: CoinMarketCap
On-Chain Detective Work Reveals Suspicious Transfers
Crypto analyst Max Brown found that Mantra transferred nearly 4 million OM tokens to cryptocurrency exchange OKX shortly before prices began to decline.
The problem for investigators is that once tokens are moved to centralized exchanges like Binance or OKX, they become much more challenging to trace. This is essentially a blind spot where the tokens can be disposed of while leaving behind no clear trail on public blockchains.
MANTRA CHAIN $OM CRASHED 90% IN AN HOUR AND $5.5 BILLION GOT WIPED OUT.
HERE’S HOW AND WHY IT COULD HAVE POSSIBLY HAPPENED 🧵
IT ALL STARTED YESTERDAY WHEN A POSSIBLE $OM TEAM WALLET DEPOSITED 3.9 MILLION OM TOKENS ON OKX.
IT WAS WELL KNOWN IN THE CRYPTO SPACE THAT OM TEAM… pic.twitter.com/9ZQNw4Yrla
— Max Brown (@MaxBrownBTC) April 13, 2025
While analysts cannot prove it for a fact that insiders sold off tokens, the gradient of movements into exchanges just ahead of the price tumble certainly gives room for serious doubt.
Exchanges Provide Varying Account Of The Crash
Major cryptocurrency exchanges launched investigations as to what triggered the spectacular fall of the OM token.
Binance, the largest crypto exchange in terms of trading volume, corroborates Mullin’s account. In early findings, they indicate cross-exchange liquidations most likely caused the crash, which would support the CEO’s explanation.
OKX paints a different picture. The exchange cited “major changes” in OM’s tokenomics as a possible cause. They also noted that multiple blockchain addresses had sent large quantities of tokens to exchanges during the time of the crash.
The contradicting accounts by various players in the market have left investors uncertain about what actually transpired. With $5 billion of market value lost and no certainty, confidence in the project has been severely undermined.
Featured image from Blueberry Markets, chart from TradingView

Editorial Process for bitcoinist is centered on delivering thoroughly researched, accurate, and unbiased content. We uphold strict sourcing standards, and each page undergoes diligent review by our team of top technology experts and seasoned editors. This process ensures the integrity, relevance, and value of our content for our readers.
Altcoin
Has XRP Price Already Bottomed? Analyst On How Ripple Coin Can Hit $15
XRP price has recorded marginal gains today and held its $2.15 support as the broader crypto market stayed in the green. Amid this, a top analyst revealed that Ripple’s coin may have already hit its bottom. However, he also highlighted some key conditions that the crypto must attain to confirm the bottom.
Meanwhile, another expert has also shared key insights and mathematical calculations, which showed how Ripple’s native crypto might hit the $15 ahead.
XRP Price Holds $2.15 Support: Has It Already Bottomed Out?
XRP price has added around 0.23% during writing and exchanged hands at $2.15, while its one-day volume fell 25% to $2.99 billion. Notably, the crypto’s current market cap stood at $125.33 billion and the token has touched a 24-hour high of $2.18.
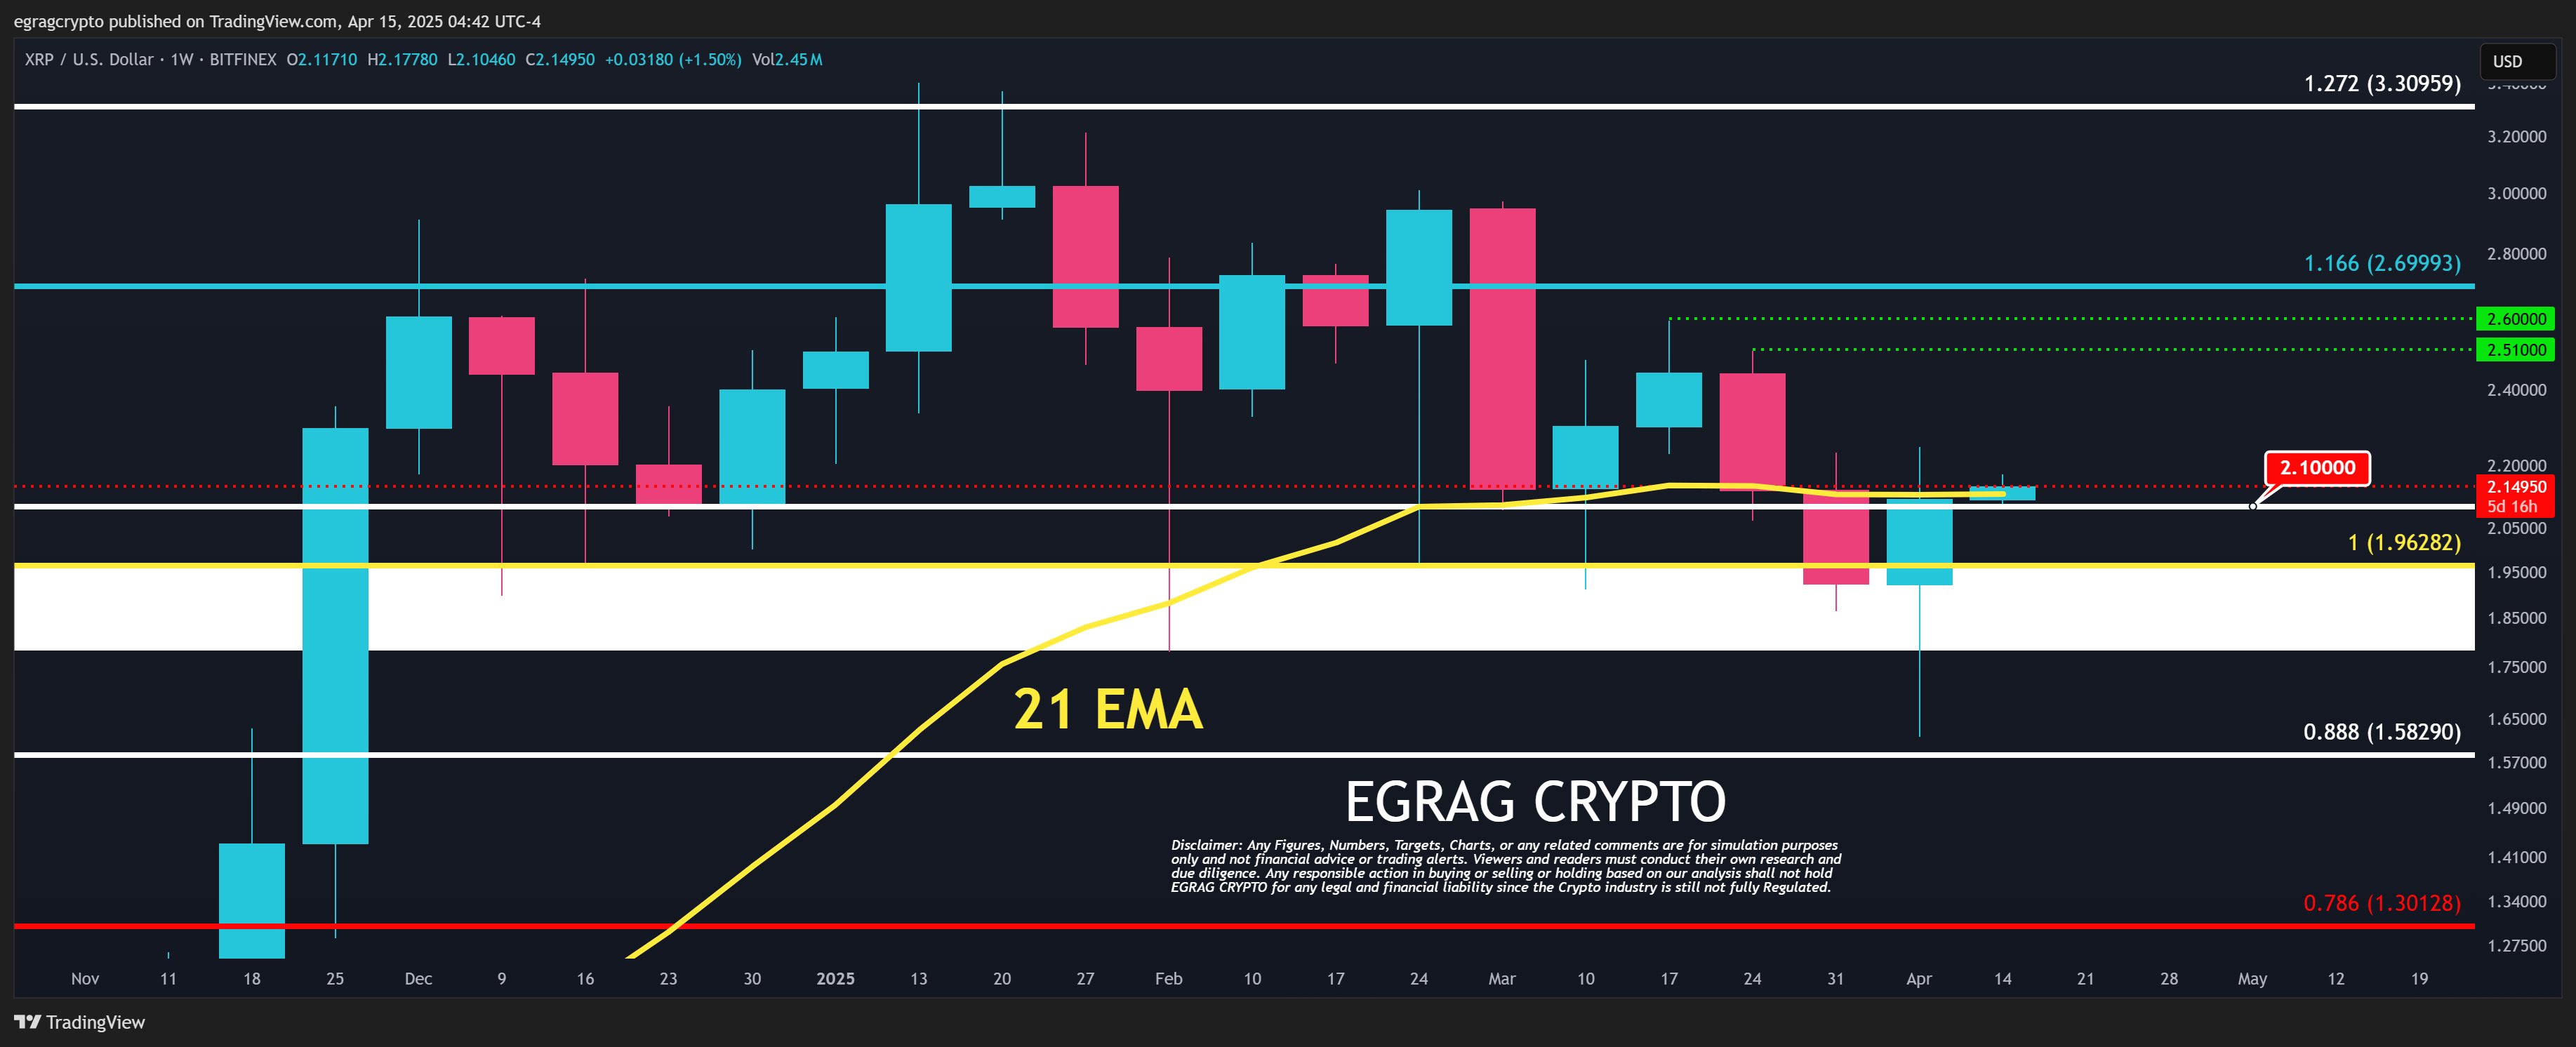
Besides, CoinGlass data showed that XRP Futures Open Interest also rose 0.5%, reflecting renewed market confidence. Amid this, renowned analyst EGRAG CRYPTO suggests that XRP might have already hit its bottom on April 7. However, the analyst outlines some key conditions to confirm this trend reversal.
XRP Really Bottomed?
According to the pundit, Ripple’s coin must close a weekly full-body candle above $2.10, the 21-week EMA, and notably above $2.25. If these conditions are met, it would strongly confirm the bottoming out of XRP price. However, failure to achieve these conditions may lead to other market narratives emerging, the expert noted.
Meanwhile, despite the soaring discussions, another expert recently hinted that the crypto might hit $15, citing XRP ETF inflow as the key factor.
Ripple’s Coin To Hit $15? ETF Inflow Calculation Shows
In a recent analysis, market expert Zach Rector made a bold prediction that XRP price could reach $15 and beyond, driven by anticipated inflows from Exchange-Traded Funds (ETFs). According to Rector, JPMorgan’s estimate of $4 to $8 billion inflows into XRP ETFs in the first year could trigger a significant price surge.
A Closer Look Into The Calculation
Using his market cap multiplier model, Rector calculated that a conservative $4 billion inflow could lead to a 200x multiplier, resulting in an $800 billion increase in XRP’s market cap. Adding this to the current market cap of $125 billion would take the total market cap to $925 billion. With a circulating supply of 60 billion XRP tokens, this would translate to a price of $15.42 per token.
Rector’s analysis is based on the market cap multiplier theory, which measures how inflows can amplify an asset’s valuation. He cited a recent example where XRP’s market cap grew by $7.74 billion in just eight hours, fueled by a mere $12.87 million in inflows, resulting in a 601x multiplier.
While Rector’s prediction seems ambitious, industry leaders are growing more confident about the prospect of an XRP ETF. Ripple CEO has predicted that at least one XRP ETF could launch in the second half of 2025. If Rector’s analysis is correct, the anticipated ETF inflows could trigger a significant rally for XRP price, making $15 a realistic target.
Meanwhile, this also comes as Ripple’s coin continues to witness an influx, outshining BTC, ETH, SOL, and others. A recent report showed that XRP defied the broader market trend last week when the broader digital assets space noted an outflux of over $790 million.
Additionally, a recent Ripple price analysis also showed that the XRP ETF launch, among other factors, could trigger a short-term surge to $5.5 for the crypto. However, investors should exercise caution and conduct their own research before making any investment decisions.
But, this prediction seems to have sparked interest in the crypto community, with many eagerly awaiting the potential launch of XRP ETFs in 2025.
Disclaimer: The presented content may include the personal opinion of the author and is subject to market condition. Do your market research before investing in cryptocurrencies. The author or the publication does not hold any responsibility for your personal financial loss.
-

 Ethereum24 hours ago
Ethereum Price Threatened With Sharp Drop To $1,400, Here’s Why
-

 Market22 hours ago
Binance Futures Causes a Brief Crash For Story (IP) and ACT
-
 Market23 hours ago
XRP Jumps 22% in 7 Days as Bullish Momentum Builds
-

 Market20 hours ago
Is The XRP Price Mirroring Bitcoin’s Macro Action? Analyst Maps Out How It Could Get To $71
-

 Market21 hours ago
Ondo Finance (ONDO) Rises 3.5% Following MANTRA Crash
-

 Market17 hours ago
Bitcoin Price Eyes Bullish Continuation—Is $90K Within Reach?
-

 Market10 hours ago
Can Pi Network Avoid a Similar Fate?
-

 Altcoin17 hours ago
Expert Urges Pi Network To Learn From The OM Crash Ahead Of Open Mainnet Transition



✓ Share: