
Altcoin
Mantle (MNT) Price Hit Hard After TVL Drops from All-Time High

Mantle (MNT), an Ethereum layer-2 (L2) project, has recently gained widespread attention.
MNT, its native cryptocurrency, has also outperformed tokens from other blockchains in the same category. However, this analysis focuses on a recent change.
Fall in Mantle TVL Drives Ripple Effects on the Network
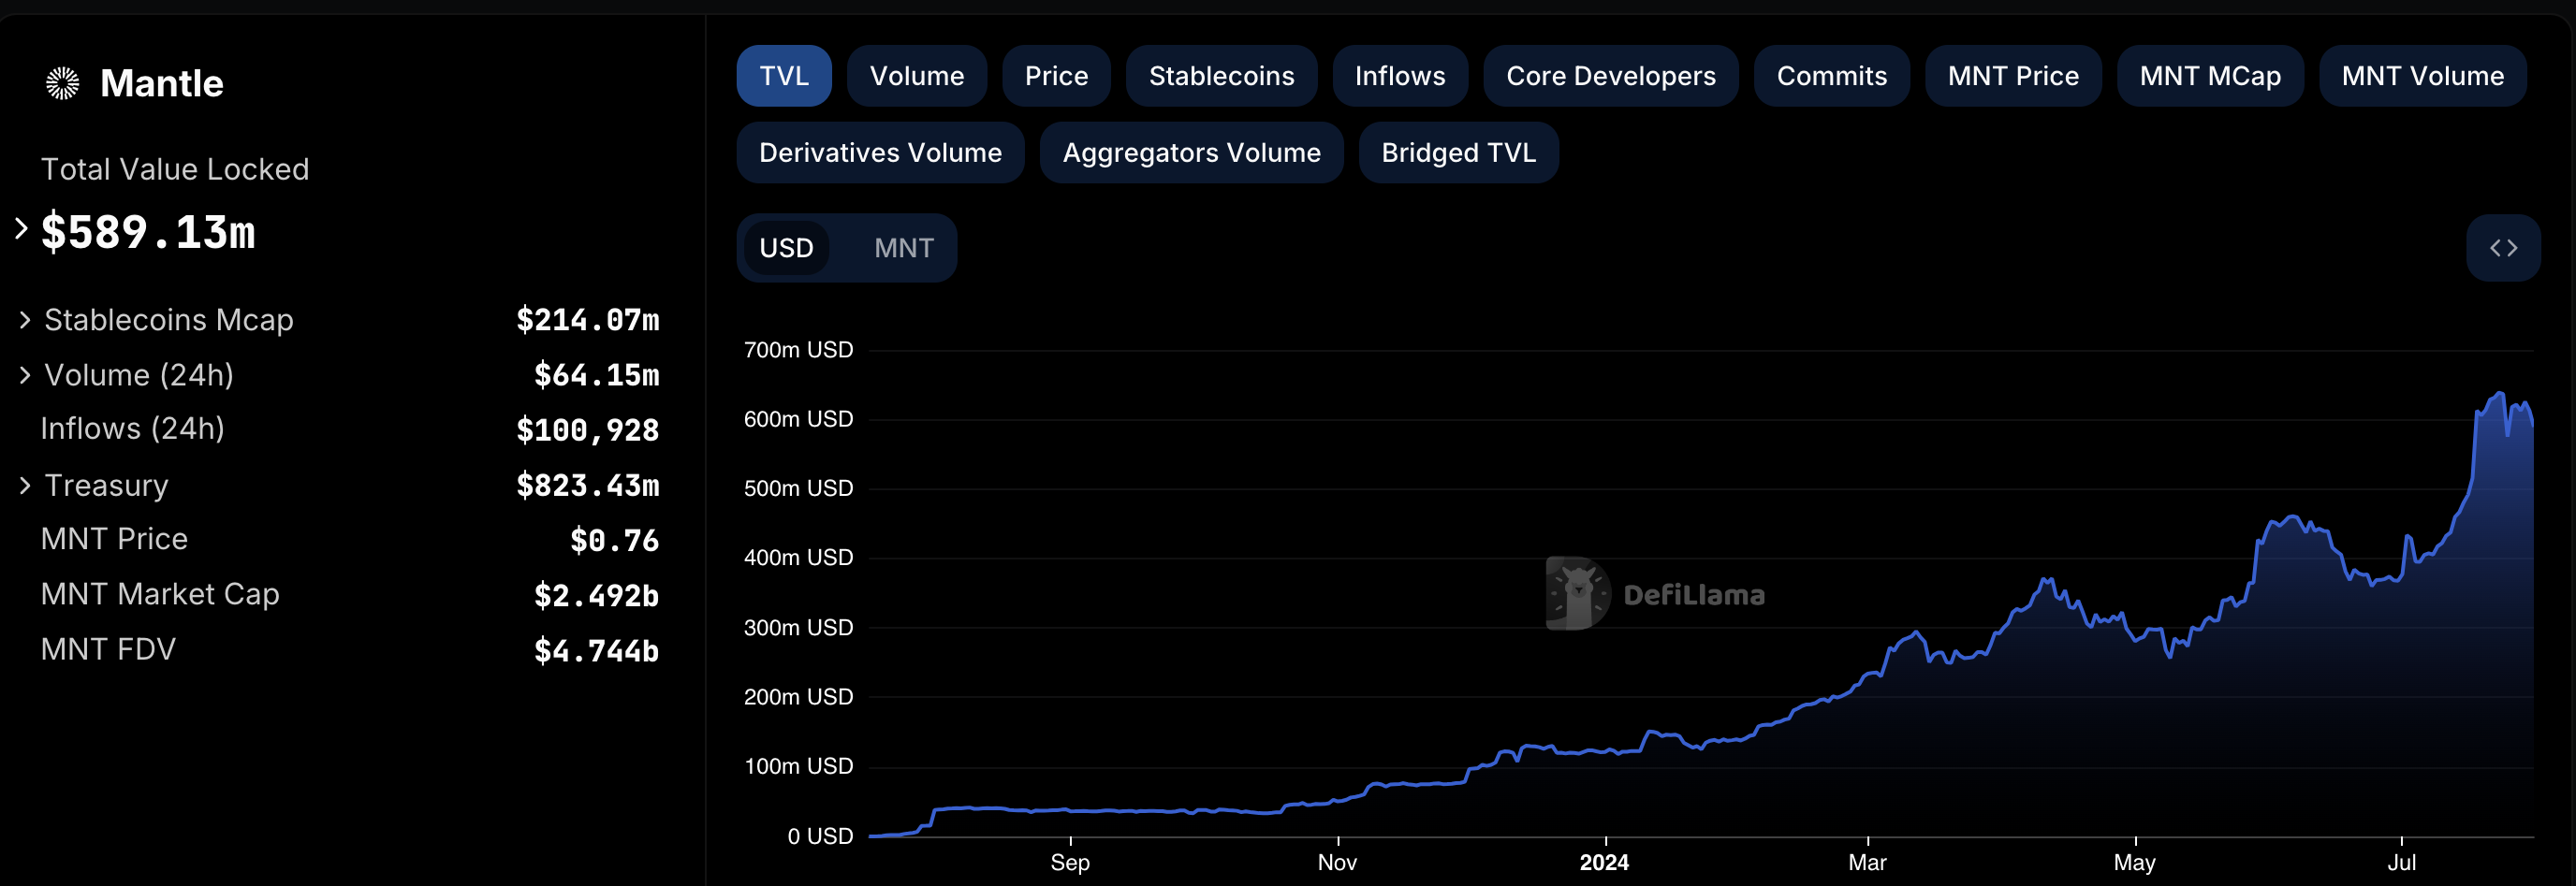
According to DeFiLlama, Mantle’s Total Value Locked (TVL) reached an all-time high of $636.50 million on July 24. TVL, as it is commonly called, measures the value of assets locked or staked in a protocol.
The higher the TVL, the more trustworthy a network is perceived to yield gains. However, if the TVL decreases, it implies that market participants are withdrawing previously-locked tokens.
Seven days after reaching the peak, Mantle’s TVL has decreased to 589.13 million. The decrease highlights the growing prevalence of lower benefits and proceeds on the lending, staking, and cross-chain protocols developed under Mantle.
Read more: What Is Mantle Network? A Guide to Ethereum’s Layer 2 Solution
The decrease also seems to have affected MNT’s price. Some days ago, the cryptocurrency’s price climbed by double digits. But afterward, profit-taking tanked the upswing. Since then, MNT has struggled to rebound, as it trades at $0.75 at press time.
Additionally, data from IntoTheBlock indicates that Mantle network activity has faced challenges in recovering. To gain a clearer understanding of the network’s activity, BeInCrypto examines the condition of active and new addresses.
In simple terms, active addresses estimate the number of users on a blockchain. If the number increases, it implies that there is a lot of interaction with the native token, and this could be bullish for the price. A decline in the metric implies otherwise.
New addresses, on the other hand, track the number of first-time transactions on the blockchain. As a measure of traction, an uptick in the number suggests increased adoption, while a downturn implies decreased demand.
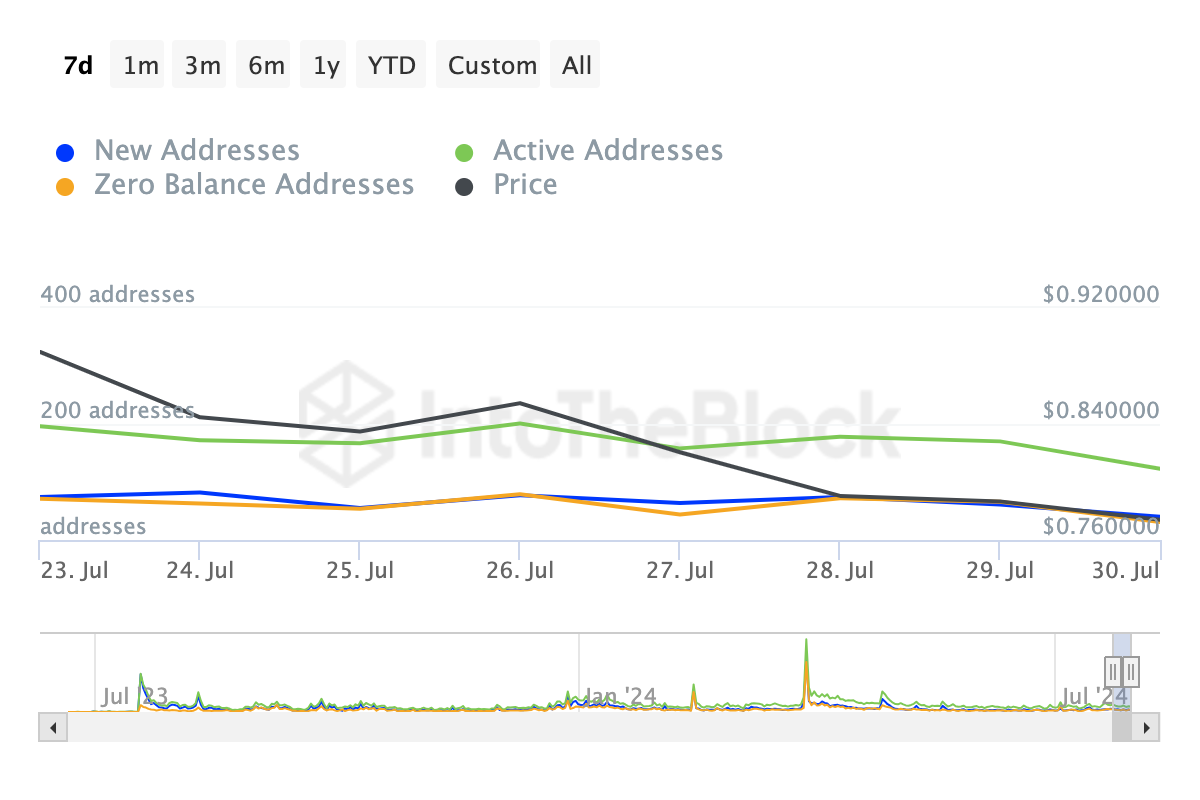
As shown above, active, new, and zero-balance addresses on Mantle have all declined in the last seven days, reflecting a drop in interaction with the MNT token. Should this continue, MNT’s price may find it challenging to rebound from its recent lows.
MNT Price Prediction: Downward Pressure Lingers
Based on the daily chart, the Moving Average Convergence Divergence (MACD) has dropped into negative territory. The MACD is a technical indicator that uses correspondence between two Exponential Moving Averages (EMAs) to determine momentum and price trends.
From the chart below, the 26-day EMA (orange) is above the 12-day (EMA), suggesting sellers’ dominance and a bearish momentum. If the shorter EMA is above the longer one, then the trend would have been bullish.
If the trend continues, MNT may not escape another drop and the Fibonacci retracement series gives an idea of the levels the token may reach. Should selling pressure increase, MNT’s price may decrease to $0.70 — where the 23.6% Fib level lies.
Read more: Layer-2 Crypto Projects for 2024: The Top Picks
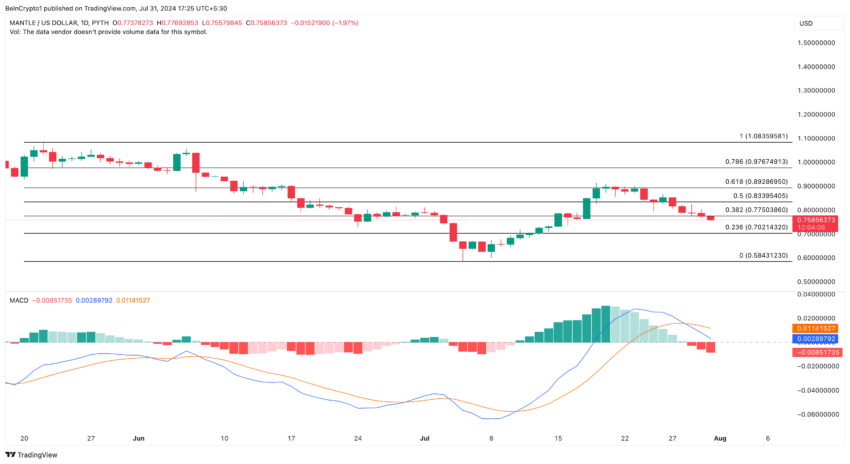
However, a surge in buying pressure, combined with increased network activity, may invalidate the thesis. If this happens, MNT may bounce to $0.83 or as high as $0.89.
Disclaimer
In line with the Trust Project guidelines, this price analysis article is for informational purposes only and should not be considered financial or investment advice. BeInCrypto is committed to accurate, unbiased reporting, but market conditions are subject to change without notice. Always conduct your own research and consult with a professional before making any financial decisions. Please note that our Terms and Conditions, Privacy Policy, and Disclaimers have been updated.


Crypto analyst Egrag Crypto has predicted that the XRP price could rally to as high as $45 if it mirrors a bullish price movement from the 2017 bull run. The analyst also raised the possibility of the altcoin at least touching $19 if it replicates the 2021 price action.
XRP Price Could Rally To $45 If It Mirrors 2017 Bull Run
In an X post, Egrag Crypto predicted that the XRP price could rally to $45 if it mimics the 2017 cycle. He noted that in 2017, the price found heavy support at the 21 Exponential Moving Average (EMA) and experienced a last blow-off top.
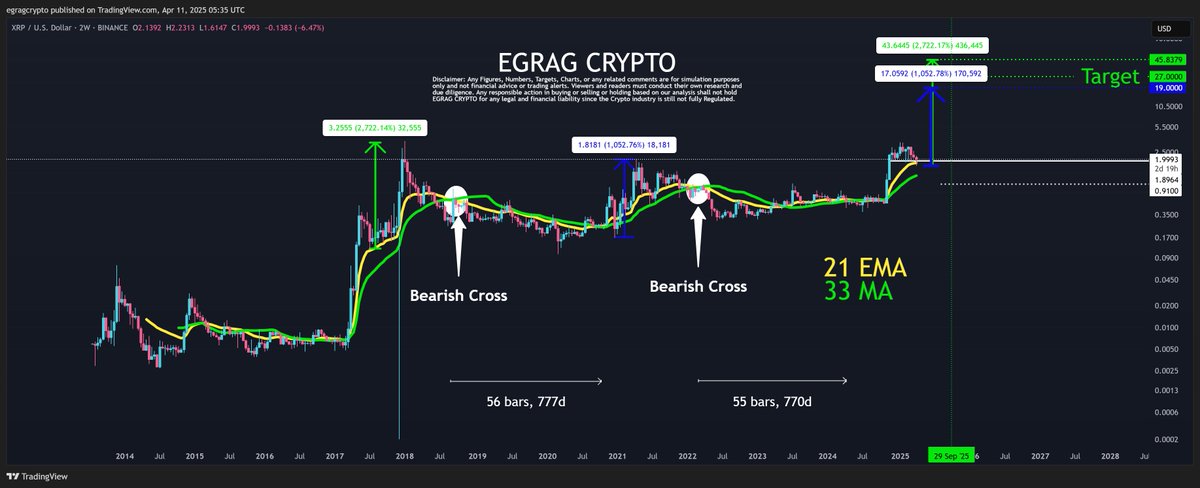
This blow-off top led to a price surge of 2,700%, which the analyst believes could lead to XRP’s rally to $45 if the 2017 bull run repeats itself. Meanwhile, Egrag Crypto predicts the altcoin could at least touch $19 if a similar price movement like the 2021 bull run occurs.
He noted that in 2021, the price breached the 21 and 33 EMA and then pumped in a final leg that marked the cycle’s blow-off top. During this period, XRP surged by 1,050%, which the crypto analyst believes could lead to a rally to $19 if history repeats itself. The analyst added that his target has always been $27 and advised market participants to DCA if necessary.
In the short term, the XRP price looks to be eyeing a rally to $5. A CoinGape market analysis revealed that the Hidden Road acquisition may lead to $10 billion in volume to the XRP Ledger, which could push the altcoin to this target.
Meanwhile, XRP’s on-chain metrics also paint a bullish outlook for the altcoin, with the number of wallet addresses hitting a new all-time high (ATH) recently. This indicates that Ripple’s native crypto is enjoying wider adoption.
Ripple’s Native Crypto Has The Potential To Hit $1,000
Crypto analyst BarriC asserted that the XRP price could hit $1,000, although he admitted that it would “absolutely” take time. He claimed it will take a utility run and mass adoption to drive XRP to this price target.
The analyst added that it would also take a big shift in the financial space for the altcoin to reach this $1,000 level. Essentially, BarriC believes something massive has to happen for XRP to reach this target. However, once they do, he assured that there is no going back.
A CoinGape market analysis also once suggested that the XRP price could reach $1,000 if Michael Saylor swapped his $21 billion BTC for Ripple’s native crypto.
Boluwatife Adeyemi
Boluwatife Adeyemi is a well-experienced crypto news writer and editor who has covered topics that cut across several topics and niches. Boluwatife has a knack for simplifying the most technical concepts and making it easy for crypto newbies to understand. Away from writing, He is an avid basketball lover, a traveler and a part-time degen.
Disclaimer: The presented content may include the personal opinion of the author and is subject to market condition. Do your market research before investing in cryptocurrencies. The author or the publication does not hold any responsibility for your personal financial loss.
The price of Solana (SOL) is again in the spotlight as the current bullish consolidation has flipped the coin to a new weekly high. The Solana community also anticipates the Exchange Traded Fund (ETF) tied to the asset, prompting the debate on the potential timeline for the offering’s approval. With the price of Bitcoin and altcoin showcasing a rebound, Solana’s performance has stood out from other altcoins.
Is The Solana Price Breakout to $200 Possible?
According to new insight on X from market analyst World of Charts, the price of Solana is currently testing a potential breakout trend. He said the coin is testing crucial resistances that can easily push it to the $200 level if it successfully breaks out.
The World of Charts thesis tips the SOL price to soar by over 86%, with the potential to add $105 in a bull case scenario. However, this does not negate a possible SOL price retest of $75 if crucial support levels fail to hold.
At the time of writing, the price of Solana was changing hands for $120, up by 8.06% in 24 hours.

Despite the Relative Strength Index (RSI) soaring from the low of 34 recorded on April 8 to the current 46.89, SOL is not completely out of the woods. The MA Cross indicator shows that the Death Cross inked on April 2 has yet to be invalidated.
Solana ETF: Potential Approval Timeline
With Solana showcasing a potential rebound trend, many community members are quizzing to determine what will happen to its growing ETF products. Responding to SOL ETF approval queries, Senior Bloomberg ETF Analyst James Seyffart broke the silence on what to expect.
He reiterated that the first ‘final’ deadline for SOL ETFs is October 10. He noted that there is a non-zero chance the new Atkins-led US SEC and Hester Peirce-led Crypto Task Force will move earlier than that.
Despite this definitive timeline, he reiterated that there is a strong expectation of approval by that deadline. In the meantime, the Crypto Task Force is pushing for clear regulations, which is positive for a potential approval.
A Solana ETF could usher in institutional money into the ecosystem, which is bullish for the SOL price, leading to a massive breakout.
More SOL Fundamentals to Watch
According to a recent ecosystem shift, the Proof-of-Stake (PoS) protocol is undergoing a subtle rebranding in the market. Besides introducing Confidential Balances to drive privacy, Solana Developers have also unveiled Open Source Relayers. In partnership with OpenZeppelin, these Relayers are in alpha mode and can power some functionalities within the ecosystem.
A defined attempt to revive the memecoin outlook in the SOL ecosystem through PumpFun also exists. With the return of the livestream, PumpFi, and PumpSwap, the protocol is gearing up for a new wave of meme explosion and price rebound.
Godfrey Benjamin
Benjamin Godfrey is a blockchain enthusiast and journalists who relish writing about the real life applications of blockchain technology and innovations to drive general acceptance and worldwide integration of the emerging technology. His desires to educate people about cryptocurrencies inspires his contributions to renowned blockchain based media and sites. Benjamin Godfrey is a lover of sports and agriculture.
Disclaimer: The presented content may include the personal opinion of the author and is subject to market condition. Do your market research before investing in cryptocurrencies. The author or the publication does not hold any responsibility for your personal financial loss.

The crypto market in 2025 is facing intense turbulence. The capitalization of once-hot trends like meme coins has plummeted. Capital has flowed out of decentralized finance (DeFi) protocols, driving DeFi’s total value locked (TVL) down from $120 billion to around $87 billion.
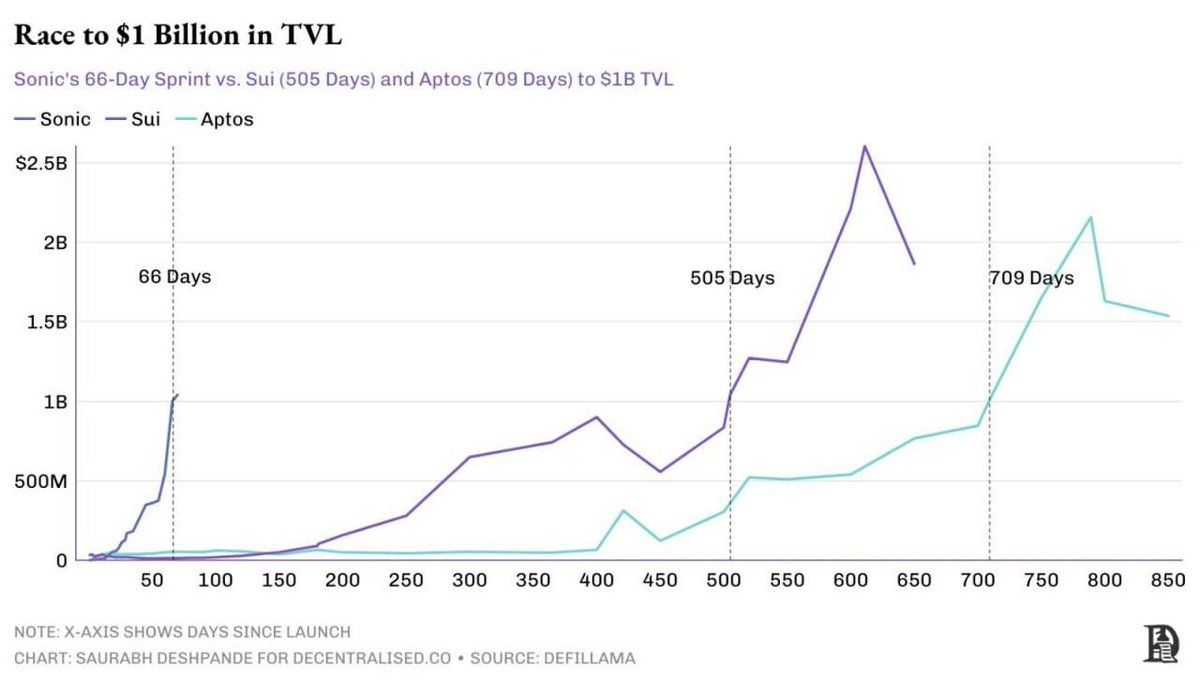
In this context, Sonic stands out. It has consistently hit new TVL highs, reaching $1 billion in April after growing nearly 40 times since the beginning of the year. So, what makes Sonic a bright spot amid a stormy market?
Investors Are Pouring Capital into Sonic
Sonic has made its mark with a rapid TVL growth rate, far outpacing better-known blockchains. According to DefiLlama, Sonic reached $1 billion in TVL within 66 days. In comparison, Sui took 505 days, and Aptos needed 709.
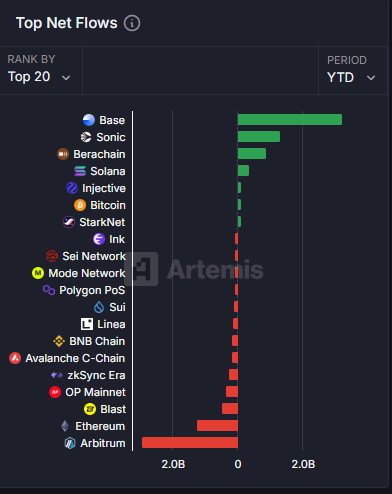
This achievement reflects strong capital inflows into the Sonic ecosystem despite the broader DeFi trend of capital withdrawal. Data from Artemis supports this, ranking Sonic as the second-highest netflow protocol this year—trailing only Base, a blockchain backed by Coinbase.
The growth goes beyond TVL numbers. Sonic’s ecosystem is attracting various projects, including derivatives exchanges like Aark Digital and Shadow Exchange and protocols such as Snake Finance, Equalizer0x, and Beets. These projects still have small TVLs, but they have the potential to draw new users and capital, fueling Sonic’s momentum.
However, the question remains: Can this capital inflow remain sustainable while the market fluctuates?
Andre Cronje on Sonic’s Potential and Strengths
Andre Cronje, the developer behind Sonic, shared his ambition in an interview to push this blockchain beyond its competitors.
“Sonic has sub-200 millisecond finality, faster than human responsiveness,” Andre Cronje said.
According to Cronje, Sonic isn’t just about speed. The platform also focuses on improving both user and developer experience. He explained that 90% of transaction fees go to dApp, not to validators, creating incentives for developers to build.
Unlike other blockchains, such as Ethereum, which are limited by long block times, Sonic leverages an enhanced virtual machine that theoretically processes up to 400,000 transactions per second. Cronje acknowledges, however, that current demand has yet to push the network to its full capacity. Still, these technical advantages make Sonic a compelling option for developers seeking more user-friendly dApps.
He also revealed new features on Sonic that have the potential to attract users.
“If your first touch point with a user is to download this wallet and then buy this token on an exchange, you’ve lost 99.9% of your users. They’ll use their Google off-email password, fingerprint, face, whatever it is, to access the dApp and interact with it, and they’ll never need to know about Sonic or token,” Andre Cronje revealed.
Risks and Challenges Ahead
Despite reaching impressive milestones, Sonic is not immune to risk. The price of its token, S, has declined significantly from its peak. According to BeInCrypto, it has dropped around 20% in the past month—from $0.60 down to $0.47—mirroring the broader market’s volatility.

Furthermore, Grayscale recently removed Sonic from its April asset consideration list. This decision reflects a shift in the fund’s expectations and raises concerns about Sonic’s ability to maintain its TVL should investor sentiment deteriorate.
Sonic also faces fierce competition from other high-performance chains like Solana and Base. Although Sonic holds a clear advantage in speed, long-term user adoption will depend on whether its ecosystem can deliver real value, not just high TVL figures.
Disclaimer
In adherence to the Trust Project guidelines, BeInCrypto is committed to unbiased, transparent reporting. This news article aims to provide accurate, timely information. However, readers are advised to verify facts independently and consult with a professional before making any decisions based on this content. Please note that our Terms and Conditions, Privacy Policy, and Disclaimers have been updated.
Will the SEC Approve Ethereum ETF Staking?
US SEC and Binance Agree To Pause Legal Proceedings for 60 More Days

Binance and the SEC File for Pause in Lawsuit

Crypto Whales Are Buying These Altcoins Post Tariffs Pause

XRP Price Flashes Symmetrical Triangle From 2017, A Repeat Could Send It as Flying To $30
Analyst Reveals XRP Price Can Hit $45 If It Follows This 2017 Pattern

2.52 Million Altcoins Are Ruining Crypto’s Future

Animoca Brands Valuation Tanks 75% In Two Years, Here’s Why

Crypto exchange BingX hacked for $43 million

Are The Big Players Losing Interest?

Hong Kong’s Securities Association Tips Authorities On Crypto Self-Regulation

Coinbase cbBTC Set to go Live on Solana
2.52 Million Altcoins Are Ruining Crypto’s Future
Animoca Brands Valuation Tanks 75% In Two Years, Here’s Why
Crypto exchange BingX hacked for $43 million
Are The Big Players Losing Interest?
Hong Kong’s Securities Association Tips Authorities On Crypto Self-Regulation
Coinbase cbBTC Set to go Live on Solana
-

 Market20 hours ago
President Trump Signs First-Ever Crypto Bill into Law
-

 Market19 hours ago
XRP Price Ready to Run? Bulls Eyes Fresh Gains Amid Bullish Setup
-
 Altcoin21 hours ago
XRP Price Risks 40% Drop to $1.20 If It Doesn’t Regain This Level
-
 Altcoin19 hours ago
BNB Chain Completes Lorentz Testnet Hardforks; Here’s The Timeline For Mainnet
-

 Market21 hours ago
Ethereum Price Cools Off—Can Bulls Stay in Control or Is Momentum Fading?
-

 Market14 hours ago
HBAR Buyers Fuel Surge with Golden Cross, Suggesting Upside
-
 Bitcoin18 hours ago
Over $2.5 Billion in Bitcoin and Ethereum Options Expire Today
-

 Market13 hours ago
China Raises Tariffs on US to 125%, Crypto Markets Steady
✓ Share: