
Altcoin
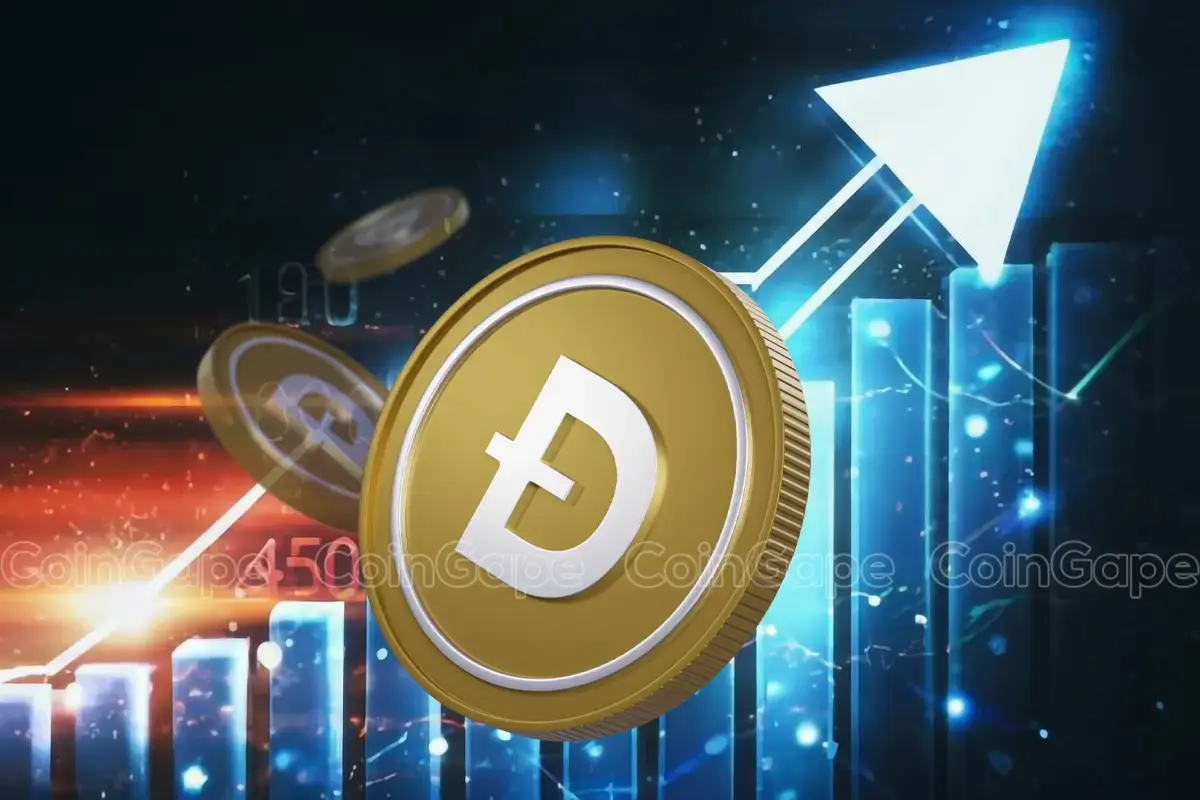
Dogecoin Open Interest Dumps To November 2024 Levels, Will Price Follow?


Dogecoin’s open interest has been on a massive freefall for a while now as the memecoin continues to struggle to gain investor interest. As it stands, data shows that Dogecoin’s open interest has sharply declined since the beginning of March, plunging to levels not seen since November 2024. The rapid drawdown, tracked using data from CoinGlass, reflects a significant reduction in leveraged positions and trader appetite for the king of memecoins.
Three-Month Slide: Dogecoin Open Interest Drops Sharply
Open interest is crucial in measuring the interest in an asset, which in turn helps predict price movements. In the case of Dogecoin, its open interest reflects a trend of low interest. After peaking on January 18, Dogecoin’s open interest has been on a relentless freefall, with price action mirroring this downward trend. Since mid-January, Dogecoin’s open interest has been steadily evaporating, dropping from multi-month highs to a level now comparable to just before last year’s Q4 price rally.
According to CoinGlass data, the reduction has not been abrupt but instead drawn out over the course of the past two months, highlighted by a sustained exit by traders and a cooling of bullish sentiment in the derivatives market. This is sentiment relayed from a continued fall in the Dogecoin price alongside the rest of the crypto market. At the time of writing, the Dogecoin open interest is sitting at $1.6 billion, 70.5% below its January 18 high peak of $5.42 billion.

Potential Implications For DOGE’s Future Price Movement
The persistent decline in Dogecoin’s open interest carries a number of implications for its future price direction, particularly in the context of momentum and liquidity in the derivatives market.
Open interest is often used to assess the strength of a trend (whether upward or downward) and sharp reductions typically suggest that traders are pulling out of positions due to stop-loss triggers, liquidations, or they no longer see near-term upside in the asset.
In theory, a decrease in Dogecoin’s open interest points to a corresponding reduction in liquidity, which can also damage any price uptrend. An increase in open interest, on the other hand, is definitive of an increase in liquidity.
Now that the open interest has returned to its November 2024 levels, it means liquidity and sentiment surrounding the meme coin have lost about two months of work, and how quickly derivatives traders can return to bullish momentum will also be factored into any potential uptrend from here.
At the time of writing, Dogecoin is trading at $0.1684, up by 0.52% in the past 24 hours. However, the broader trend remains negative, with the meme coin down by 34% over the past 30 days. This extended drawdown has also had consequences for Dogecoin’s standing in the wider market, and it has now been overtaken by Cardano in terms of market capitalization.
Featured image from DALL-E, chart from TradingView
Editorial Process for bitcoinist is centered on delivering thoroughly researched, accurate, and unbiased content. We uphold strict sourcing standards, and each page undergoes diligent review by our team of top technology experts and seasoned editors. This process ensures the integrity, relevance, and value of our content for our readers.


As the SEC vs Ripple lawsuit is coming to an end with the blockchain firm paying a $50 million penalty, developments on an XRP ETF are gathering pace once again. In his latest Bloomberg interview, CEO Brad Gralinghouse said that it’s important to have this exchange-traded fund, while just falling short of accepting that they are working with the world’s largest asset manager, BlackRock. XRP price movement has been relatively mute to this development, while industry players expect a $3 breakout soon.
Are Ripple and BlackRock Exploring Potential XRP ETF?
In his recent Bloomberg interview, Ripple CEO Brad Garlinghouse was asked whether they are collaborating with BlackRock to launch an XRP ETF in the US. Although Garlinghouse didn’t explicitly accept such a collaboration, he sparked speculation by stating, “We think it makes sense for the XRP community overall”.
The prospect of a BlackRock filing for an XRP ETF in 2025 has captured the attention of the crypto community. Many believe that once the regulatory wall over Ripple is removed, asset managers will rush in the second-half of the year to bring a Ripple ETF to the market. Furthermore, Ripple CEO Garlinghouse is also confident that XRP would make it to the US Digital Asset stockpile.
Adding to the discussion, Crypto.com CEO Kris Marszalek highlighted the transformative potential of XRP ETFs. He predicts that the development could attract $8 billion in inflows following the approval.
Ripple Drops Cross-Appeal Against US SEC
The long-running Ripple vs SEC lawsuit has finally come to an end as the blockchain startup has decided to no longer pursue the cross-appeal against the securities regulator. The resolution involves a $75 million refund to Ripple, following the SEC’s decision to drop its appeal and Ripple abandoning its cross-appeal.
This settlement concludes a case that initially resulted in a $125 million penalty against Ripple. With the refund, the company’s net payment to the SEC amounts to $50 million. Under the Trump administration, the SEC has softened its stance, while putting a greater focus on establishing clear crypto regulations.
XRP Price Surge to $3 Soon?
Amid the current development and hopes for XRP ETF, the XRP price has given a muted response as it continues to face strong rejection at $2.50 levels. Despite this, market analysts have made bold predictions, expecting the XRP price rally to continue at $15 and beyond.
Sharing the XRPUSDT chart, popular crypto trader Seyma stated that she’s more bullish on the Ripple cryptocurrency in comparison to other altcoins. “My weekly target is $3-$3.24 i never give investment or trading advice just noted to myself,” she wrote.

Bhushan Akolkar
Bhushan is a FinTech enthusiast with a keen understanding of financial markets. His interest in economics and finance has led him to focus on emerging Blockchain technology and cryptocurrency markets. He is committed to continuous learning and stays motivated by sharing the knowledge he acquires. In his free time, Bhushan enjoys reading thriller fiction novels and occasionally explores his culinary skills.
Disclaimer: The presented content may include the personal opinion of the author and is subject to market condition. Do your market research before investing in cryptocurrencies. The author or the publication does not hold any responsibility for your personal financial loss.
Dogecoin price is attracting renewed attention from technical analysts, with several chart formations pointing to a meme coin rally. According to multiple analysts, DOGE price is displaying a combination of technical indicators and structures that suggest the potential for a 10X rally. These include a breakout from a triangle pattern, a developing “cup and handle” formation, and historical pattern similarities to the 2017 bull market.
Dogecoin Price Prediction: Chart Patterns Point to 10X Meme Coin Rally
In a recent post on X, analyst Trader Tardigrade shared a chart showing the MACD indicator breaking out from a triangle formation. This setup has historically been linked with strong upward momentum in Dogecoin price. The MACD breakout is accompanied by a rounded bottom pattern, often seen as a preparatory phase before bullish moves.
Notably, during previous instances in September and March, similar MACD triangle breakouts occurred. In both cases, the breakout led to a rapid acceleration in Dogecoin price. These historical movements suggest that the current meme coin rally may lead to a new all-time high.

The MACD lines have crossed again in recent sessions, with the indicator moving above the triangle’s downtrend line. Analysts are observing similar conditions that were present during previous rallies. The upward curl in the price structure reinforces the breakout narrative.
Meanwhile, following the recent move by House of Doge, market analysts are forecasting a 16% rise in Dogecoin price as bullish momentum builds.
Cup and Handle Pattern Suggests Upside Toward $2.00
Additionally, according to Crypto Elites, DOGE price is forming a cup and handle pattern, a technical formation often associated with bullish continuation. The rounded bottom of the cup has already developed, and the handle phase is underway. This formation typically leads to a breakout once the price surpasses the neckline resistance.
The key resistance level is positioned near $0.185. A confirmed break above this threshold could open the door to a sharp upward movement. Based on this chart pattern, the projected target is in the $1.85 to $2.00 range. The projection is calculated using the depth of the cup formation.

However, the analyst noted that the current retracement to the handle’s lower range may act as a support zone. This area has historically been where momentum builds ahead of breakouts.
Historical Behavior Resembling 2017 Cycle
Concurrently, analyst KrissPax has identified similarities between the current Dogecoin price movement and the 2017 bull run. KrissPax posted a chart on X that compares both periods, showing the current phase aligning closely with the structure before DOGE price previous surge. According to the chart, the current meme coin cycle could extend beyond the previous all-time high.
KrissPax projected that the top meme coin could rise to $4 if the second major breakout occurs, similar to the 2017 pattern. While this is a longer-term scenario, it is based on recurring patterns observed in past market cycles.
A recent CoinGape report supports the bullish outlook on DOGE price, noting that a breakout above the $0.18 resistance could ignite a meme coin rally toward the $20 mark.
Ronny Mugendi
Ronny Mugendi is a seasoned crypto journalist with four years of professional experience, having contributed significantly to various media outlets on cryptocurrency trends and technologies. With over 4000 published articles across various media outlets, he aims to inform, educate and introduce more people to the Blockchain and DeFi world. Outside of his journalism career, Ronny enjoys the thrill of bike riding, exploring new trails and landscapes.
Disclaimer: The presented content may include the personal opinion of the author and is subject to market condition. Do your market research before investing in cryptocurrencies. The author or the publication does not hold any responsibility for your personal financial loss.

Ethereum price is attracting renewed market attention as analysts present technical scenarios pointing toward a potential move above the $2100 mark. Recent analyses from experts suggest that Ethereum price behavior is showing both bullish short-term structure and macro-level cyclical patterns, which could support an upward continuation if key levels hold.
Ethereum Price Could Surge Past $2100 on Liquidity Grab
Analyst Crypto Patel shared insight on the X platform, identifying a bullish price setup on the ETH/USDT chart. According to Patel, the top altcoin has shown a strong displacement move to the upside, which has led to a shift in market structure. This move followed a reaction from a previously identified bullish Point of Interest (POI).
Ethereum price is reacting positively from a key mitigation block near $2064.60, indicating strong institutional demand. The mitigation block represents a zone where the top altcoin price retraced after a breakout, often used by institutional traders to mitigate prior orders before continuing the trend. This setup places the entry for a long position within the upper mitigation zone, aligning with smart money principles.

The price target of $2128.12 aligns with a swing high liquidity zone, suggesting a likely smart money-driven move upward. These zones often hold clustered stop-loss orders and pending buy positions. A move into this area could allow investors to capture liquidity before a reversal. Patel sets a stop-loss at $2027.20, just below the mitigation block, providing a defined risk level if the altcoin price structure fails.
Current ETH Cycle Compared to 2018–2020 Pattern
Another analyst, TimeFreedomROB, posted a chart on X comparing Ethereum price weekly structure to its 2018–2020 cycle. The analysis shows ETH breaking below an ascending triangle, mirroring its past breakdown below a descending triangle before its major 2020 recovery. In that prior cycle, ETH price formed a macro bottom and rallied from under $100 to nearly $4800.
According to the chart, Ethereum price is currently trading near $2060. It recently broke below the $2300 psychological level and tested the lower diagonal trendline around $1800. This area corresponds with horizontal demand levels from previous years. The chart implies this could represent a final shakeout phase before a strong upward move, similar to historical cycles.

The support zone between $1800 and $2000 has acted as a long-term base in earlier market periods. A reclaim of the $2200–$2400 range is important for Ethereum price to confirm a shift back into bullish momentum on the weekly timeframe.
Altcoin Price Prediction
Additionally, the macro view provided by TimeFreedomROB outlines possible reversal targets if the price continues to follow historical patterns. In 2020, ETH saw a 40x increase following structure reclaim. While current conditions differ, the projected path includes potential resistance levels at $3600, $4870, and an extended range of $6000–$7500.
Supporting the bullish projections, analyst MAXPAIN noted that ETH price could retrace to the $1,900 zone before a potential rally to $3,000. His analysis, based on the TPO chart, identifies the $1,874–$1,924 range as a key support and accumulation area.
The top altcoin is currently trading at $2,064.98, showing an 8.10% gain over the past 7 days. Its market cap stands at $249.12 billion, with a 24-hour trading volume of $11.71 billion.
Ronny Mugendi
Ronny Mugendi is a seasoned crypto journalist with four years of professional experience, having contributed significantly to various media outlets on cryptocurrency trends and technologies. With over 4000 published articles across various media outlets, he aims to inform, educate and introduce more people to the Blockchain and DeFi world. Outside of his journalism career, Ronny enjoys the thrill of bike riding, exploring new trails and landscapes.
Disclaimer: The presented content may include the personal opinion of the author and is subject to market condition. Do your market research before investing in cryptocurrencies. The author or the publication does not hold any responsibility for your personal financial loss.

Should You Buy Stellar (XLM) in April 2025?

Can ETH Overcome Its Disappointing Q1 Performance?
Ripple and BlackRock Working Together for Filing? $3 XRP Price Soon?

Bitcoin Price Next Move Hinges on Support—Break or Bounce?

PI Coin Decline Continues as Market Participation Dwindles

XRP Loses Steam After SEC Win, Enters Consolidation Mode

2.52 Million Altcoins Are Ruining Crypto’s Future

Animoca Brands Valuation Tanks 75% In Two Years, Here’s Why

Crypto exchange BingX hacked for $43 million

Are The Big Players Losing Interest?

Hong Kong’s Securities Association Tips Authorities On Crypto Self-Regulation

Coinbase cbBTC Set to go Live on Solana
2.52 Million Altcoins Are Ruining Crypto’s Future
Animoca Brands Valuation Tanks 75% In Two Years, Here’s Why
Crypto exchange BingX hacked for $43 million
Are The Big Players Losing Interest?
Hong Kong’s Securities Association Tips Authorities On Crypto Self-Regulation
Coinbase cbBTC Set to go Live on Solana
-

 Market20 hours ago
XRP Price Consolidates—Breakout Incoming or More Choppy Moves?
-
 Market23 hours ago
Bitcoin Price Breaks Out with First Spot ETF Inflows in A Month
-

 Market22 hours ago
Solana (SOL) Gains Capped—Breaking $150 Won’t Be Easy
-
 Altcoin20 hours ago
Ethereum Price To Hit $5K Before SOL Rally To $300, Arthur Hayes Says
-

 Altcoin13 hours ago
CBOE Files 19b-4 For Fidelity’s Solana ETF With US SEC
-

 Market19 hours ago
BlackRock Expands Bitcoin ETPs to Europe After US ETF Success
-
 Altcoin19 hours ago
Why Is Pi Coin Price Down 5% Today?
-

 Market18 hours ago
Bitcoin Price Dips After Rally—Is This the Perfect Entry Point?
✓ Share: