
Altcoin
Celestia (TIA) Price Caught in Bearish Trap: What’s Next?

TIA, the native token of the modular blockchain project Celestia, continues to face torrid periods. Trading at $5.32, the price represents a 12.37% decline in the last 30 days.
As time passes, indicators show that TIA may extend its losses as it approaches a crucial point. Here’s what to expect.
Celestia Holders May Need to Deal With Another Decline
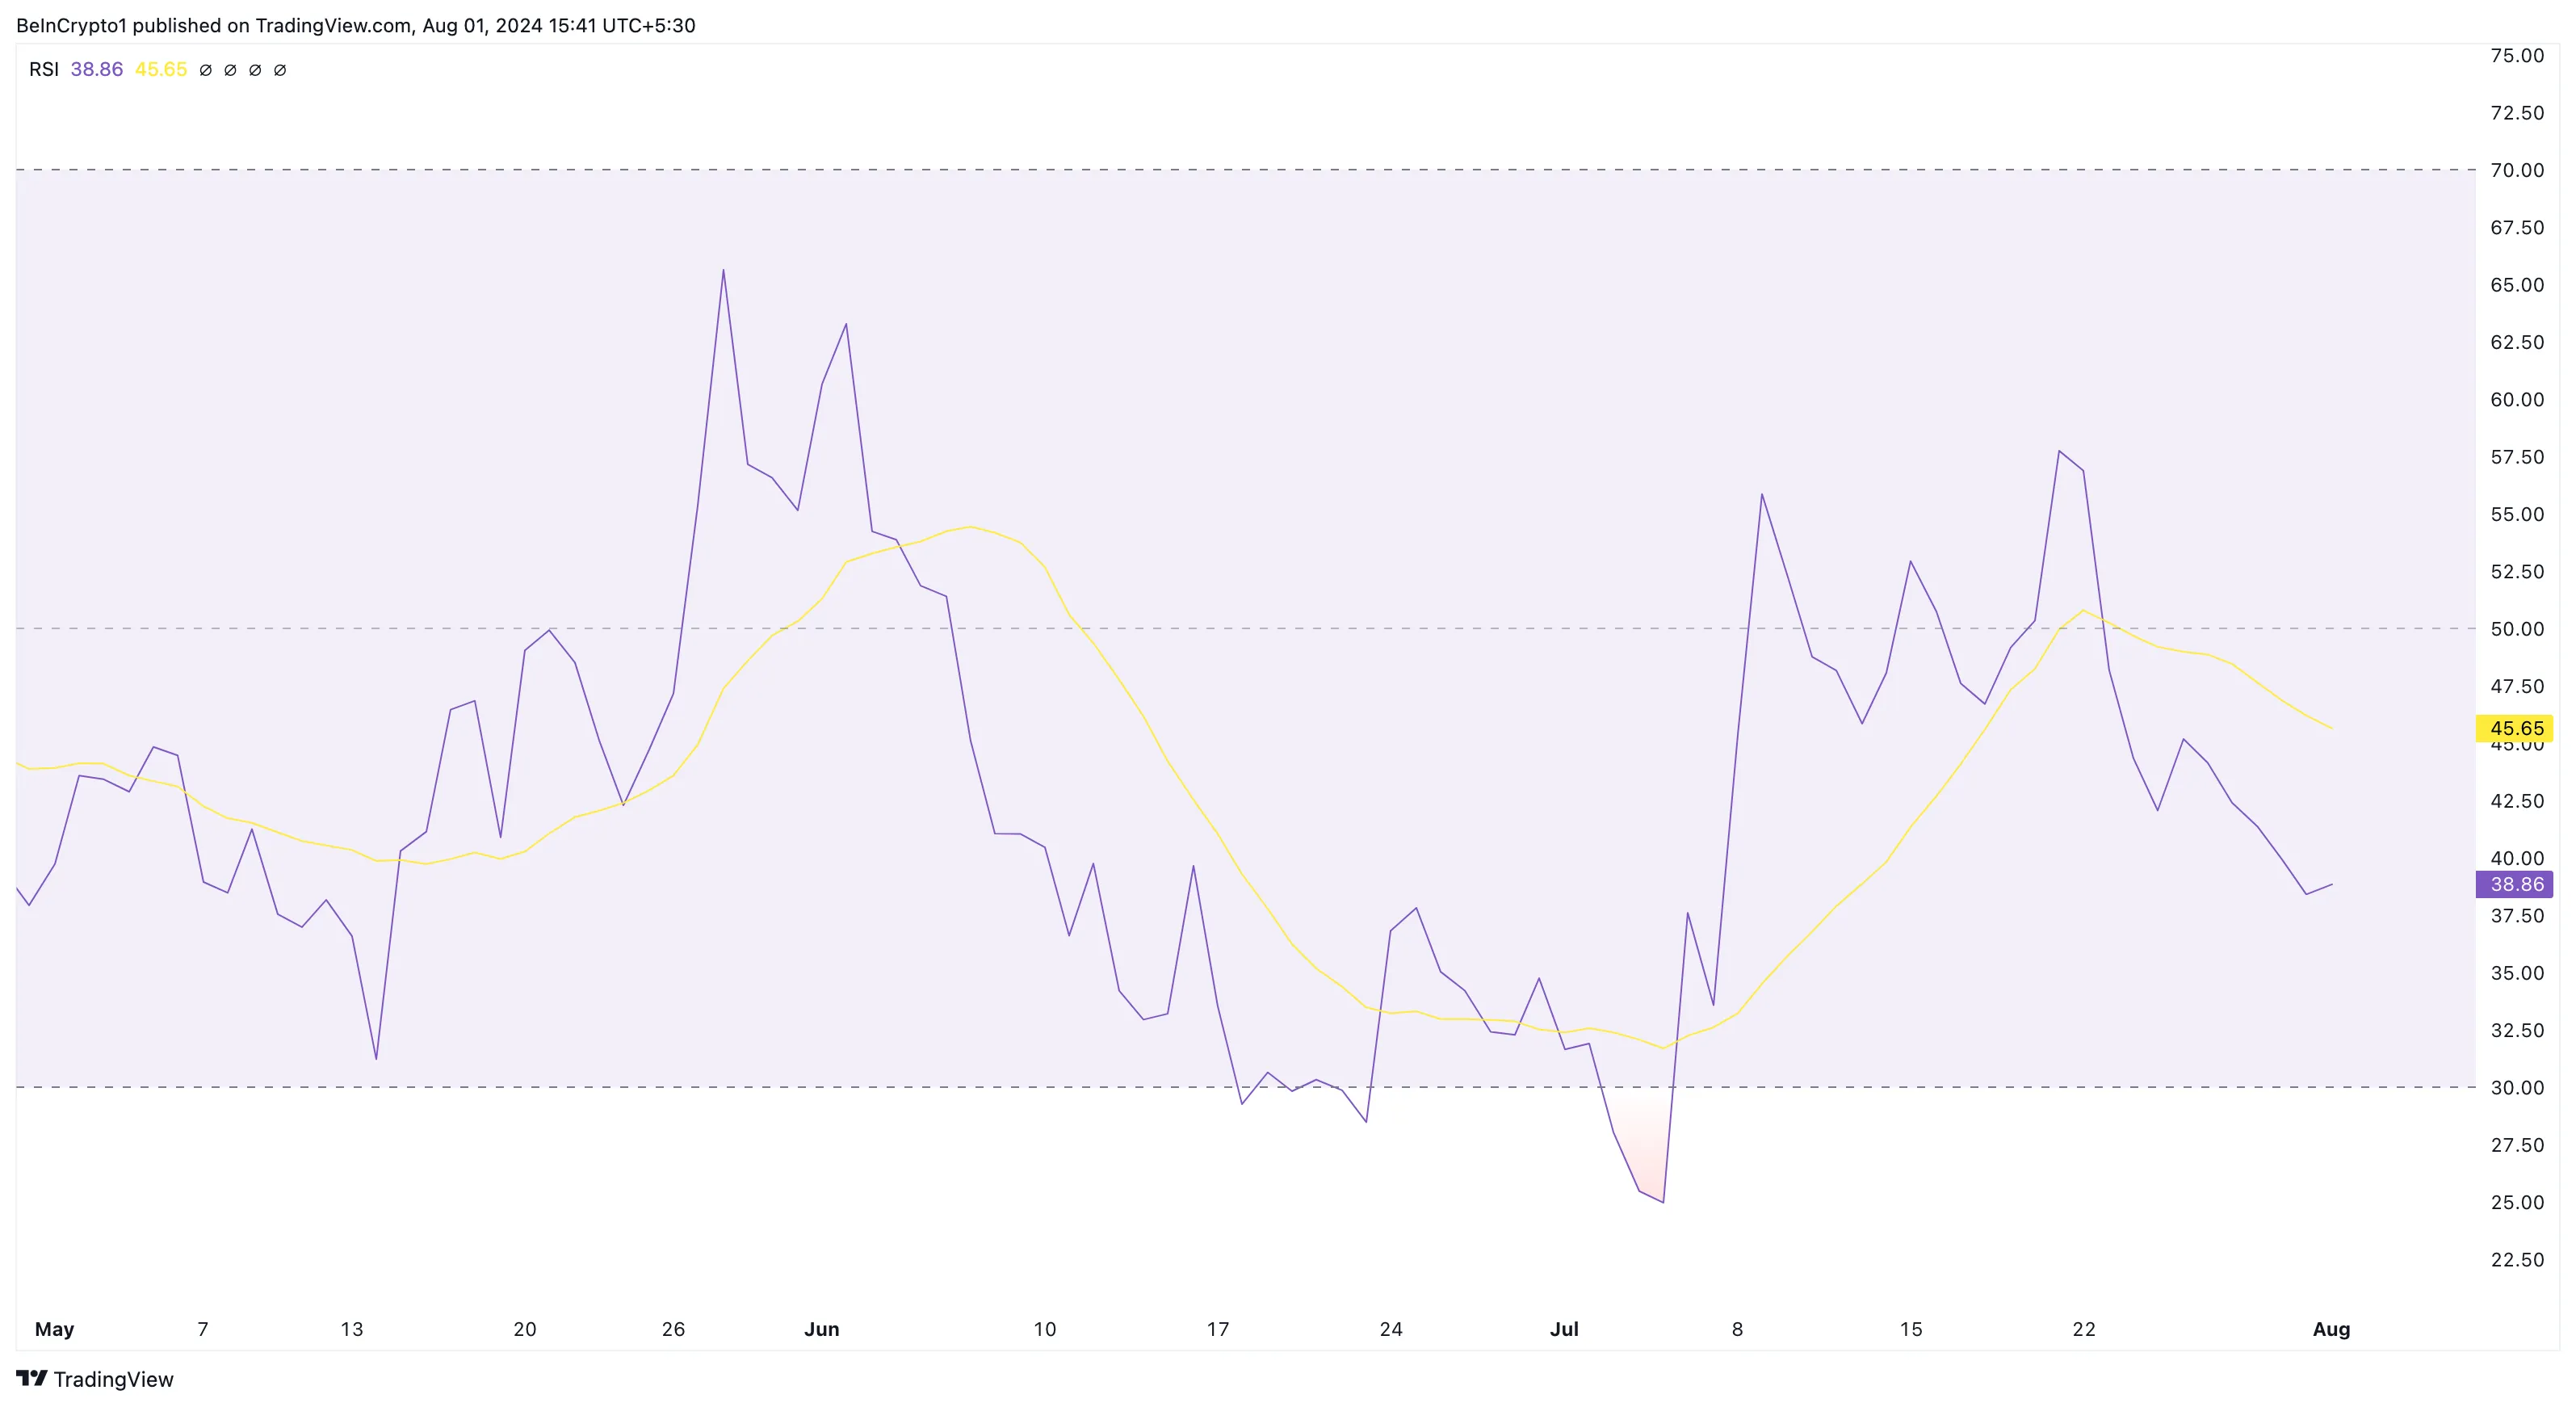
An evaluation of the daily chart reveals that the Relative Strength Index (RSI) reading is 38.86. The RSI is a technical indicator that measures the speed and price changes of a cryptocurrency. Furthermore, the oscillator determines if an asset is overbought or oversold.
When the reading is 70.00 or above, the asset is overbought. But a reading at 30.00 or below points to an oversold condition. Therefore, the RSI decline on Celestia’s chart indicates that the token could be heading toward the oversold zone.
If the momentum reading continues to slide, TIA’s price may also continue to fall. If that happens, the cryptocurrency’s value may drop below $5.
Read More: Top 9 Safest Crypto Exchanges in 2024
Consequently, the current state of the cryptocurrency has driven traders in the derivatives market to hold positions supporting a bearish bias. The Funding Rate, as shown by on-chain data, reveals this.
The Funding Rate represents the difference between a cryptocurrency’s contract price and the spot price. A positive value indicates bullish expectations from traders, while a negative reading indicates that the perpetual price trades lower than the spot price, suggesting a bearish bias.
At press time, TIA’s Funding Rate is in the negative territory, reinforcing the notion that market participants do not anticipate a price bounce.
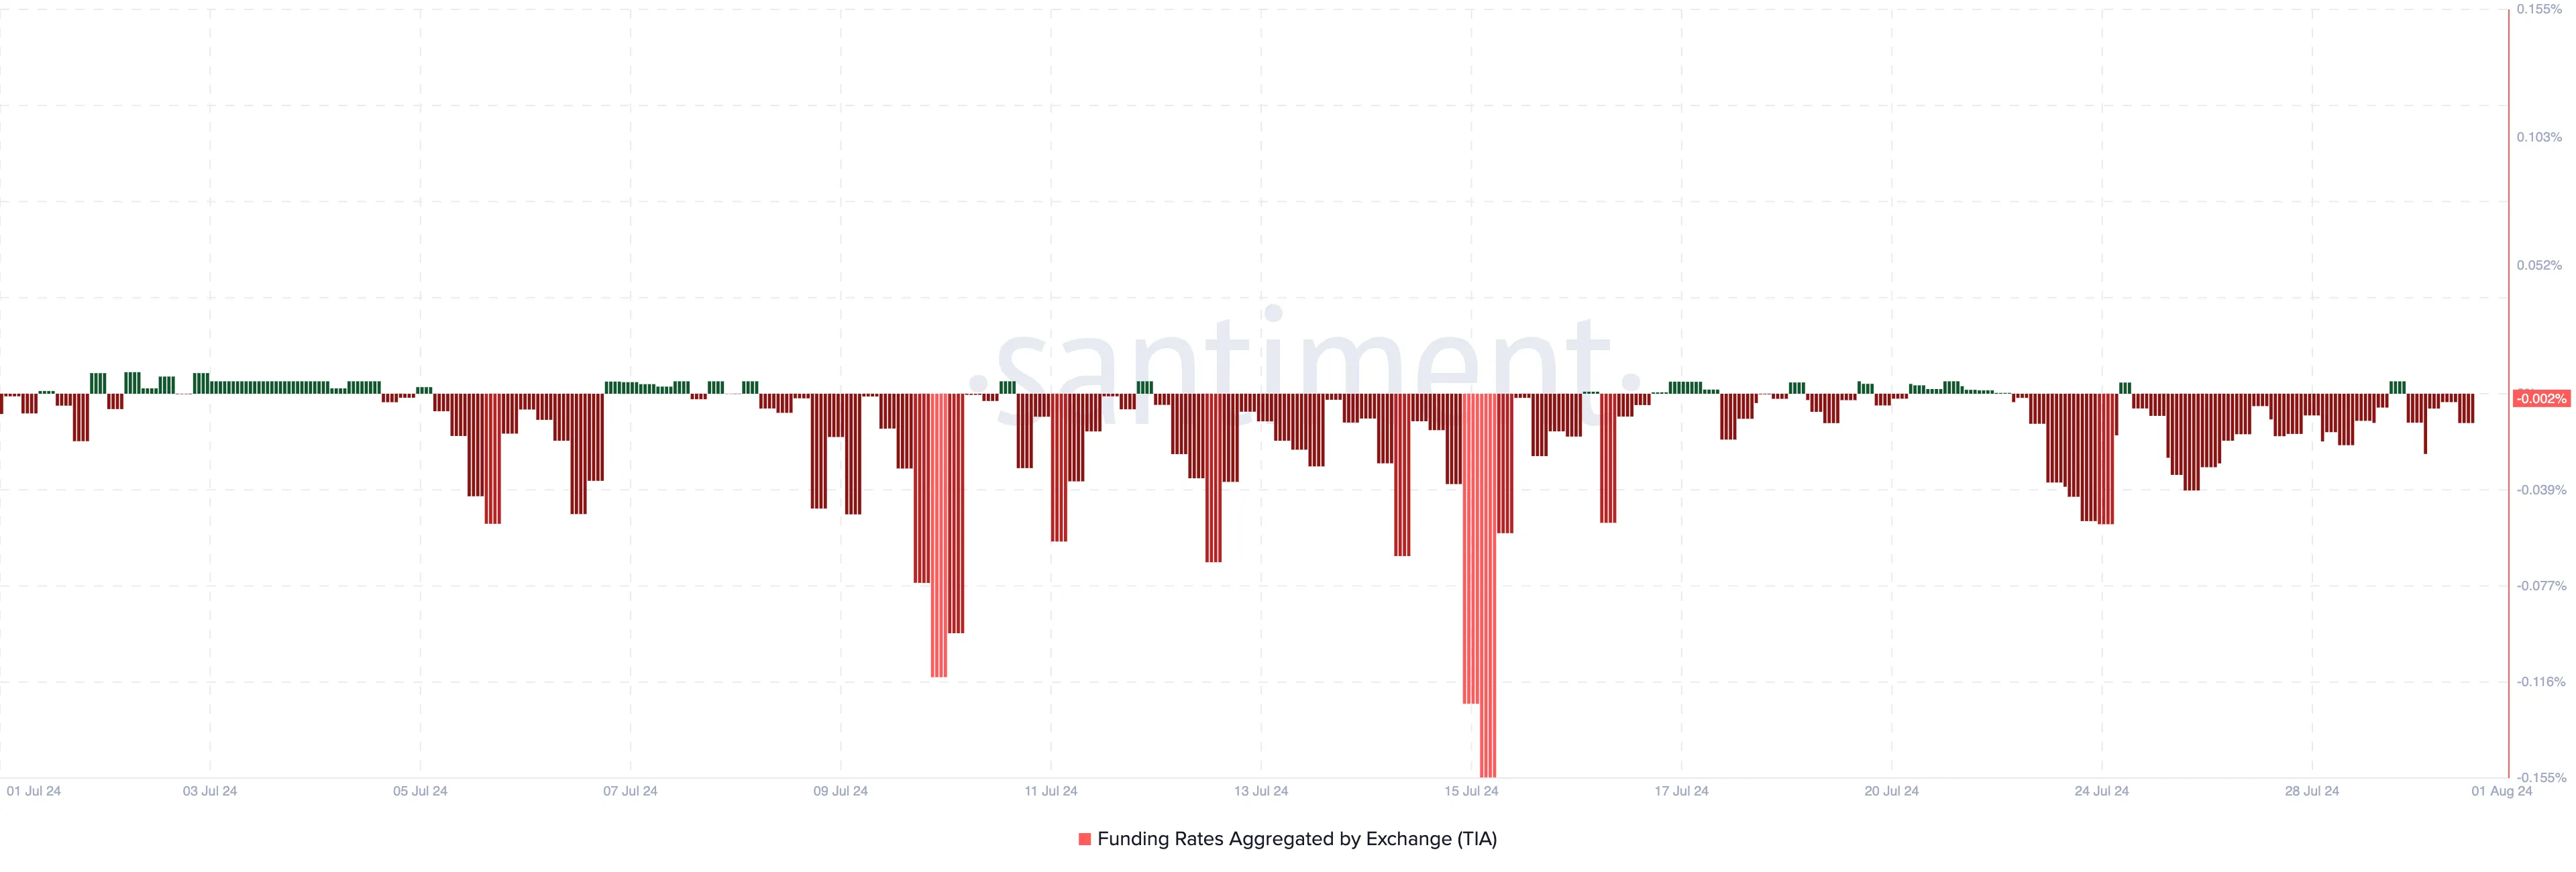
However, this was the case for most of last month, reflecting the doubt the broader market has around TIAA in the short term.
TIA Price Prediction: Will Liquidity Rise Spark a Bounce?
As of this writing, TIA has been trading within a descending triangle since July 22. In this pattern, the price keeps hitting lower highs while the flat support line consolidates around the same area.
Typically, this pattern is bearish, and if the token lacks buying power, another breakdown may occur. Additionally, the Fibonacci Retracement indicator gives an idea of levels where the price may go next as each ratio identifies support and resistance zones.
The most important Fib ratios include 23.6%, 38.2%, 61.8% and 78.6%. From the chart below, TIA’s price has dropped below the 23.6% nominal pullback. Should selling pressure increase, the value of TIA may drop to $4.13.
Read More: Which Are the Best Altcoins To Invest in August 2024?
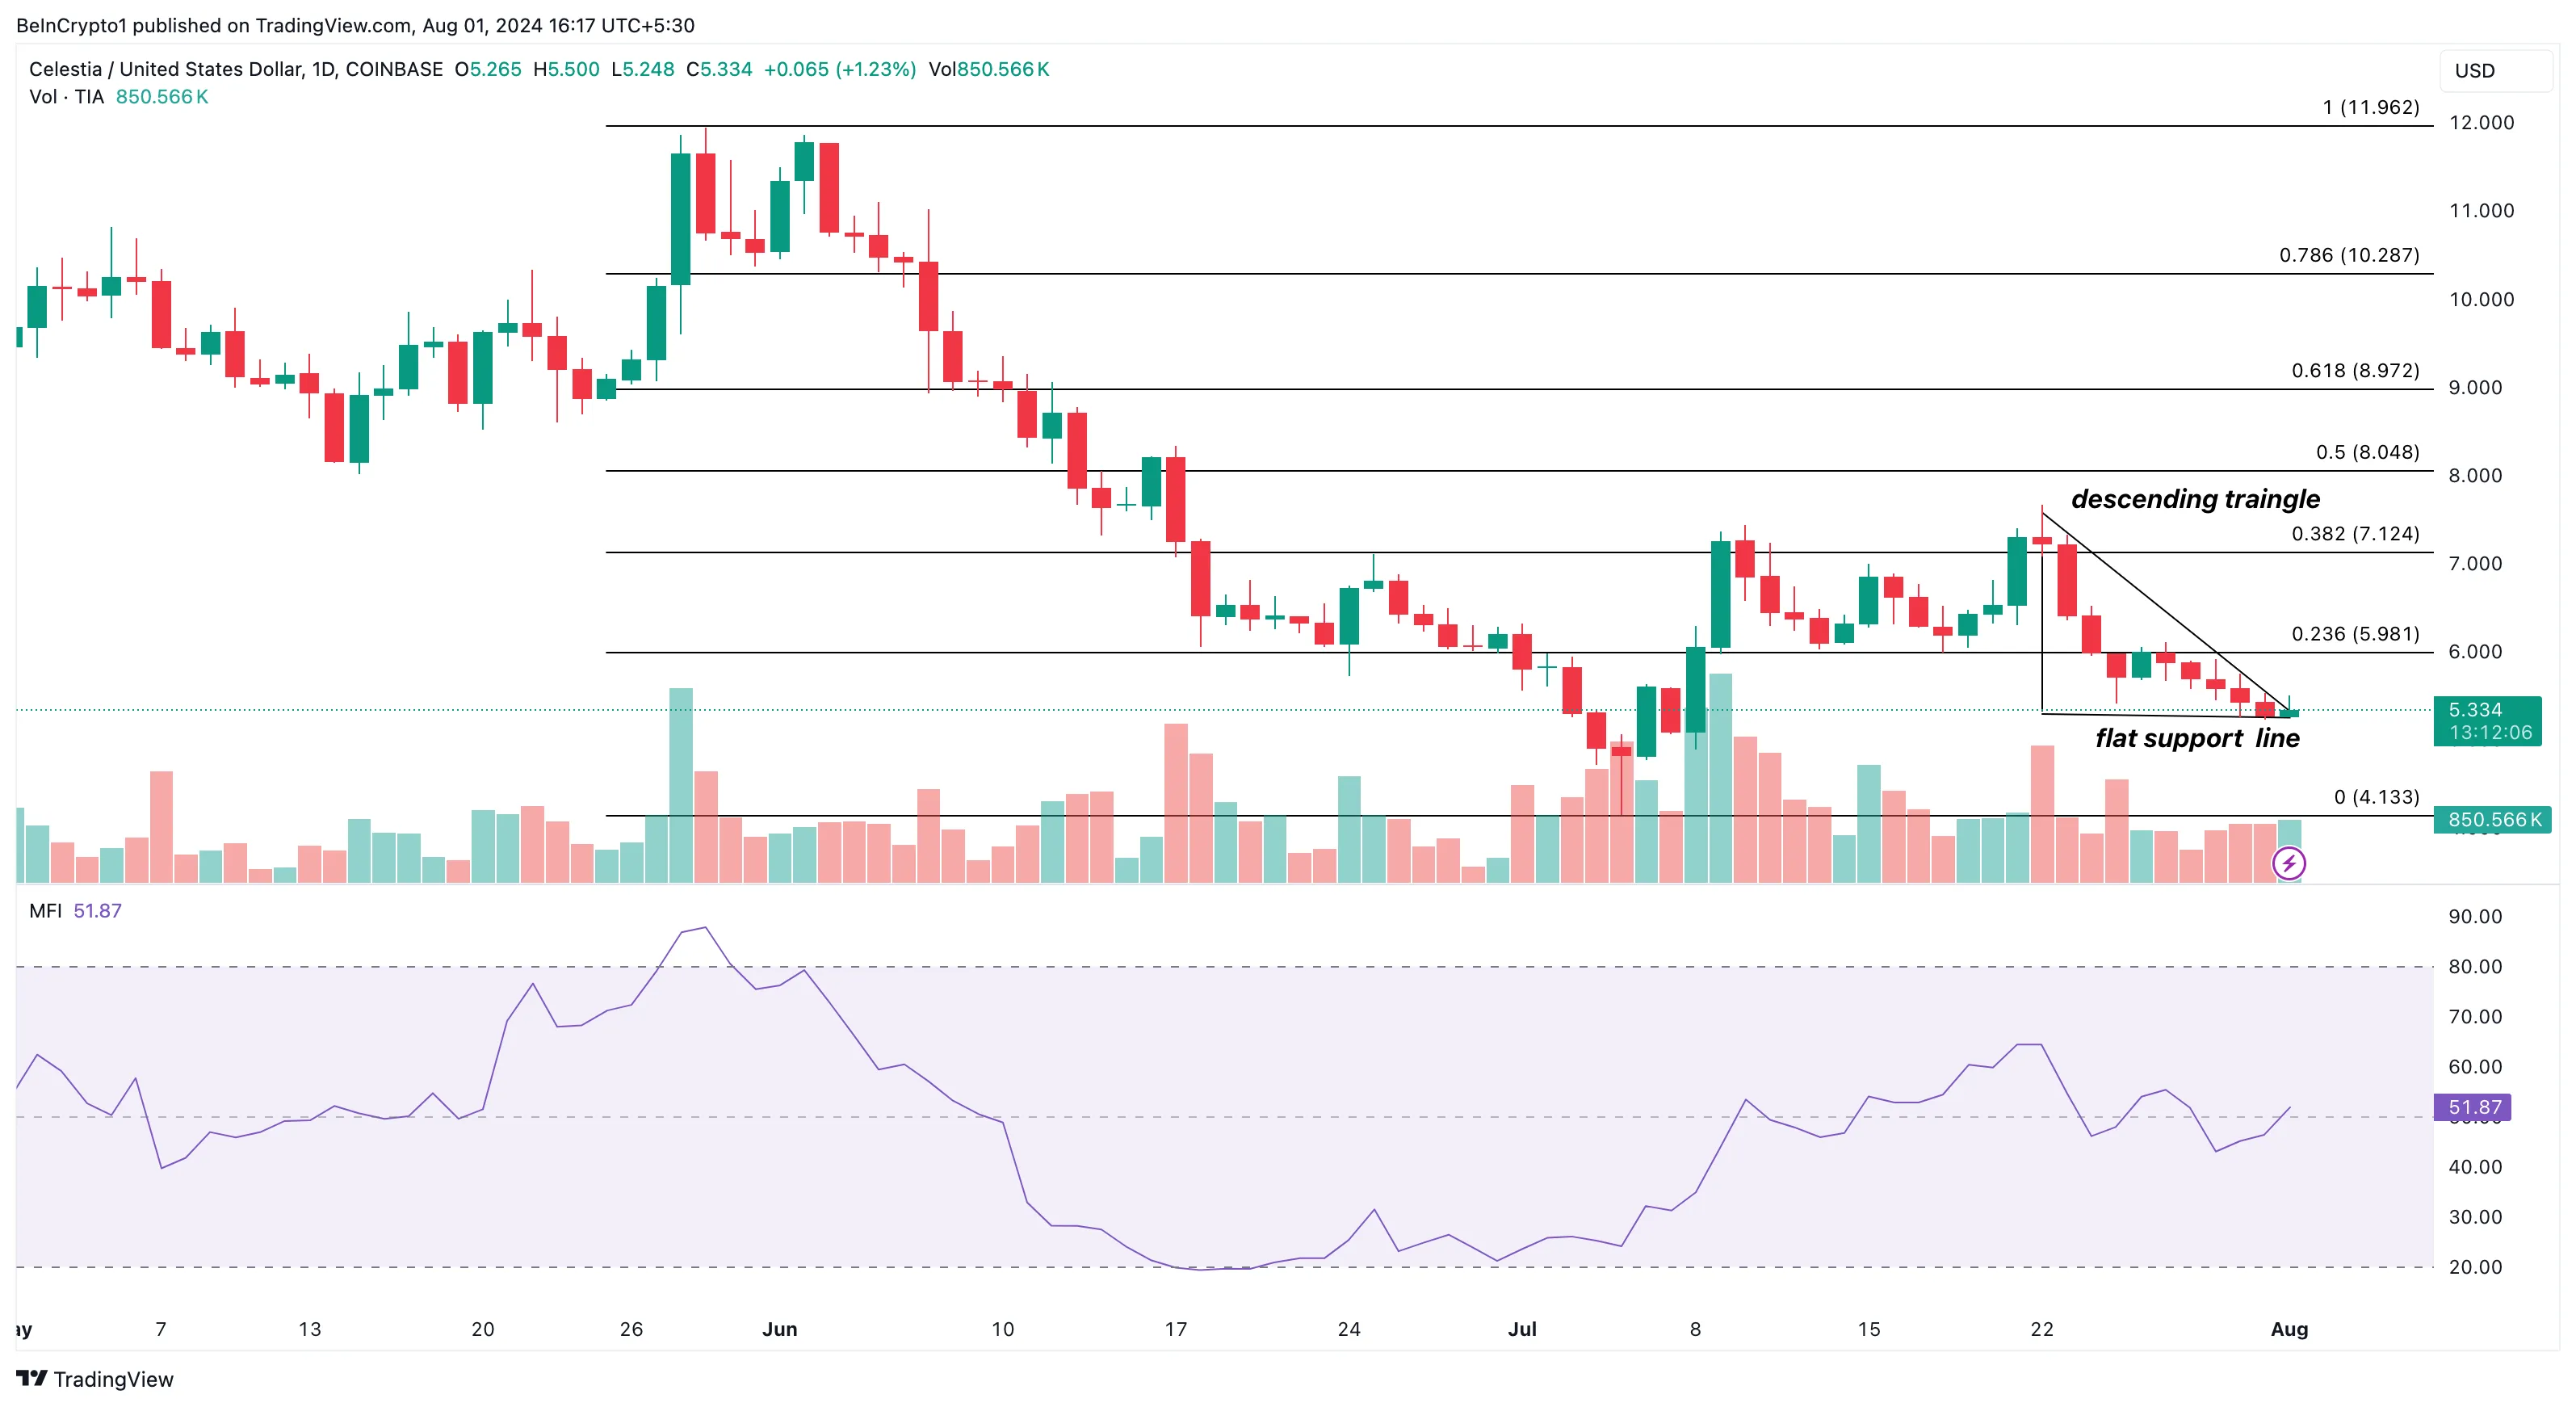
However, the Money Flow Index (MFI) shows that the Celestia token is starting to experience a rise in liquidity. If this continues, TIA’s price may rebound to $5.98, and the bearish thesis will be invalidated
Disclaimer
In line with the Trust Project guidelines, this price analysis article is for informational purposes only and should not be considered financial or investment advice. BeInCrypto is committed to accurate, unbiased reporting, but market conditions are subject to change without notice. Always conduct your own research and consult with a professional before making any financial decisions. Please note that our Terms and Conditions, Privacy Policy, and Disclaimers have been updated.


A DOGE whale has drawn the crypto community’s attention following a recent transfer involving millions of the meme coin. This development comes as crypto analyst Master Kenobi predicted that a Dogecoin price breakout will happen “within hours.”
DOGE Whale Moves 478 Million Coins As Dogecoin Price Eyes Breakout
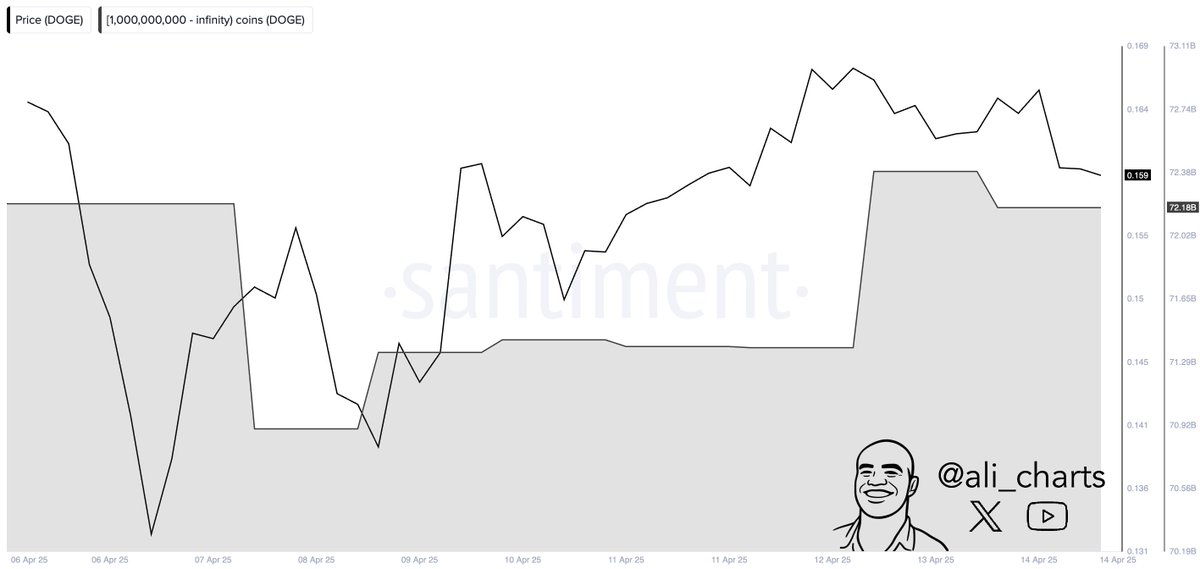
Whale Alert data shows a DOGE whale moved 478 million coins worth $72.9 million from an unknown wallet to another unknown wallet, hinting at active accumulation from this investor. Other whales also look to be actively accumulating, as crypto analyst Ali Martinez revealed that DOGE whales bought over 800 million coins in 48 hours.
This accumulation comes amid Master Kenobi’s prediction that a Dogecoin price breakout will happen within hours. His accompanying chart highlighted an ascending rectangle, from which the breakout could occur. The analyst further remarked that the breakout will also likely surpass the downtrend line.
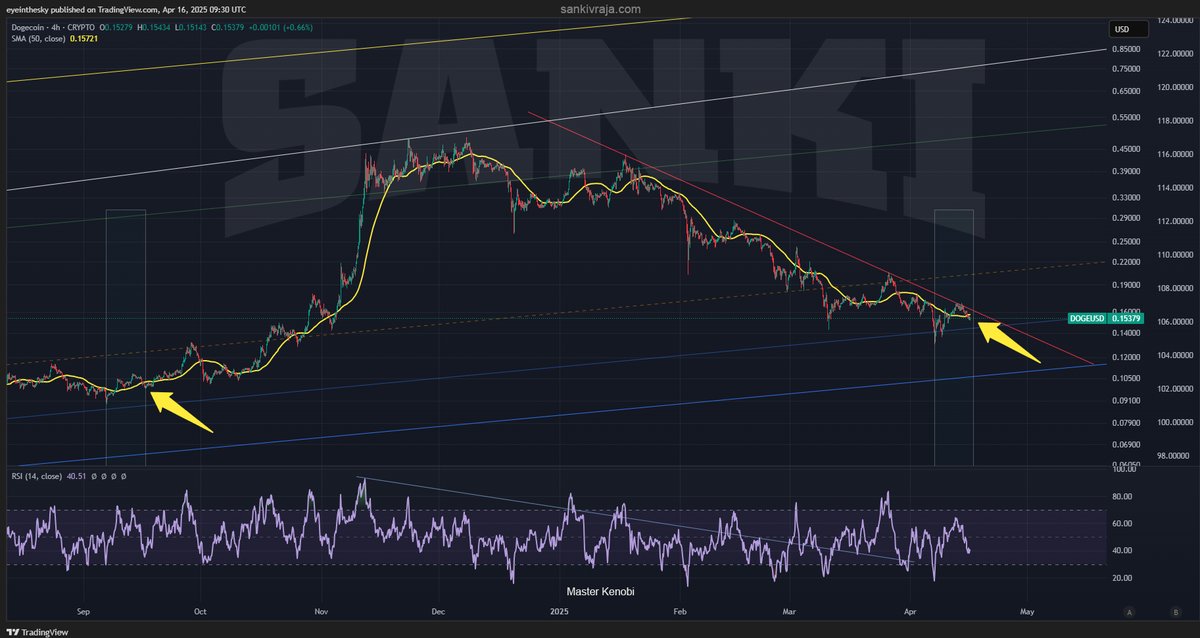
The crypto analyst stated that this is arguably the most significant event for DOGE this year so far. He added that the Dogecoin price’s peak is anticipated around late May to early June, aligning with the BNB price and other major altcoins.
Meanwhile, his accompanying chart also showed that Dogecoin could rally to as high as $0.8 if it reaches the upper boundary of this rectangular channel.
Martinez also recently predicted that the top meme coin could soon reach $0.29. He stated that price needs to hold the key support at $0.13 and sustain a break above $0.17 to reach this level.
More Bullish Outlook For DOGE
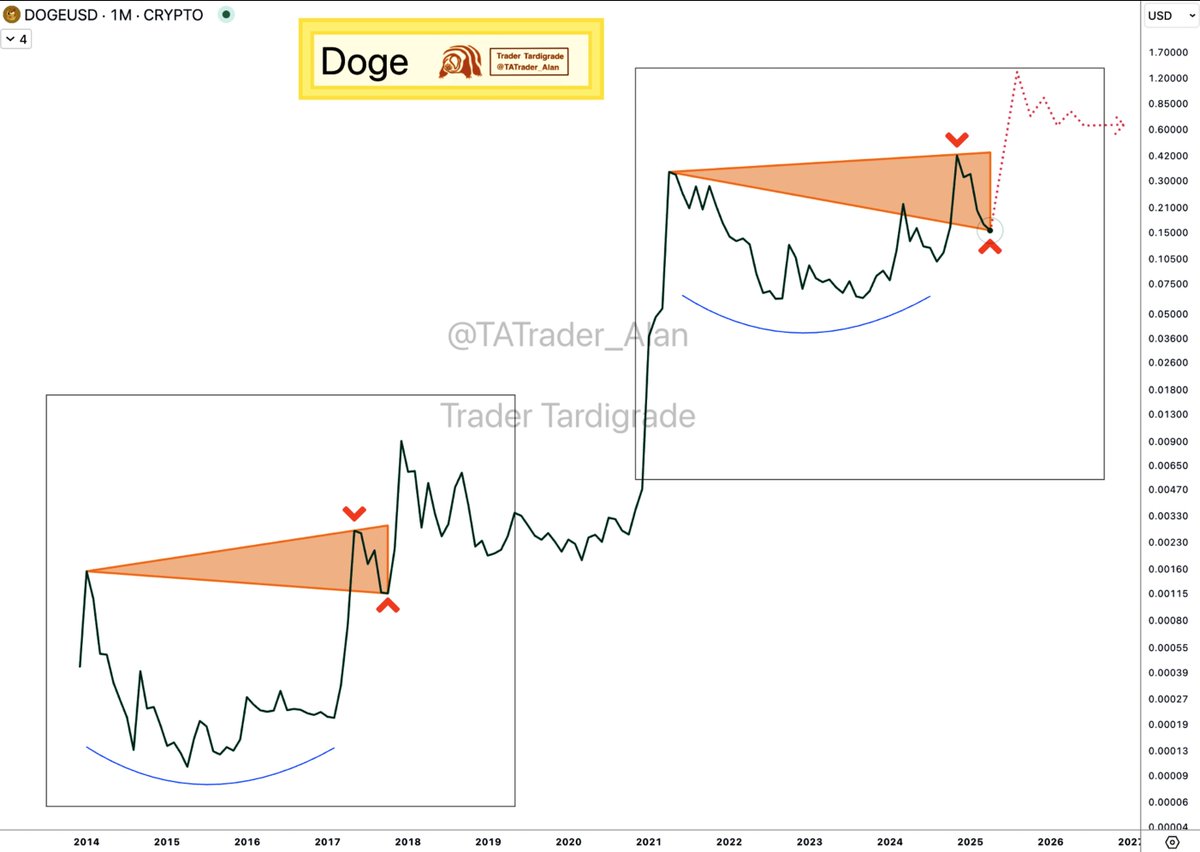
In a series of X posts, crypto analyst Trader Tardigrade provided a bullish outlook for the Dogecoin price. In one post, he stated that DOGE is breaking out of a falling wedge pattern on the 1-hour chart. He added that DOGE’s Relative Strength Index (RSI) also shows a breakout after hitting the oversold zone.
In another post, the crypto analyst stated that Dogecoin is forming a prolonged symmetrical triangle. Trader Tardigrade remarked that the longer the consolidation within the triangle, the stronger the momentum builds, leading to a higher pump for the DOGE price.
His latest X post also showed that the Dogecoin price was eyeing a rally to the $0.8 target, just like Master Kenobi predicted.
Boluwatife Adeyemi
Boluwatife Adeyemi is a well-experienced crypto news writer and editor who has covered topics that cut across several topics and niches. Boluwatife has a knack for simplifying the most technical concepts and making it easy for crypto newbies to understand. Away from writing, He is an avid basketball lover, a traveler and a part-time degen.
Disclaimer: The presented content may include the personal opinion of the author and is subject to market condition. Do your market research before investing in cryptocurrencies. The author or the publication does not hold any responsibility for your personal financial loss.
Solana price could be heading toward a major drop, according to crypto analyst Ali. In a recent analysis, Ali suggested that SOL might be retesting the breakout zone from a right-angled ascending broadening pattern.
Analysis Points to Downside Potential For Solana Price
Ali’s SOL analysis expects the price to drop to $65. This bearishness comes after a period of price weakness for Solana. SOL’s price fell by 1.2% in the last 24 hours, according to recent figures.
For all we know, #Solana $SOL might be retesting the breakout zone from a right-angled ascending broadening pattern, with the $65 target still in play. pic.twitter.com/vujFJQWurz
— Ali (@ali_charts) April 16, 2025
The prediction arrives at a time for the Solana network when Canada will launch Solana ETFs today after regulatory approval by the Ontario Securities Commission (OSC).
Ali’s technical analysis focuses on a right-angled broadening ascending pattern that has appeared on Solana’s price chart. SOL, according to the analyst, is re-testing the breakout pattern area, and this could be an indication of more downside action if the level fails to act as support.
This bearish outlook is shared by some other analysts in the crypto space. SatoshiOwl noted that Solana is not looking good and that it is breaking down from trendline on 1h. However, the analyst cautioned that confirmation was still needed from 1-hour and 4-hour candle closings. The analyst suggested that Solana might retest $120 first before possibly moving higher.
Not all analysts share this bearish view, however. Trader David identified what he described as bullish signs for SOL as this channel continues to move upward. He pointed out that after a 33% correction, Solana is now on a strong support level. He expressed hope that the token will reach new heights again.
Bullish signs for $SOL as this channel continues to move upward.
Hopefully we will see Solana on heights again. After 33% correction it is now on a strong support level.#Crypto #CryptoEducation pic.twitter.com/Pvj6RAC0WS
— David (@David_W_Watt) April 16, 2025
Canadian ETF Launch Could Provide Institutional Access
Despite the bearish technical outlook from some analysts, Solana is experiencing a potentially positive development on the institutional front. The Ontario Securities Commission (OSC) has approved multiple ETF issuers to list Solana-based products in Canada, including Purpose, Evolve, CI, and 3iQ.
This regulatory clearance sets the stage for Solana ETFs to come to market. This may make the cryptocurrency available to a new generation of institutional investors who would rather have regulated investment products rather than direct exposure to cryptocurrency. The timing of this news is interesting, as it is happening during technical uncertainty in the price action of Solana.
Bloomberg ETF analyst Eric Balchunas provided some background on the upcoming launches. He clarified that Canada is preparing spot Solana ETFs to launch this week after the regulator waved the green flag to multiple issuers. He added that the ETFs will also offer staking through TD.
But the initial market reaction to this news has been muted, with the Solana price showing little positive momentum in response to the much-awaited launch of the ETF. CoinGape has also released an extensive Solana prediction for April 2025.
Vignesh Karunanidhi
Vignesh Karunanidhi is a seasoned crypto journalist with nearly 7 years of experience in the cryptocurrency industry. He has contributed to numerous publications, including WatcherGuru, BeInCrypto, Milkroad, and authored over 10,000 articles
Disclaimer: The presented content may include the personal opinion of the author and is subject to market condition. Do your market research before investing in cryptocurrencies. The author or the publication does not hold any responsibility for your personal financial loss.

The Mantra (OM) token price has surged after founder JP Mullin announced plans for a massive token burn. Mullin clarified that he intends to burn his personal team token allocation and implement a “comprehensive burn program for other parts of the OM supply.”
OM Pumps After Founder’s Burn Announcement
The OM token, which had experienced a major price drop over recent weeks, jumped from a low of $0.5115 to as high as $0.8706 following Mullin’s statement on X.
This announcement comes as OM has seen price drops of 87.0% over the past week. CoinGape has released a Mantra OM price prediction for April 2025, which could give you an idea of how the token can perform this month.
Mantra has initially shelved 300 million OM tokens for its team and core contributors. This accounts for 16.88% of the token’s nearly 1.78 billion total supply. These tokens are currently locked and were scheduled for a phased release between April 2027 and October 2029.
To be 100% clear, I am stating that I am burning MY team tokens, and we will create a comprehensive burn program for other parts of the OM supply. https://t.co/Yy6GzRBbM8
— JP Mullin (
,
) (@jp_mullin888) April 16, 2025
The planned burn could possibly take out a huge quantity of these tokens from the market for good. A decentralized vote could decide if all 300 million team token issuance needs to be burnt, as proposed by Mullin.
The announcement has been followed by various reactions from the Mantra community. Some members of the community believed that Mullin’s commitment was a positive development for token valuation, while others were concerned about having long-term issues.
Crypto Banter founder Ran Neuner warned against the move: “Burning the incentive may seem like a good gesture but it will hurt the team motivation long term.”
Mantra Refutes Allegations Following Price Collapse
Mullin’s token burn announcement comes at a difficult time for the project. The company has vehemently denied reports that it holds 90% of OM token supply. It has also rejected allegations of market manipulation and insider trading submitted by some community members.
Mantra explained that the latest price drop of OM occurred due to “reckless liquidations” and not due to anything the team had done. The recent history of the token indicates the size of this drop, with the charts reflecting a nearly 90% decline in value over the past month.
Major cryptocurrency exchanges OKX and Binance both experienced major OM trading activity immediately before the token’s collapse. However, both platforms have denied any wrongdoing in relation to the price crash. Binance mentioned that the crash was mainly due to cross-exchange liquidations.
They attributed the collapse to tokenomics adjustments that were made during October 2024 and abnormal market volatility that ultimately led to high-volume cross-exchange liquidations on April 13.
Vignesh Karunanidhi
Vignesh Karunanidhi is a seasoned crypto journalist with nearly 7 years of experience in the cryptocurrency industry. He has contributed to numerous publications, including WatcherGuru, BeInCrypto, Milkroad, and authored over 10,000 articles
Disclaimer: The presented content may include the personal opinion of the author and is subject to market condition. Do your market research before investing in cryptocurrencies. The author or the publication does not hold any responsibility for your personal financial loss.

Crypto Market Lost $633 Billion in Q1 2025, CoinGecko Finds

Base Meme Coin Wipes $15 Million After Official Promotion

ETF Issuers Bring Stability to Bitcoin Despite Tariff Chaos

Here’s What Happens If The XRP Price Closes Out This Week Above $2.25

Over 1.9M Ethereum Positioned Between $1,457 And $1,598 – Can Bulls Hold Support?

Bitcoin and Ethereum Now Accepted by Panama City Government


-

 Market22 hours ago
3 US Crypto Stocks to Watch Today: CORZ, MSTR, and COIN
-

 Market21 hours ago
Bitcoin Price on The Brink? Signs Point to Renewed Decline
-

 Market23 hours ago
Ethena Labs Leaves EU Market Over MiCA Compliance
-
 Market19 hours ago
XRP Price Pulls Back: Healthy Correction or Start of a Fresh Downtrend?
-
 Altcoin19 hours ago
Ripple Whale Moves $273M As Analyst Predicts XRP Price Crash To $1.90
-

 Market20 hours ago
Ethereum Leads Q1 2025 DApp Fees With $1.02 Billion
-

 Market18 hours ago
Arbitrum RWA Market Soars – But ARB Still Struggles
-

 Bitcoin17 hours ago
Is Bitcoin the Solution to Managing US Debt? VanEck Explains

 Arabic
 Chinese (Simplified)
 Dutch
Dutch English
 French
 German
 Italian
 Portuguese
 Russian
 Spanish
 Vietnamese
✓ Share: