
Altcoin
Analyst Identifies Key Levels For BNB Price Rally To $800
Crypto analyst Ali Martinez has identified critical resistance levels that could determine whether Binance Coin (BNB) continues its upward trajectory toward $800. His analysis highlights three major simple moving averages (SMA)—the 50, 100, and 200 SMA—that currently act as strong barriers to further price growth. Additionally, he points to the 0.382 Fibonacci retracement level, a historically significant resistance zone where price reversals have occurred.
Key Resistance Levels That Could Drive Binance Coin (BNB) Price Higher
According to analyst Ali Martinez, BNB price is facing resistance at key technical levels that must be broken to sustain its upward momentum. The 50, 100, and 200 simple moving averages (SMA) serve as strong resistance zones. These moving averages have historically prevented Binance Coin price from advancing further, acting as key decision points.
Martinez also highlights the 0.382 Fibonacci retracement level, which aligns with past resistance zones where BNB price has struggled to break through. This level has often led to price pullbacks, making it a crucial area to monitor. If BNB manages to break above this resistance, the asset could experience a stronger push toward higher price targets.
Further adding to these challenges, the TD Sequential indicator reveals resistance trendlines and risk lines that have previously signaled trend reversals. Binance Coin needs to break past these levels to avoid a pullback before any further upside movement.
Meanwhile, Binance and the U.S. SEC recently filed a joint motion to pause their legal dispute for 60 days. This development has reduced uncertainty around Binance, providing a positive catalyst for BNB price. Binance also unveiled its 2025 roadmap, outlining plans to integrate artificial intelligence and improve transaction speeds, further supporting the bullish outlook for BNB.
Binance Coin Gains Despite Crypto Market Downturn
Despite the wider crypto market downturn, BNB has maintained its crypto rally, gaining over the past 24 hours. While Bitcoin and Ethereum dropped by 1.5% and 4% in the last 7 days respectively, BNB has gained over 6% in 24 hours and 17% over the past week.
The recent increase in BNB price comes amid rising U.S. inflation data. The Consumer Price Index (CPI) report showed a 3% year-over-year increase in January, exceeding economists’ expectations. This inflation spike has impacted major cryptocurrencies, leading to declines in Bitcoin and other assets.
However, BNB has remained resilient, continuing its crypto rally despite market uncertainty.
On-Chain Growth and Binance Developments Boost BNB
Nansen analyst Aurelie Barthere has pointed to strong on-chain activity on Binance Smart Chain (BSC) as a key driver of BNB price gains. BSC’s network fees surged 114% in the past week, contrasting with negative growth seen on other blockchains. This increase in network activity suggests growing demand for transactions on the Binance ecosystem.
Moreover, a recent CoinGape report highlighted that Binance coin social media mentions hit an eight-month high amid the TST memecoin rumors. Despite Changpeng Zhao’s denial, the controversy fueled market excitement, driving BNB price surge.
Martinez emphasized that overcoming these resistance levels could set the stage for a strong breakout. If BNB price successfully moves past the 50, 100, and 200 SMA, along with the 0.382 Fibonacci retracement level, it could signal the start of a crypto rally toward the $800 target.
Ronny Mugendi
Ronny Mugendi is a seasoned crypto journalist with four years of professional experience, having contributed significantly to various media outlets on cryptocurrency trends and technologies. With over 4000 published articles across various media outlets, he aims to inform, educate and introduce more people to the Blockchain and DeFi world. Outside of his journalism career, Ronny enjoys the thrill of bike riding, exploring new trails and landscapes.
Disclaimer: The presented content may include the personal opinion of the author and is subject to market condition. Do your market research before investing in cryptocurrencies. The author or the publication does not hold any responsibility for your personal financial loss.


Solana (SOL) price has been under pressure recently, leading to concerns about a potential downtrend against Bitcoin (BTC). On the SOL/BTC price chart are signs that the cryptocurrency could be forming a “death cross,” a pattern that suggests a further decline in price.
This follows a period of weak performance for Solana relative to Bitcoin, sparking discussions on whether the altcoin can recover or continue to underperform.
Will Solana Form a Death Cross Against Bitcoin?
Over the past few months, Solana price has experienced a sharp decline when compared to Bitcoin. As of mid-April 2025, Solana is priced at 0.00158 BTC, down by 23% from earlier in the month. This comes after a significant 54% drop since January, showing a steady loss in value relative to Bitcoin.
The recent drop in Solana’s price has raised concerns among traders and analysts. Moving averages, which track price trends over time, have been narrowing, which is often a precursor to a potential death cross formation.

Specifically, the 23-day moving average is approaching the 200-day moving average in the weekly chart, a key level for technical analysts. If it crosses below the 200-day average, it would officially signal a death cross. This could indicate a further decline in Solana’s price against Bitcoin.
Solana’s Recent Performance and Market Trend
Nonetheless, Solana has had some strength, which can be attributed to the recent launch of Solana ETFs in Canada.
At the same time, institutional investors’ attention contributed to the altcoin’s success in surpassing the performance of numerous other cryptocurrencies, including Bitcoin. Solana delivered a 10.5% return within a week, while Bitcoin delivered a 1.8% return in the same time frame.
Nonetheless, the recent excitement about Solana appears to have subsided with the lessened market movements. Analysts like Ali Charts are now analysing whether the recent strength was just a blip in the charts or the first sign of an actual trend reversal to $65.
SOL/BTC Technical Patterns and Support Levels
Based on the current technical perspective, Solana’s price trend against Bitcoin has established the “Falling wedge” chart. This pattern is normally noticed during the consolidation phase, and the break above the upper trend line is usually interpreted as a signal for a bullish move.
The declining moving averages indicate that Solana may continue to decline against Bitcoin and possibly test lower supports despite the SOL/ETH ratio recording its highest weekly close
At present, the price is almost at the apex of the wedge pattern, meaning that it can break soon. If the price surmounts the resistance level at around 0.0018BTC, it will possibly lead to a bullish run and might even regain the value of 0.001895BTC for Sol. However, if the price cannot hold its support at 0.0014 BTC, then it may decrease even lower.

Solana’s performance against Bitcoin will be very significant over the next few weeks. The potential death cross and the support and resistance levels on the chart pinpoint that Solana might experience a difficult time moving forward. If the trend persists, the altcoin could potentially drop as low as 0.001 BTC—a price point that, when measured in dollar terms, is below $100.
Kelvin Munene Murithi
Kelvin is a distinguished writer with expertise in crypto and finance, holding a Bachelor’s degree in Actuarial Science. Known for his incisive analysis and insightful content, he possesses a strong command of English and excels in conducting thorough research and delivering timely cryptocurrency market updates.
Disclaimer: The presented content may include the personal opinion of the author and is subject to market condition. Do your market research before investing in cryptocurrencies. The author or the publication does not hold any responsibility for your personal financial loss.
American asset management company Canary Capital has taken a new leap with a new filing for a staked Tron ETF product. Known as the pioneer of some of the most renowned altcoin ETF products, this new Tron ETF has further placed the firm at the forefront of the exchange-traded fund drive.
The Canary Capital Staked Tron ETF
According to the prospectus released by the firm, the new product is dubbed the Canary Staked TRX ETF. The firm is yet to reveal the trading platform the product will trade on, however, it confirms it will provide exposure to the price of Tron.
Based on the pricing data offered by Coindesk Indices, Canary Capital said it will rely on this to establish the Net Asset Value (NAV) for the product. This latest filing comes barely a month after the asset manager filed for Pengu ETF with the US Securities and Exchange Commission (SEC).
This is a breaking news, please check back for updates!!!
Godfrey Benjamin
Benjamin Godfrey is a blockchain enthusiast and journalists who relish writing about the real life applications of blockchain technology and innovations to drive general acceptance and worldwide integration of the emerging technology. His desires to educate people about cryptocurrencies inspires his contributions to renowned blockchain based media and sites. Benjamin Godfrey is a lover of sports and agriculture.
Disclaimer: The presented content may include the personal opinion of the author and is subject to market condition. Do your market research before investing in cryptocurrencies. The author or the publication does not hold any responsibility for your personal financial loss.

Based on historical data, July could be the next bullish month for the XRP price, which continues to consolidate amid this crypto market downtrend. Despite the market downturn, crypto analysts like CasiTrades are confident that the altcoin could still reach a new all-time high (ATH) in this market cycle.
Historical Data Points To July Being The Next Bullish Month For The XRP Price
Cryptorank data shows that July could be the next bullish month for the XRP price. This is based on the fact that the altcoin has recorded significant gains in each of the last five Julys.
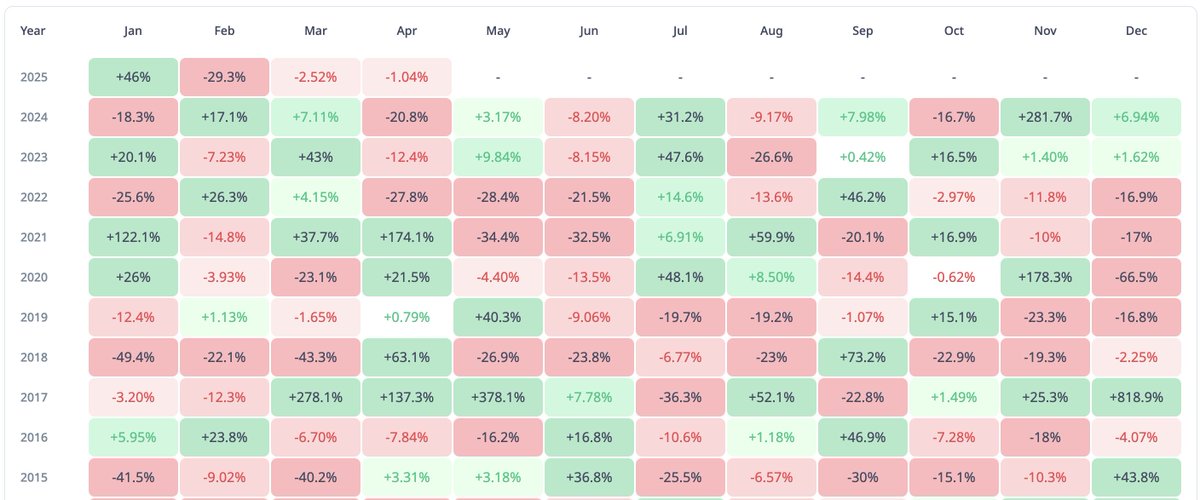
Unlike July, April to June have been mixed for XRP over the last five years. For April, the last three out of five months have been bearish for the altcoin, although it recorded a 174% gain in April 2021.
For May, three out of the last five months have been bearish for the XRP price, although it recorded meagre gains in May 2023 and 2024. Meanwhile, June has been completely bearish for the altcoin, as it recorded monthly losses in the last five months.
It is worth mentioning that four out of the five monthly gains for XRP in July have been double-digit gains. As such, Ripple’s native crypto could again record double-digit gains this coming July.
Interestingly, crypto analyst Egrag Crypto predicted that XRP could reach double digits by its July 21 cycle peak. He alluded to the altcoin’s previous bull runs as to why July could mark this cycle’s peak. The analyst believes the Ripple price could reach $27 by then.
Analysts Argue XRP’s Consolidation Could End Soon
Amid this historical data, crypto analysts Dark Defender and CasiTrades have suggested that the XRP price consolidation could end soon. In an X post, Dark Defender stated that the altcoin’s consolidation is nearing an end and that he believes this is the final consolidation of the monthly structure.
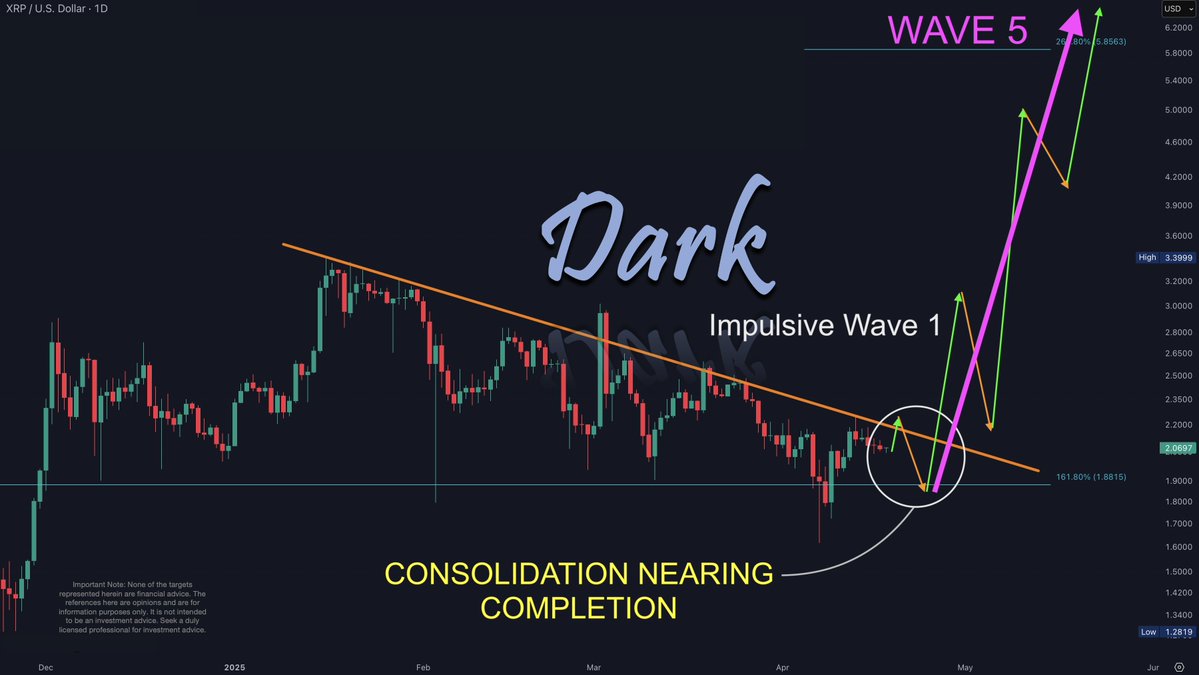
Once this consolidation is done, the crypto analyst remarked that market participants can expect the Wave 5, which will send Ripple’s native crypto to new highs. He highlighted $2.22 and $2.30 as the major resistances to watch out for, while $1.88 and $1.63 are the major support levels. Meanwhile, the targets on this Wave 5 up are $3.75 and $5.85, which will mark a new ATH for the altcoin.
As CoinGape reported, crypto analyst CasiTrades also predicted that the XRP price could soon reach $6 as Wave 2 correction nears its end. The analyst also raised the possibility of the altcoin rallying to as high as $9.50 and $12 if it reaches the 2.618 and 3.618 Fibonacci extension levels, respectively.
However, there is still the possibility of the XRP price dropping below the $2 level before it rallies to new highs. Egrag Crypto warned that Ripple’s native crypto could still drop to as low as $1.4 in the event of a major liquidation.
Boluwatife Adeyemi
Boluwatife Adeyemi is a well-experienced crypto news writer and editor who has covered topics that cut across several topics and niches. Boluwatife has a knack for simplifying the most technical concepts and making it easy for crypto newbies to understand. Away from writing, He is an avid basketball lover, a traveler and a part-time degen.
Disclaimer: The presented content may include the personal opinion of the author and is subject to market condition. Do your market research before investing in cryptocurrencies. The author or the publication does not hold any responsibility for your personal financial loss.

Pi Network, Grayscale’s Altcoin Shake-Up
Is Solana Forming a Death Cross Against Bitcoin?

TRUMP Meme Coin Ignores $307M Unlock, Bearish Trend Holds

Solana (SOL) Price Rises 13% But Fails to Break $136 Resistance

Pi Network Roadmap Frustrates Users Over Missing Timeline

MEME Rallies 73%, BONE Follows

2.52 Million Altcoins Are Ruining Crypto’s Future

Animoca Brands Valuation Tanks 75% In Two Years, Here’s Why

Crypto exchange BingX hacked for $43 million

Are The Big Players Losing Interest?

Hong Kong’s Securities Association Tips Authorities On Crypto Self-Regulation

Coinbase cbBTC Set to go Live on Solana
2.52 Million Altcoins Are Ruining Crypto’s Future
Animoca Brands Valuation Tanks 75% In Two Years, Here’s Why
Crypto exchange BingX hacked for $43 million
Are The Big Players Losing Interest?
Hong Kong’s Securities Association Tips Authorities On Crypto Self-Regulation
Coinbase cbBTC Set to go Live on Solana
-

 Ethereum18 hours ago
Ethereum Fee Plunges To 5-Year Low—Is This A Bottom Signal?
-

 Market22 hours ago
Ethereum Price Fights for Momentum—Traders Watch Key Resistance
-
 Altcoin22 hours ago
Expert Predicts Pi Network Price Volatility After Shady Activity On Banxa
-

 Market17 hours ago
Bitcoin Price Gears Up for Next Leg Higher—Upside Potential Builds
-

 Market20 hours ago
Is XRP’s Low Price Part of Ripple’s Long-Term Growth Strategy?
-

 Bitcoin18 hours ago
What Good Friday Options Expiry Means for Bitcoin & Ethereum
-

 Market24 hours ago
Sui Meme Coins Surge With Rising DEX Volumes
-

 Altcoin23 hours ago
Analysts Predict XRP Price to Hit $6 as Wave 2 Correction Nears End
✓ Share: