
Ethereum
Did MicroStrategy Mess Up By Choosing Bitcoin Over Ethereum? Analyst Weighs In

Earlier today, the United States Securities and Exchange Commission (SEC) approved 19b-4 fillings for eight spot Ethereum exchange-traded funds (ETFs), paving the way for the highly anticipated institutional adoption of the second most valuable coin.
The decision comes after months of uncertainty and less than six months after the regulator approved spot Bitcoin ETFs. For all that the crypto community can remember this week, the regulator uncharacteristically “scrambled” and hastily communicated to spot ETF issuers to make amends to their applications.
Related Reading
Did MicroStrategy Make A Mistake Choosing Bitcoin Over Ethereum?
With spot Ethereum ETFs likely to be issued in the next few weeks, one analyst on X now thinks Michael Saylor, the former CEO of MicroStrategy, missed big rewards by choosing Bitcoin over Ethereum. As of May 24, MicroStrategy, a business intelligence firm and now one of the biggest public companies in the United States, has been increasing its BTC holdings over the years.
According to Bitcoin Treasuries, MicroStrategy is the largest public company holding BTC, controlling 214,400 BTC worth over $14 billion at press time.
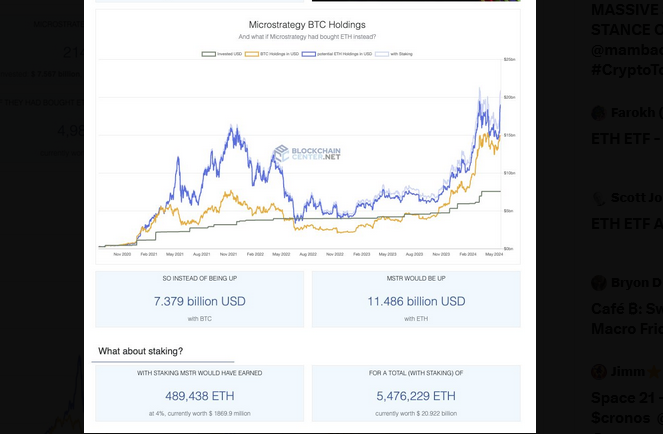
However, with the United States SEC setting the ball rolling for spot Ethereum ETFs, the analyst is now pointing out a hypothetical scenario. If MicroStrategy had chosen ETH over BTC, their holding would have been worth over $19 billion at spot rates.
This level means MicroStrategy would be up over $4 billion. Assuming the business intelligence firm had chosen to buy and not hold but stake, their total holdings would be worth over $20.9 billion as of late May 2024.
ETH Trading At A Huge Discount: Will It Replicate BTC’s Success?
Looking at the aftermath of the approval and trading of spot Bitcoin ETFs, it becomes apparent that Ethereum prices might be significantly undervalued at spot rates. After a brief dip in mid-January, BTC prices surged, propelling Ethereum to a high of $4,100. In contrast, the world’s most valuable coin soared to breach $70,000 and set all-time highs at around $74,000.
With 19b-4 forms from eight ETF issuers, including BlackRock and Fidelity, approved, the only hurdle is the approval of S-1 registration statements. There might be delays in this round. However, the United States SEC green lights, spot Ethereum ETF shares will begin trading.
Related Reading
Still, it is important to note that spot Ethereum ETF issuers will hold ETH via a regulated custodian and not stake.
Feature image from DALLE, chart from TradingView


Ethereum co-founder Vitalik Buterin has again made the news with a big donation to a Swiss project called Zuitzerland. Isla, a Web3 researcher developing the project, received the 274 ETH, equivalent to around $500,000, from Buterin, according to reports. The donation was identified by Onchain Lens, a blockchain monitoring site that tracks fund transfers.
This step is not surprising to anyone who has known about Buterin’s charitable activities and experimental associations. Zuitzerland is said to be a product of Buterin’s previous Zuzalu experiment, whose purpose was to unite like-minded people and engage into proposals on technology, longevity, and decentralized regimes.
Ethereum Donation: What Is Zuitzerland?
The Zuitzerland initiative is based on the ideas launched in the Zuzalu experiment, a short-term community project initiated by Buterin between March and May 2023, in Montenegro. Zuzalu assembled about 200 participants who worked and lived together for two months. They exchanged ideas and teamed up on projects together in workshops, discussions, and social gatherings.
Just in: Vitalik (@VitalikButerin) has sent 274.1 $ETH ($500k), as a grant or donation to a contract deployed by @0xisla, who is building @zuitzerland.
Vitalik’s Address: 0xd8da6bf26964af9d7eed9e03e53415d37aa96045
Contract Address: 0x69649512c97c630c4f06a21e09e71f0362ca74ec… pic.twitter.com/NusZDSp7tn
— Onchain Lens (@OnchainLens) April 1, 2025
Zuitzerland pushes this concept further by hosting residencies, hackathons, and citywide events for those with common interests. The platform emphasizes the development of collaboration between “thinkers and builders.” Although Buterin is not among the founders of the project, he is mentioned as a speaker and curator on its official site, indicating his support and engagement.

Funding Through Token Sales
Buterin’s contribution was partly financed by selling tokens he had earlier received as gifts from other crypto projects. According to on-chain statistics, Buterin sold 5,000 Dohrnii (DHN) tokens for $93,882 and 2 trillion LEDOG (DOG) tokens for $16,569 on March 31, 2025. The proceeds from these sales were aggregated and then sent as 274 ETH to Isla.
ETHUSD trading at $1,873 on the daily chart: TradingView.com
This is not the first time that Buterin has sold tokens gifted to him for a cause. In 2022, he sold some Shiba Inu (SHIB) tokens gifted to him in order to donate to an Indian COVID-19 relief fund. Buterin has also publicly urged token issuers to give directly to charities instead of donating tokens to him.
A History Of Token Donations
Dohrnii Labs, the developers of the DHN token, had sent 10,000 tokens to Buterin in January 2025. Likewise, LEDOG’s developers sent 10 trillion DOG tokens to him in August 2024. Although these tokens are usually given as a token of appreciation, they are also a marketing strategy for visibility. Buterin has been selling these tokens gradually over time, using the funds for donations and other things.
As of now, Buterin still retains 2 trillion DOG tokens, as per data on the blockchain. Nevertheless, his actions reveal a distinct orientation towards leveraging such assets to help initiatives such as Zuitzerland, which align with his belief in decentralized governance and innovation led by community.
Featured image from Gemini Imagen, chart from TradingView
Editorial Process for bitcoinist is centered on delivering thoroughly researched, accurate, and unbiased content. We uphold strict sourcing standards, and each page undergoes diligent review by our team of top technology experts and seasoned editors. This process ensures the integrity, relevance, and value of our content for our readers.

Reason to trust
![]()
Strict editorial policy that focuses on accuracy, relevance, and impartiality
Created by industry experts and meticulously reviewed
The highest standards in reporting and publishing
Strict editorial policy that focuses on accuracy, relevance, and impartiality
Morbi pretium leo et nisl aliquam mollis. Quisque arcu lorem, ultricies quis pellentesque nec, ullamcorper eu odio.
As Ethereum (ETH) continues to experience a significant price downturn, recording a 17% drop over the past month, key resistance levels have emerged as critical points for the second-largest cryptocurrency. Analysts suggest that these levels could ignite a potential trend reversal if reclaimed.
Ethereum Faces Potential Decline To $1,155
In a recent update shared on social media platform X (formerly Twitter), crypto analyst Ali Martinez highlighted two pivotal price points for Ethereum’s immediate future.
The first, set at $2,100, is seen as a necessary threshold for initiating a new upward trend. However, the $2,300 mark is regarded as a “more decisive” level that Ethereum must breach to confirm a bullish reversal.
Related Reading
Martinez’s analysis, based on the one-day chart seen below, indicates that if Ethereum fails to reclaim these levels, it may lead to a further decline.

The next target points to watch would be $1,600 and $1,155, levels that could indicate a new downtrend. Such a decline would represent additional losses of 12% and over 37%, respectively, marking a troubling continuation of Ethereum’s worst first quarter in its history.
In another post, the analyst also pointed out that the Ethereum price is facing a significant resistance wall between $2,200 and $2,580. On-chain data from the analytics firm IntoTheBlock reveals that approximately 12.43 million investors have bought about 66.18 million ETH within this price range.
A breakout above these levels could potentially generate bullish momentum for the cryptocurrency. However, bullish catalysts that could trigger a move above these levels remain scarce among experts.
ETH’s Largest Accumulation Zone Under Threat
Market intelligence firm Glassnode has indicated that ETH’s Cost Basis Distribution shows limited support near current prices. Weekly data suggests that addresses with a cost basis around $1,800 have not re-engaged. Many investors are reportedly selling at a loss, further adding to the current price uncertainty.
On March 28, several clusters of approximately 250,000 ETH with cost bases between $2,000 and $2,050 effectively vanished, indicating that some higher-cost holders are attempting to average down their positions.
However, Glassnode asserts that the overall Ethereum accumulation zone appears limited at current price levels, raising questions about future stabilization for the second largest cryptocurrency.
Related Reading
The largest accumulation zone below the current market price now sits at $1,537, where nearly 994,000 ETH was acquired. If the downtrend continues, this level is expected to serve as structural support in the near term, potentially providing a buffer against further declines.
ETH is currently trading at $1,830, down 12% for the week.
Featured image from DALL-E, chart from TradingView.com

A quant has revealed how Ethereum (ETH) saw a death cross in this indicator shortly before bearish momentum took the asset in full force.
Ethereum Formed A Death Cross In Funding Rates Earlier
In a CryptoQuant Quicktake post, an analyst has shared a chart for the Funding Rates of Ethereum. The “Funding Rates” refers to a metric that keeps track of the amount of periodic fee that traders on the derivatives market are exchanging between each other right now.
When the value of this indicator is positive, it means the long contract holders are paying a premium to the short investors in order to hold onto their positions. Such a trend suggests a bullish sentiment is shared by the majority of the derivatives traders.
On the other hand, the metric being under the zero mark implies a bearish mentality is dominant in the sector, as short holders are overwhelming the long ones.
Now, here is the chart for the Ethereum Funding Rates posted by the quant, which shows the trend in the 50-day and 200-day simple moving averages (SMAs) of the indicator over the last couple of years:

Looks like these two lines saw a crossover earlier in the year | Source: CryptoQuant
As displayed in the above graph, the 50-day SMA of the Ethereum Funding Rates crossed under the 200-day SMA in January of this year. This suggests that the optimism in the market witnessed a shift.
From the graph, it’s visible that since the crossover in the two SMAs of the indicator has emerged, the ETH price has been sharply moving down. The trend isn’t unique to the asset, as the wider cryptocurrency sector has also seen a similar pattern, with investors becoming risk-averse.
In the first half of last year, the Funding Rates observed the same type of crossover, and then, the Ethereum price followed up with a period of bearish action.
It wasn’t until the reverse crossover happened, with the 50-day SMA finding a break above the 200-day SMA, that bullish momentum returned in the cryptocurrency market. The same pattern was also seen back in 2023.
It’s possible that for constructive price action to return for Ethereum and other assets, a bullish crossover in the Funding Rates may once again have to take place. “When the speculators return and start using their greedy leverage, the crypto bull market will begin,” notes the analyst.
When this would happen, however, is anyone’s guess, as the 50-day and 200-day SMAs of the indicator are currently quite far apart. In 2024, the lines took many months before they crossed back, so it’s possible that it will take some time for the crossover to occur now as well.
ETH Price
Ethereum is moving to end the month of March on a red note as its price has fallen to the $1,800 level, after seeing a decline of almost 14% in the past week.
The trend in the ETH price over the last five days | Source: ETHUSDT on TradingView
Featured image from Dall-E, CryptoQuant.com, chart from TradingView.com
Editorial Process for bitcoinist is centered on delivering thoroughly researched, accurate, and unbiased content. We uphold strict sourcing standards, and each page undergoes diligent review by our team of top technology experts and seasoned editors. This process ensures the integrity, relevance, and value of our content for our readers.

Kraken Obtains Restricted Dealer Registration in Canada

Lummis Confirms Treasury Probes Direct Buys

Franklin Templeton Eyes Crypto ETP Launch In Europe After BlackRock & 21Shares

What’s Fueling The Shibarium Boost?

BNB Price Faces More Downside—Can Bulls Step In?

Tokenized Gold Market Cap Tops $1.2 Billion as Gold Prices Surge

2.52 Million Altcoins Are Ruining Crypto’s Future

Animoca Brands Valuation Tanks 75% In Two Years, Here’s Why

Crypto exchange BingX hacked for $43 million

Are The Big Players Losing Interest?

Hong Kong’s Securities Association Tips Authorities On Crypto Self-Regulation

Coinbase cbBTC Set to go Live on Solana
2.52 Million Altcoins Are Ruining Crypto’s Future
Animoca Brands Valuation Tanks 75% In Two Years, Here’s Why
Crypto exchange BingX hacked for $43 million
Are The Big Players Losing Interest?
Hong Kong’s Securities Association Tips Authorities On Crypto Self-Regulation
Coinbase cbBTC Set to go Live on Solana
-
 Altcoin24 hours ago
XRP Price to $27? Expert Predicts Exact Timeline for the Next Massive Surge
-

 Market22 hours ago
How Did UPCX Lose $70 Million in a UPC Hack?
-

 Market24 hours ago
Binance Megadrop Launches KernelDAO
-

 Market23 hours ago
Ethereum Struggles to Break Out as Bear Trend Fades
-

 Market21 hours ago
Hill Rejects Interest-Bearing Stablecoins Despite Armstrong’s Wish
-

 Bitcoin18 hours ago
Bitcoin Could Serve as Inflation Hedge or Tech Stock, Say Experts
-
 Market18 hours ago
SUI Price Stalls After Major $147 Million Token Unlock
-

 Market17 hours ago
BeInCrypto US Morning Briefing: Standard Chartered and Bitcoin