
Market
XRP Price Retraces After Failing To Clear $2.7, More Losses Ahead?
XRP attempt to break past the $2.7 resistance level has been met with strong selling pressure, forcing the price into a fresh decline. Its failure to sustain bullish momentum has shifted market sentiment, with bears seizing control and pushing the altcoin lower. As a result, traders are now eyeing key support levels to gauge the next move.
With technical indicators hinting at growing weakness, further losses risks remain high. If bearish pressure continues, XRP could see an extended drop, testing lower support zones. However, a swift recovery above critical levels could reignite bullish hopes and prevent a deeper correction.
Bears Take Control: XRP Move Toward Lower Support Levels
XRP’s upside run has lost momentum following a strong rejection at the critical $2.7 resistance level, shifting market control back into the hands of the bears. The inability to sustain an upward breakout has triggered increased selling pressure, forcing the price into a downward trajectory. With bearish sentiment strengthening, XRP is now edging closer to key support zones that might determine the next phase of price action.
Technical indicators provide additional confirmation of XRP’s bearish outlook, particularly the fact that the price is trading below the 100-day Simple Moving Average (SMA). The 100-day SMA is often viewed as a crucial long-term trend indicator, and when the price is consistently below this level, it suggests that the overall trend is weakening or shifting to a bearish phase.
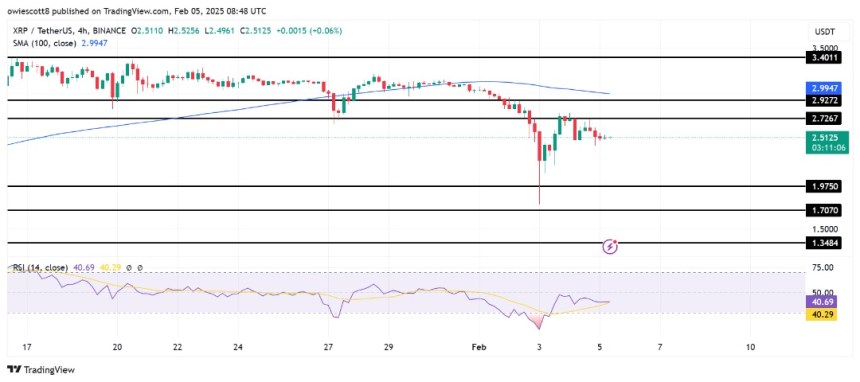
In conjunction with this, the RSI, which had been attempting to recover, has started to decline again after failing to reach the 50% threshold. This suggests that sellers are gaining the upper hand. If the downward trend continues, XRP could face a test of lower support zones, making the next few trading sessions crucial in determining its direction.
Key Support Levels To Watch If Selling Pressure Intensifies
As selling pressure intensifies, monitoring key support levels that could determine XRP’s next move has become crucial. The first significant level to watch is the $1.9 support zone, which has previously provided a cushion for the price during pullbacks.
A break below this level would signal an acceleration of the negative trend, leading to a test of the $1.7 mark, another critical support area. Should the price fall below $1.7, XRP may find itself in a deeper correction, potentially heading toward the $1.3 support region.
However, a surge in bulls’ strength from any of these key support levels would trigger the beginning of a possible reversal for the altcoin. A bounce from the $2.2 or $2.0 support zones might indicate that buyers are stepping in to defend these critical levels, providing enough strength to push the price back toward key resistance zones.


Africa’s crypto narrative is maturing from informal peer-to-peer (P2P) trading to institution-ready infrastructure. BeInCrypto contacted Luno, a crypto exchange headquartered in South Africa that operates across over 40 global markets.
Luno’s general manager for Africa and Europe, Marius Reitz, tells BeInCrypto how the crypto exchange is positioning itself as a regional powerhouse in Africa.
Luno As Africa’s Pragmatic Pioneer
Reitz started by revealing that Luno has outlived the boom-and-bust cycles that have come to define crypto since its establishment in 2013.
Its early focus on regulatory alignment and user-friendly experiences set it apart in an industry often plagued by volatility and regulatory whiplash.
In Africa, 57% of the population remains unbanked. Based on this, Luno’s mission goes beyond trading. The exchange crafts access to a modern financial system many have been locked out of.
“We’re driven by a bold vision to upgrade Africa and the world to a better financial system. After our launch in Kenya in 2024, we’re just getting started,” Reitz told BeInCrypto.
Stablecoin Surge and Real-World Demand
While much of the West obsesses over meme coins and ETF (exchange-traded fund) speculation, Africa’s crypto story is rooted in pragmatism.
In South Africa, stablecoins like Tether’s USDT have now surpassed Bitcoin in trading volume. According to Reitz, this surge is driven by the demand for inflation-resistant, dollar-pegged assets amid local currency devaluation.
Luno, already a major on-ramp for fiat-to-crypto conversions in the region, is adapting fast.
“Over the last 12 months, we’ve seen significant demand for stablecoins on Luno. We now offer low-cost USDT transfers across Ethereum and Tron, with competitive fees and bulk trade options for professionals via our Trade Desk,” Reitz shared.
Additionally, Luno’s retail-oriented Luno Pay app integrates crypto into everyday life. South African users can now spend USDT and USDC at thousands of merchants, earning crypto-back rewards.
Regulation as a Catalyst, Not a Constraint
Unlike many exchanges that shun regulatory scrutiny, Luno embraces it. In South Africa, where crypto assets are now classified as financial products by the FSCA, Luno has secured its operating license and helped shape its framework.
“Crypto bans force the industry underground. We’ve observed that markets with regulatory clarity foster responsible innovation and consumer protection,” he explained.
However, challenges remain. If misaligned with market realities, South Africa’s upcoming classification of crypto assets as foreign or domestic investments could hinder institutional flows.
Meanwhile, the FATF Travel Rule poses technical and operational hurdles due to fragmented provider ecosystems. Still, Luno is prepared.
“As a regulated business, we’ve implemented the Travel Rule in other jurisdictions. We anticipate friction, but we’re ready,” Reitz articulated.
The FATF Travel Rule is set to take effect in May 2025, barely a month away.
Adapting to Fragmented African Realities
Across the continent, crypto adoption is outpacing infrastructure. Nigeria ranked second globally for crypto adoption, but this remains paradoxical as the country restricts naira P2P trading while fast-tracking exchange approvals under its ARIP framework.
For Luno, this means taking a hyper-local approach to compliance, education, and user experience.
“Africa faces significant challenges: regulatory fragmentation, limited banking infrastructure, and crypto-related scams. We address these with educational content, strong KYC/AML, and strong banking partnerships,” Reitz explained.
Mobile money is dominant in countries like Kenya and Nigeria. Luno’s mobile-native design and stablecoin access offer a compelling value proposition for both retail users and remittance providers.
Financial Inclusion, One Partnership at a Time
Beyond individual users, Luno is also becoming a key partner for fintechs and payment firms. Its custody and liquidity services now support cross-border on- and off-ramping for traditional and crypto-native partners.
“We receive inquiries from large multinationals wanting to shift part of their payments to crypto. Our infrastructure allows them to do so securely, compliantly, and efficiently Luno confirmed,” Reitz stated.
This is pivotal for Africa’s $48 billion annual remittance market, where stablecoins offer faster, cheaper alternatives to legacy systems.
What does the next five years look like for African crypto markets? For Luno, it’s a convergence of retail empowerment and institutional maturity.
“We expect crypto to become as ubiquitous as banks—used to save, invest, and transact. Stablecoins will anchor trade settlements, while ETFs and bank-based crypto products will dominate mature markets like South Africa,” the Luno executive told BeInCrypto.
Luno is already laying the groundwork. Its Trade Desk, custody solutions, and upcoming stablecoin expansions suggest an exchange ready to grow from a user-friendly app to an institutional-grade platform.
In a region often overlooked by global players, Luno’s longevity is compelling. While challenges around regulation and infrastructure persist, its blend of compliance, innovation, and education positions it among notable actors in Africa’s crypto arena.
Disclaimer
In adherence to the Trust Project guidelines, BeInCrypto is committed to unbiased, transparent reporting. This news article aims to provide accurate, timely information. However, readers are advised to verify facts independently and consult with a professional before making any decisions based on this content. Please note that our Terms and Conditions, Privacy Policy, and Disclaimers have been updated.

FARTCOIN has been one of the standout performers in the meme coin space, with its price soaring nearly 250% over the last 30 days. After weeks of consistent gains, the token is now trading just below a key resistance level as technical indicators continue to support the bullish trend.
Momentum remains strong, with on-chain metrics and chart patterns signaling that buyers are firmly in control. However, with such rapid gains, the risk of a sharp correction is also rising—making the coming days crucial for FARTCOIN’s next move.
FARTCOIN DMI Shows Buyers Are In Full Control
FARTCOIN’s DMI chart shows a strong surge in trend strength, with the ADX rising from 22.3 to 39.93 over the past two days.
The Average Directional Index (ADX) measures the strength of a trend, regardless of direction—readings above 25 signal a strong trend, while anything below 20 suggests a weak or nonexistent one.
FARTCOIN’s current ADX level indicates that a powerful trend is now firmly in place.
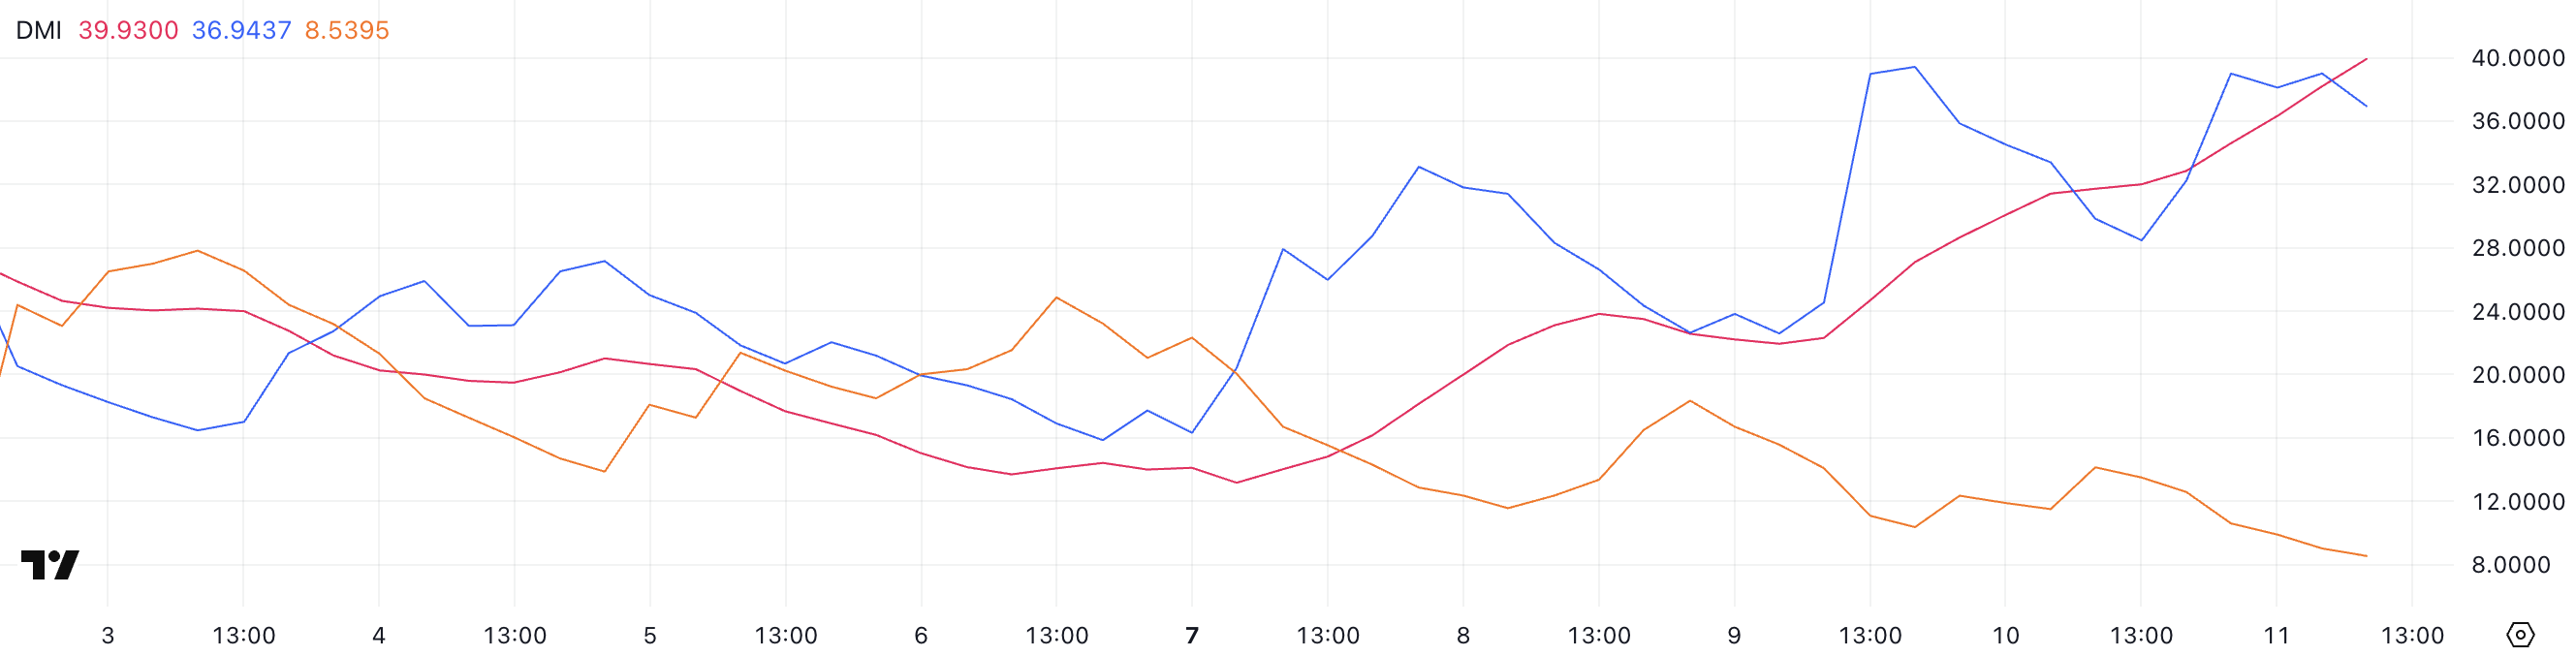
Looking at the directional indicators, the +DI climbed to 36.94 from 28.46 yesterday, recovering after a brief dip from 39.43 two days ago.
Meanwhile, the -DI has dropped further to 8.53 from 14.14, showing that bearish pressure continues to fade.
This widening gap between +DI and -DI, combined with a rising ADX, signals strong bullish momentum, suggesting that FARTCOIN’s price could continue climbing if the current trend holds.
FARTCOIN Ichimoku Cloud Shows A Bullish Setup
FARTCOIN’s Ichimoku Cloud chart is currently showing a strong bullish setup. With its market cap close to $900 million, it is the biggest meme coin ever launched on PumpFun.
The price action is well above both the Tenkan-sen (blue line) and Kijun-sen (red line), which are also trending upward—an indication of solid short-term momentum.
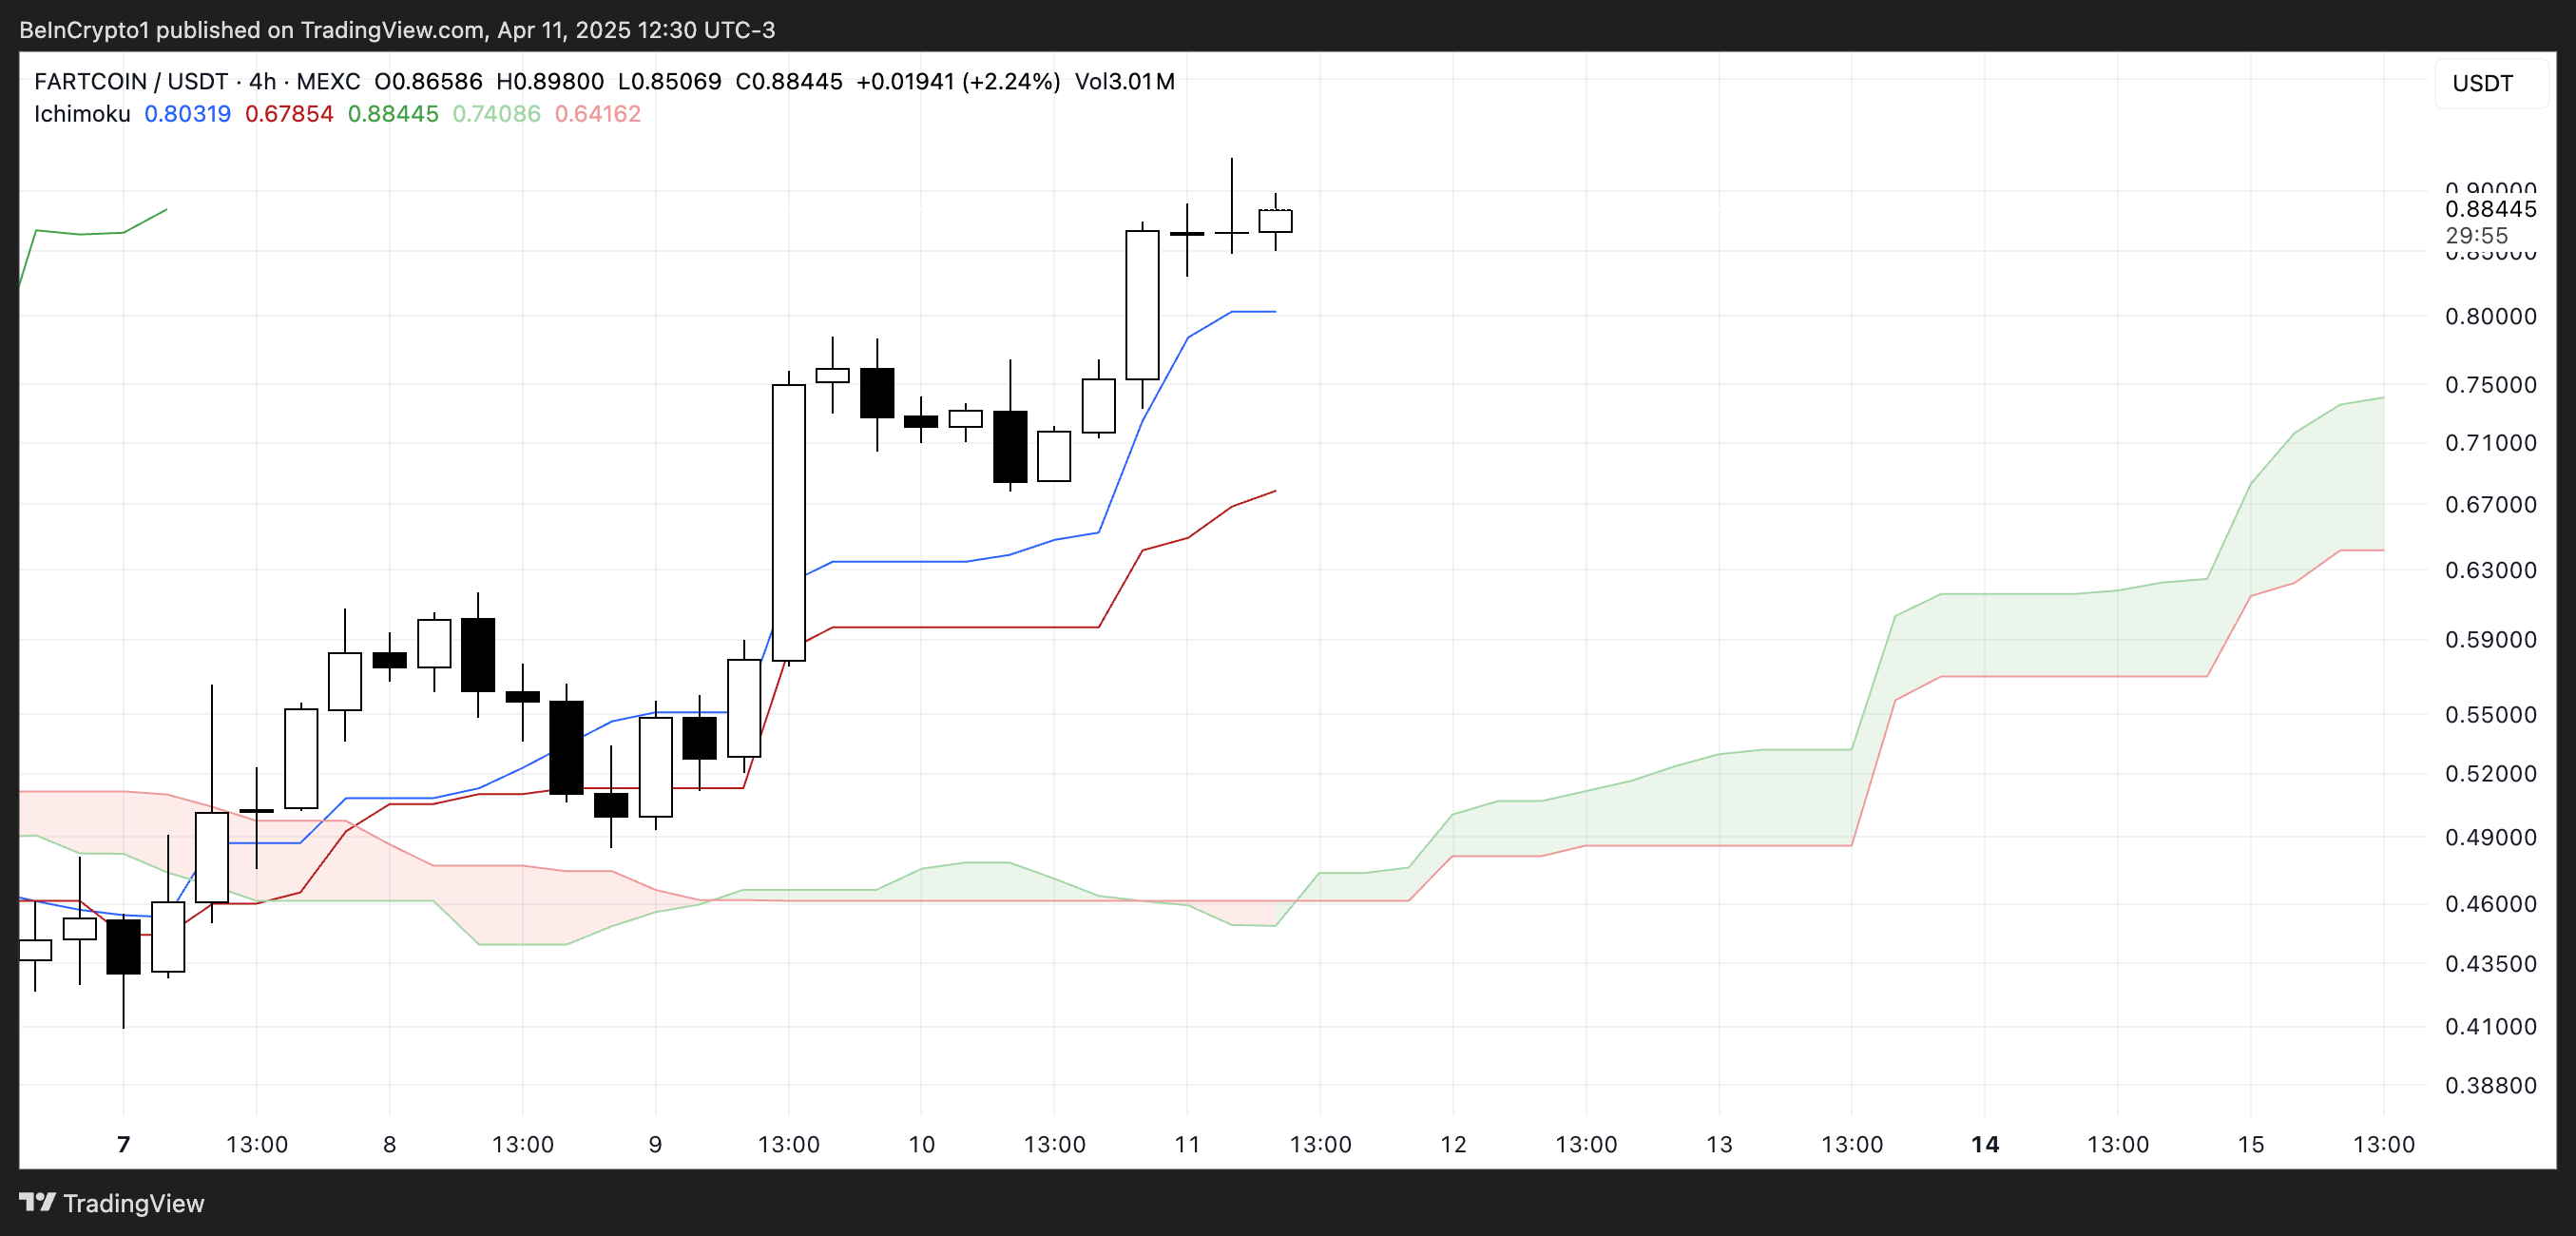
The cloud (Kumo) ahead is thick and green, with Leading Span A well above Leading Span B. This suggests strong support for the ongoing uptrend.
Additionally, the wide distance between the price and the cloud base reinforces the strength of the current bullish momentum. Unless a sharp reversal occurs, the trend remains clearly in favor of the bulls.
Will FARTCOIN Break Above $1?
FARTCOIN’s price chart currently displays a bullish EMA structure, with short-term moving averages positioned above long-term ones—indicating that momentum remains in favor of the bulls.
The price is now approaching a critical resistance of around $0.90. If this level is successfully broken, the uptrend could accelerate further, with price targets at $1.29 and $1.99 coming into view.
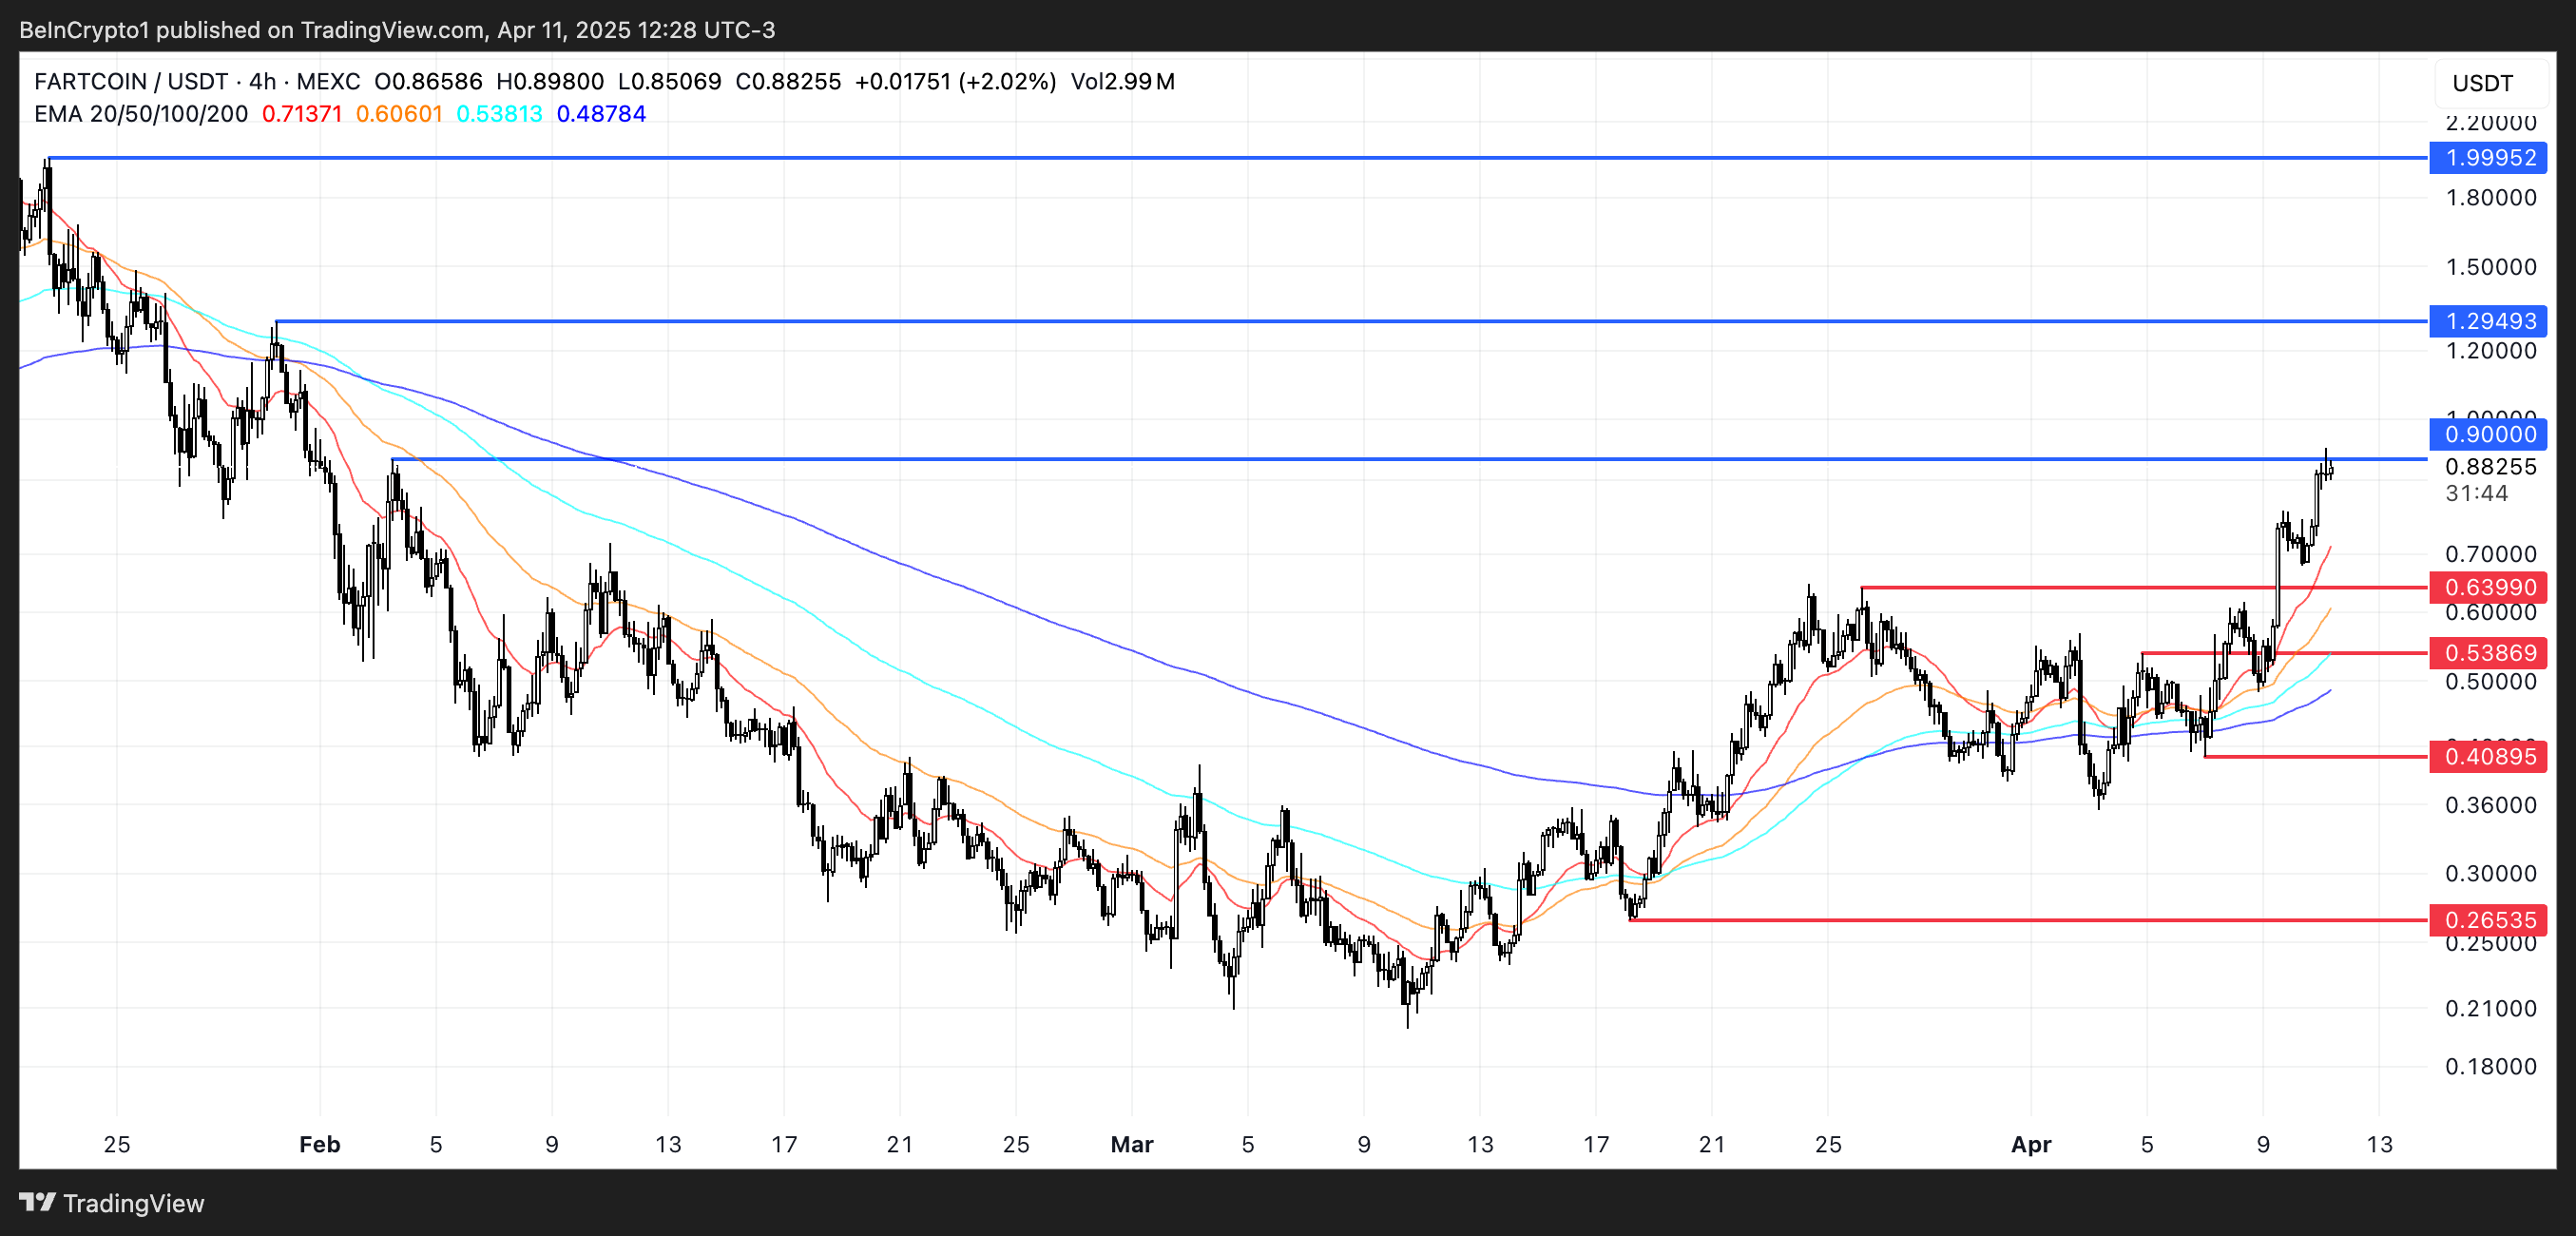
On the flip side, if the current momentum stalls and buyers lose control, the meme coin may begin to retrace. The first support to watch lies at $0.639.
A drop below this level could trigger a deeper correction toward $0.538 and $0.408. If that final support also fails and bearish pressure strengthens, the price could fall as low as $0.26—marking a full reversal of the recent rally.
Disclaimer
In line with the Trust Project guidelines, this price analysis article is for informational purposes only and should not be considered financial or investment advice. BeInCrypto is committed to accurate, unbiased reporting, but market conditions are subject to change without notice. Always conduct your own research and consult with a professional before making any financial decisions. Please note that our Terms and Conditions, Privacy Policy, and Disclaimers have been updated.

BeInCrypto had the opportunity to sit down with Ilya Volkov, CEO and co-founder of YouHodler, a Swiss and EU-based Crypto FinTech company. YouHodler gained recognition for its crypto lending, borrowing, and yield services, which cater to users looking to amplify their idle crypto holdings for various trading strategies.
During our conversation at the Web3 Banking Symposium in Lugano, Volkov shared his philosophy behind building a lean, self-sustaining company in the crypto space, as well as his thoughts on the future of blockchain and crypto’s role in traditional financial systems. From the challenges of integrating decentralized finance (DeFi) with legacy banking structures to how YouHodler is pushing the envelope with new technologies, this interview offers valuable insights into one of the industry’s most dynamic leaders.
Ilya Volkov on Building YouHodler Without External Funding: How Personal Values and Beliefs Shaped the Journey
It was always on my mind and the minds of my partners that we needed to use a lean approach. The benefit of this approach is actually very simple. If you focus on a lean approach, you focus on efficiency.
That means you build products that will be welcomed by your customers, and customers will vote with money for your products.
When you compare this approach to others in the space, especially between 2017–2018, the contrast is clear. Many companies raised large sums of money through ICOs, and while not all of them wasted or misused those funds, a significant number did. It was easy money and just as easy to spend.
So the money was invested in questionable marketing channels and all sorts of influencers, and very rarely did money go to real product development.
And again, the key thing is that many companies that raised a lot of easy funds were not focused on product development. They were focused on being proud of themselves, and that’s why many of them failed.
Again, disclaimer, not all of them failed, but enough to make the point. So this is the benefit of running your company with a focus on efficiency and focus on the quality of your products.
There are two downsides, actually. So the first one is that if, like, in a few months after the launch of your company, you have tens of millions of money raised through ICO or some VCs. Of course, you can immediately invest in everything, including marketing, which is very important. Marketing is very expensive in the digital area.
Actually, it’s interesting that nowadays, digital channels are more expensive compared to traditional, offline channels, and smart companies who raised a lot of money got a big push in the beginning. I would not mention names, but I believe you know some good examples of companies that raised tens of millions through ICOs, and now they’re quite good, and they keep, keep working. I can only say bravo to them. So the first benefit for them is a quick good start.
The second benefit of having external support, particularly when collaborating with top-tier VCs rather than through ICOs, is access to real expertise. When you work with highly professional, VC-focused businesses, you have some additional expertise. I can list a few VCs like a16z. They are very smart guys with their own focus on efficiency.
So, if you work with professionals like them, you get the benefit of accessing a knowledge base and a good selection of market expertise. But of course, you can also lose your freedom.
After years of hard work, I think we still have a chance to start working with some smart partners. But on another level, we are not a startup anymore. We are maybe more than scaled up. And yeah, we are open to working with smart, strategic investors. But again, the key benefit still is that you have your focus on the quality of products, and you have your focus on your customers who are paying money for real value, not just hype or empty tokens.
Promising Crypto Technologies and YouHodler’s Role in Shaping the Future of Blockchain
There are many different kinds of dimensions and different kinds of use cases in our space. So, investments in trading, payments, and stores of value, right? As for investments and trading, we focus on listing all valuable coins and tokens for buying, selling, lending/borrowing, and trading. Our market department is always keeping up with the markets, with all the trends.
Of course, we have all the classics, and we are following with something new, like the most recent example is the TRUMP coin. We monitored closely what was happening on the market, and we released the Trump token within 24 hours after the announcement of Trump. We got a lot of appreciation from our customers because they were happy to trade with it.
There are a lot of questions about the future of tokens like TRUMP, but anyway, it is something very interesting and very engaging for customers. So, strategically thinking, I believe that we will have not just cryptocurrencies on our platform but also some traditional assets in the mid-term future based on partnerships with other financial institutions.
So, we are crypto native, but we are partnering with traditional institutions. And actually, the event – Web3 Banking Symposium in Lugano, where we’re speaking is a good illustration of collaborations, of crypto and traditional institutions. So, we will keep adding crypto and even some traditional instruments to the trading and investment part. This is number one; number two for our strategic focus is payments.
We invest a lot in all wallet and payment infrastructure for applications. With us, you can get your dedicated bank account opened in your name inside the platform. Of course, we rely on our banking partners to provide the service. You can link your cards, Visa and MasterCard, you can easily top up and withdraw with just one click, and you have your money on your card, to pay your bills, buy groceries, and all those kinds of every-day things.
We are at the final, I would say, stage of releasing our own card, a YouHodler branded card. To simplify the user experience even more, of course, we have all kinds of banking protocols integrated into the platform. We do all that in order to support a 360-degree approach for payment around crypto.
Also, we are investing in some new features. And I’m so happy that we are one of the first members of the Universal Money Address (UMA) network built on Lightspark in Europe and Switzerland. This is an amazing feature. I can give you a few hints.
Lightspark is a company that was created by tier-one entrepreneurs from companies like PayPal, and Facebook. David Marcos, Lightspark’s founder and CEO, is PayPal’s former president and Meta’s ex-Top Manager. He brought into Lightspark his expertise in building PayPal and Facebook’s payment solutions.
Do you remember the famous story of Libra and Diem? They learned a lot from it. So, they launched Universal Money or UMA. This is similar to PayPal, but it’s the next level. It’s a simple, human-readable address, similar to email, but connected to any form of money – crypto or fiat. You can send any money and in a matter of seconds, your recipient will get his or her preferred currency.
So, with us, you can use this address for crypto, any crypto, and Fiat. You can use Euro, Dollars, British pounds, and pesos. If you’d like to send money to someone else, you simply ask your mate about his or her address.
And on your side, let’s say you sent Euro. But on their side, if they’re, let’s say, in the United States, they receive USD. And the beauty is that in the US, they can even receive it in USD, literally to their bank account in any bank in the United States.
And it works with different countries. So we are taking care of Switzerland and the European Union, and other members of the network take care of other countries. We have partners in Argentina, the Philippines, and Turkey.
When you send money, for instance euro on our side, it’s being converted instantly to Bitcoin. It’s being transferred using Bitcoin Lightning Network, and on the partner side, US, Argentina, whatever, it’s been converted to local currency immediately inside the platform.
So you don’t need SWIFT or protocols, any other bank protocols. You don’t need any kind of other payment trails. You don’t even need stablecoins because Bitcoin is used as a payment rail here.
And because of the Lightning network, it happens just in a matter of milliseconds and seconds. The average time for the transaction is three seconds. Sounds amazing, and we have it, and it works.
We are now running some testing campaigns like we’re targeting, for example, communities of Filipinos working in Europe. Nowadays, they’re transferring money using Western Union, or Wise which is obviously expensive.
We tell them, like, use us on the European side. Three seconds, a small commission, and that’s it. So this is just an illustration of how dedicated we are to the pushing of, you know, boundaries of the technology with again, a focus on key values for the end user.
YouHodler CEO on Ripple and Cross Border Payments
Back in 2016 or 2017, I was a big fan of Ripple’s idea. It was to challenge SWIFT, right, and I loved it. The question is, did they manage to challenge SWIFT after all these years?
I don’t think so. Instead, we have stablecoins, Circle, and Tether, which are basically dealing with the same issue. We even have UMA targeting the idea of cross-border payments.
Coming back to a question about our contribution to that point, we also actively participate in the development of the entire industry.
The market is so big. Instead of competing and fighting with someone, it’s better to partner. And that’s why we are trying to bring together different companies, even from different sites.
Three years ago, when I said I wanted to connect banks and crypto companies, people thought I was crazy. They told me it would never happen. But It’s happening now.
Bridging the Gap Between Web3 Anonymity and Traditional Finance’s Regulatory Demands
There are two aspects. One is about anonymity and the oldest point of KYC and AML practices. Another is self-custody. Let’s touch base on both.
So, as for KYC, I think when we speak about just common people, regular people, average people, like we are. It’s not a problem, actually. So I don’t see any issues.
And we have, believe me, a huge experience with the KYC processes and tools. So we’re speaking about 1,000s of people coming every day. We don’t see any issues with the common people, as soon as you have really good UI, so if you have a good solution to upload and process your documents, to make selfies and all those kinds of things, it’s not a problem.
The problem appears with bad actors who are trying to trick the system. And it’s not just about big fraud cases, but it’s also about some small frauds, like card fraud, for example. Believe me; there are a lot of fraud cases happening every day everywhere, like millions on the market with stolen cards, fake identities, and all these kinds of things.
If you compare the value of protection and defense from fraud with the complexity of KYC. And if you look from the angle of the typical middle class, KYC is not a problem.
But again, we should focus, and we’re focusing a lot on simplification of the UI/UX of our app. So, of course, there is another point connected to KYC and AML, which is taxes again.
So it’s not just about Web3. People have always looked for ways to optimize taxes. If it’s done legally, no problem. If it’s done illegally, that’s not okay.
And this is, again, not about the trick of crypto. This is about the situation in general. My point is that crypto is not a way to trick taxation, not at all. If anything, cash is still the easiest way to stay off the radar, right?
My short answer is that anonymity is not a problem, actually, especially when you have polished user interfaces.
When we speak about self-custody, it’s very interesting because our analysis shows that there are two big groups of users: someone who would like to manage keys and someone who would like to have someone taking care of it. Again, like with traditional banks, you’re relaxed because you know that if you forget your password, you can call customer support or visit the branch, and it will be fixed.
So the same behavior we see on the crypto side, which is fine, so as soon as the service provider is trustworthy, it’s totally fine. That’s why it’s important to have regulated service providers who are serving you with these kinds of things. Not everyone in this world can take care of themselves, right?
So that’s why centralized institutions are still needed, but of course, there are users who would like to manage their own assets themselves with noncustodial approach, which is totally fine, and actually, we’re following up with this approach. We started as a centralized institution.
Now, we are integrating Web3 connectors and wallet connects. It’s not live on the platform yet, but it will be available soon, very soon. The idea here is very simple. We’d like to combine both sides.
So, if you’d like to still use your ledger, hardware device, or even MetaMask, that’s fine, but at some point, you need to get a loan, or at some point, you need to convert your Bitcoin to local currency.
We provide you with an easy plugin. Click the button, and you link your wallet to our application where you can pledge crypto and get a loan, or you can easily top up your Visa or MasterCard. So we are now testing the connector, and it’s quite promising and by that, I think we will satisfy both groups of people who don’t want to take care of their keys and people who’d like to manage keys by themselves.
YouHodler’s Approach to Balancing Crypto Anonymity with Traditional Financial Regulations
I can go deeper because, actually, it’s a very interesting question, again. So, you know, it’s like you have always acted fast, to stay compliant with all regulations In some cases, they’re professional. In some cases, they’re following different goals.
Just to give you an idea, just in parallel, with our interview, there is a PwC keynote happening on the stage of the Web3 Banking Symposium , and they’re speaking now about CARF (Crypto-Asset Reporting Framework).
It is a new crypto asset reporting standard that is going to be implemented in the European Union in 2026. So that means that, like, now we have to be compliant with MiCA regulation, and we are at, like, final stages of dealing with MiCA and DORA, and now regulators dropped CARF, so you always have to invest a lot following up with this, all these kind of things.
So, the short answer to your question is that it’s not about finding a perfect balance because you have always kept your systems up to date.
We have our head office in Switzerland. We have several authorizations and licenses in the European Union.
Also, we are fully committed to MiCA compliance and have invested a lot in this MiCA approach. Our European team is growing. We have some extensions, for example, we have our authorization in Argentina to work with Latin American markets. And, of course, we have some plans for other markets.
Even with frameworks like MiCA, you still need to follow up with different regions, and we do that. And it’s not easy. But this is the reality, right?
How Increasing Blockchain Regulations are Shaping YouHodler’s Future and the Crypto Industry
In the morning, at the Symposium, I presented one slide with simple charts like the complexity of regulations and their importance for the economy. And we see that countries are trying to find their place there and trying to compete, compete with each other.
Let’s take the US, as an example.
A year ago, we saw an absolutively restrictive, crazy environment, with a lot of lawsuits. But, the financial sector, the financial technology sector, and the banking sector were always very important to the US.
The Trump administration is trying to deregulate the industry to support the importance of the industry. But at the same time, the European Union decided to take a heavy approach to regulation with MiCA.
So, I was saying that different regions and different countries are trying to find a way to regulate crypto. Some are trying to deregulate and simplify in order to increase value for the economy. Others are trying to regulate to defend end users heavily.
We are in Switzerland, and Switzerland is always smart in finding a balance, and so far, it’s balanced, and I hope it will be balanced the same way in the future.
Of course, maybe blockchain won’t go back to the way it was 10 years ago, the Wild West days of total freedom. But this is always how every industry evolves.
Especially when we speak about financial markets. Can you name me any of the financial products without regulation? No, and it was always like that, like credit cards.
You remember before, credit cards were based on paper slips. It was not really regulated, and that’s why they were a lot of fraud, right? Then regulation came in, fraud went down, and yet we still use cards today. It’s just the natural evolution of any major financial product. And that brings me back to my previous point.
So when we speak about regular users, not bad actors, this is fine as soon as UI is good, but UI is going to be good just because we have a lot of side tools, even ChatGPT, we just mentioned, right? AI is helping to simplify interfaces. AI is helping to interact with different systems.
Plus, I believe there is one that will have some digital identities. There will be no need to resubmit your KYC on every single platform. So, again, back to your question. Yes, it will not be the same as before, with no Wild West, but still, it will be quite fine for the absolute majority of users, and the companies will be focusing on the simplicity of UI.
Ilya Volkov Discusses How Crypto is Transforming Traditional Finance (TradFi) and What the Future Holds
As you can see, we already have a lot of traditional banks actively working in the crypto space. I just brought this example today on stage. At the last year’s Symposium was an example from one of the oldest state-owned Swiss banks, one of the Swiss Cantonal Banks, with around 200 years of history.
They’ve decided to introduce crypto because they have two groups of customers, the wealthy traditional customers and the young and adventurous customers, and they said that wealthy traditional customers have already invested in everything.
So they invested in gold, they invested in different kinds of commodities. They already bought Tesla stocks, Apple stocks, and Google stocks, all high-tech things, and now they’re demanding crypto because it’s clear that it’s the next step.
And the bank told us that it was clear that had they not introduced crypto, they would have lost the traditional audience that had been banking with them for the last 200 years,
On the other side, young customers.
They were saying that it’s clear that if they do not offer their young customers crypto, they will simply not come. So this is the best explanation of why traditional institutions are joining the crypto space.
One can say that it will increase competition for companies like us, but I would say no, because it brings more opportunities for partnerships. FinTech companies are always one step ahead, as we are exploring some new horizons, and we can create something new that is later on being adopted by traditional institutions. Such collaboration is absolutely fine.
As I said, blockchain may not be the Wild Wild West anymore, but there will still be something new because companies like us are always working on pushing the boundaries. So, it’s a constant evolution process.
Disclaimer
In compliance with the Trust Project guidelines, this opinion article presents the author’s perspective and may not necessarily reflect the views of BeInCrypto. BeInCrypto remains committed to transparent reporting and upholding the highest standards of journalism. Readers are advised to verify information independently and consult with a professional before making decisions based on this content. Please note that our Terms and Conditions, Privacy Policy, and Disclaimers have been updated.
Dogecoin Price Gearing for A 3X Rally Amid DOGE Whale Accumulation

SEC Abandons Case Against Nova Labs

How Luno is Shaping Africa’s Crypto Future

Ethereum’s True Value? Lower Than You Think

FARTCOIN Soars 250%—Can It Break $1 Soon?

YouHodler CEO Talks DeFi, Crypto Lending, and Web3 Innovations

2.52 Million Altcoins Are Ruining Crypto’s Future

Animoca Brands Valuation Tanks 75% In Two Years, Here’s Why

Crypto exchange BingX hacked for $43 million

Are The Big Players Losing Interest?

Hong Kong’s Securities Association Tips Authorities On Crypto Self-Regulation

Coinbase cbBTC Set to go Live on Solana
2.52 Million Altcoins Are Ruining Crypto’s Future
Animoca Brands Valuation Tanks 75% In Two Years, Here’s Why
Crypto exchange BingX hacked for $43 million
Are The Big Players Losing Interest?
Hong Kong’s Securities Association Tips Authorities On Crypto Self-Regulation
Coinbase cbBTC Set to go Live on Solana
-

 Market20 hours ago
HBAR Buyers Fuel Surge with Golden Cross, Suggesting Upside
-

 Market19 hours ago
China Raises Tariffs on US to 125%, Crypto Markets Steady
-

 Market23 hours ago
BNB Price Recovery in Motion—Uphill Battle Ahead Near Crucial $600 Level
-

 Market22 hours ago
How Vitalik Buterin Plans to Enhance Ethereum’s Privacy
-
 Market21 hours ago
MiCA Boosts Gemini’s Expansion Plans Across Europe
-

 Market14 hours ago
3 Altcoins to Watch for Binance Listing This April
-
 Altcoin21 hours ago
6.96 Billion Dogecoin In 24 Hours As DOGE Price Adds 1%
-

 Altcoin20 hours ago
Sonic Surges to $1 Billion TVL in 66 Days Amid DeFi Market Slump