
Market
XRP Price Eyes Fresh Upside: Can Bulls Deliver?

Aayush Jindal, a luminary in the world of financial markets, whose expertise spans over 15 illustrious years in the realms of Forex and cryptocurrency trading. Renowned for his unparalleled proficiency in providing technical analysis, Aayush is a trusted advisor and senior market expert to investors worldwide, guiding them through the intricate landscapes of modern finance with his keen insights and astute chart analysis.
From a young age, Aayush exhibited a natural aptitude for deciphering complex systems and unraveling patterns. Fueled by an insatiable curiosity for understanding market dynamics, he embarked on a journey that would lead him to become one of the foremost authorities in the fields of Forex and crypto trading. With a meticulous eye for detail and an unwavering commitment to excellence, Aayush honed his craft over the years, mastering the art of technical analysis and chart interpretation.
As a software engineer, Aayush harnesses the power of technology to optimize trading strategies and develop innovative solutions for navigating the volatile waters of financial markets. His background in software engineering has equipped him with a unique skill set, enabling him to leverage cutting-edge tools and algorithms to gain a competitive edge in an ever-evolving landscape.
In addition to his roles in finance and technology, Aayush serves as the director of a prestigious IT company, where he spearheads initiatives aimed at driving digital innovation and transformation. Under his visionary leadership, the company has flourished, cementing its position as a leader in the tech industry and paving the way for groundbreaking advancements in software development and IT solutions.
Despite his demanding professional commitments, Aayush is a firm believer in the importance of work-life balance. An avid traveler and adventurer, he finds solace in exploring new destinations, immersing himself in different cultures, and forging lasting memories along the way. Whether he’s trekking through the Himalayas, diving in the azure waters of the Maldives, or experiencing the vibrant energy of bustling metropolises, Aayush embraces every opportunity to broaden his horizons and create unforgettable experiences.
Aayush’s journey to success is marked by a relentless pursuit of excellence and a steadfast commitment to continuous learning and growth. His academic achievements are a testament to his dedication and passion for excellence, having completed his software engineering with honors and excelling in every department.
At his core, Aayush is driven by a profound passion for analyzing markets and uncovering profitable opportunities amidst volatility. Whether he’s poring over price charts, identifying key support and resistance levels, or providing insightful analysis to his clients and followers, Aayush’s unwavering dedication to his craft sets him apart as a true industry leader and a beacon of inspiration to aspiring traders around the globe.
In a world where uncertainty reigns supreme, Aayush Jindal stands as a guiding light, illuminating the path to financial success with his unparalleled expertise, unwavering integrity, and boundless enthusiasm for the markets.


In Q1 2025, Ethereum solidified its leading position in the decentralized application (DApp) platform sector, generating $1.021 billion in fee revenue.
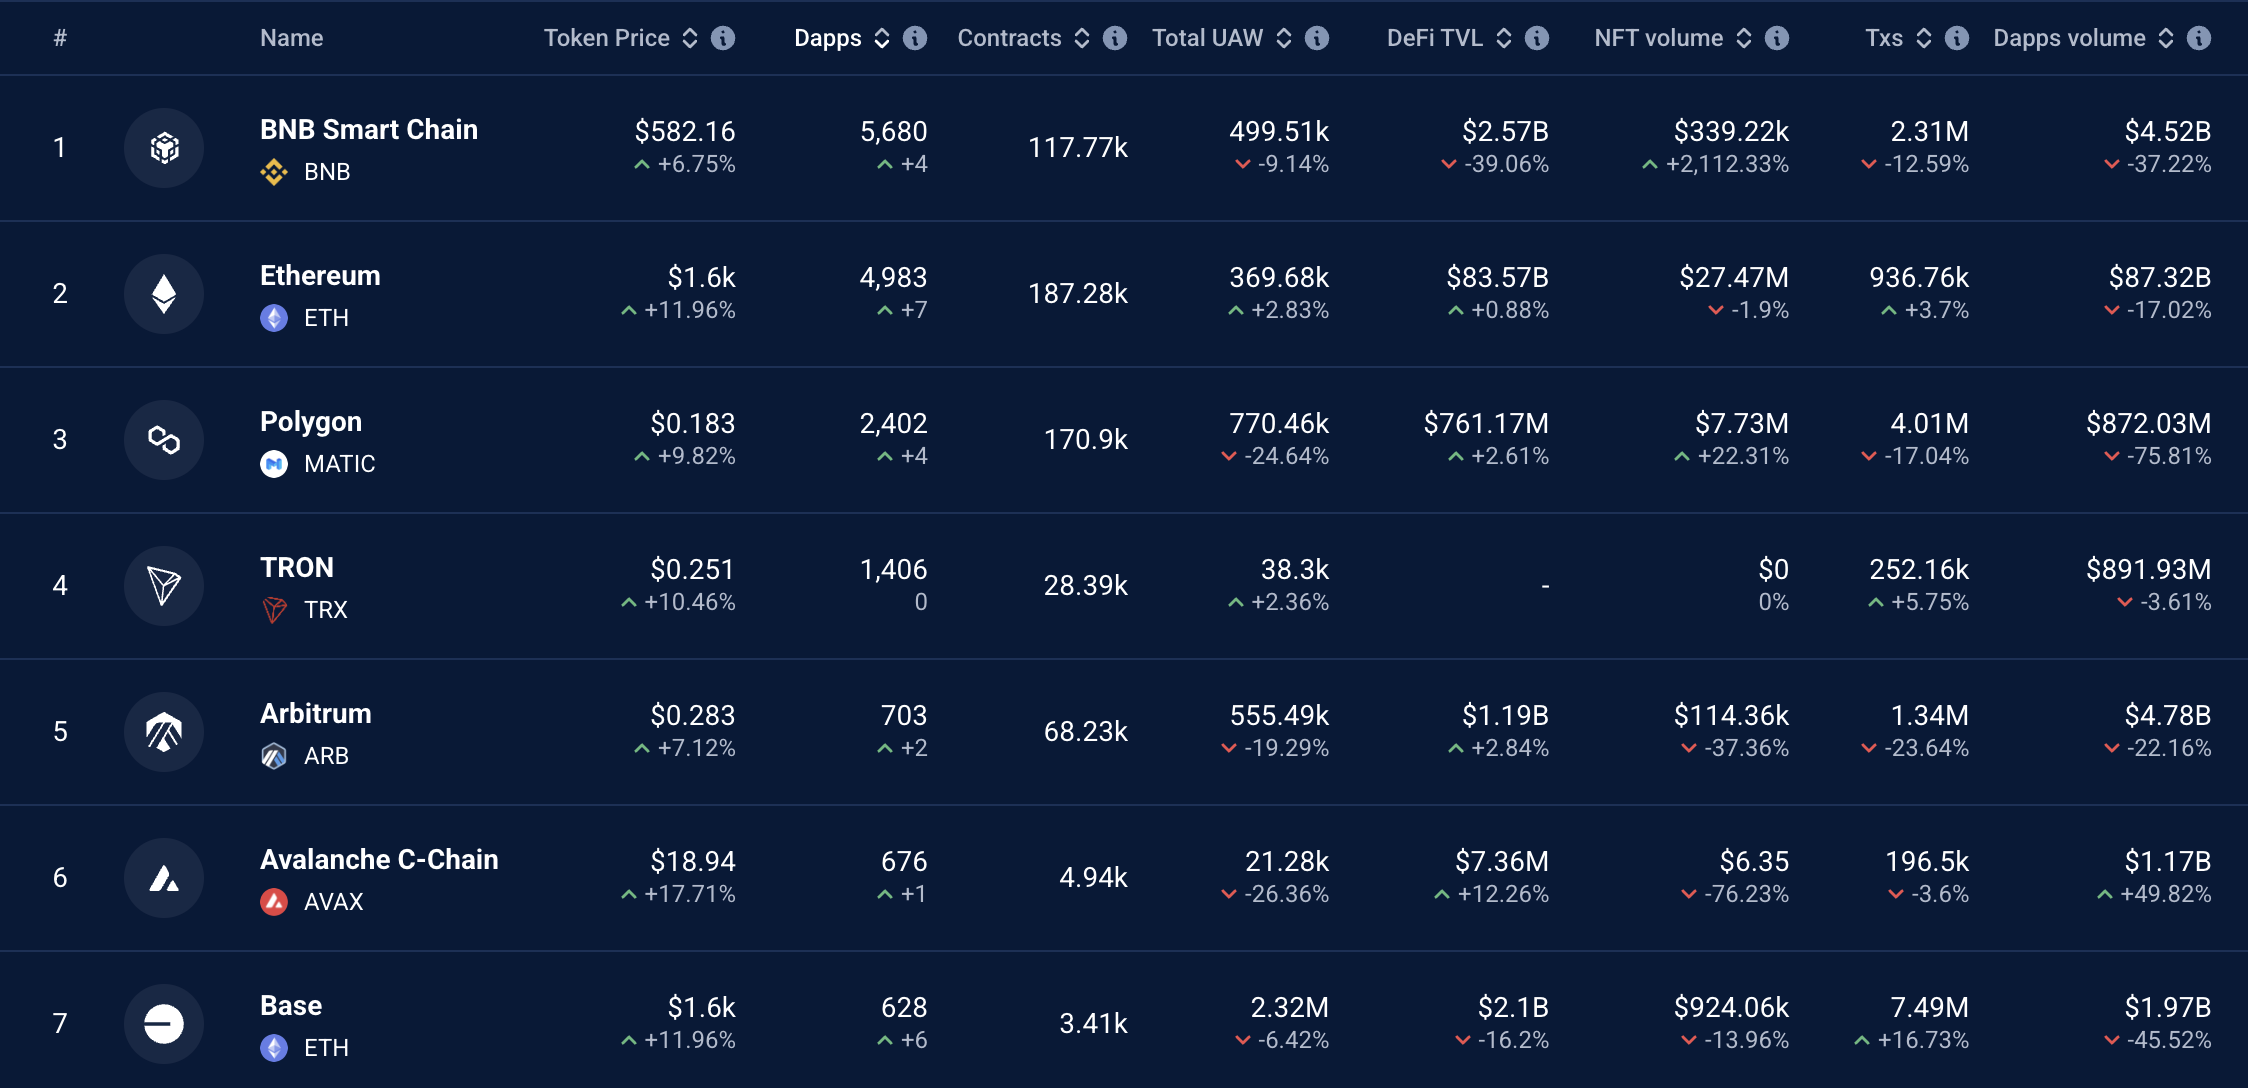
Other networks such as Base (Coinbase’s Layer-2), BNB Chain, Arbitrum, and Avalanche C-Chain also recorded significant revenue but lagged far behind Ethereum.
Fee Revenue Landscape Among Blockchains
According to Token Terminal, Ethereum maintained its top position among DApp platforms, with DApp fee revenue reaching $1.021 billion in Q1 2025. This figure highlights Ethereum’s dominance and strong growth within the DApp ecosystem.

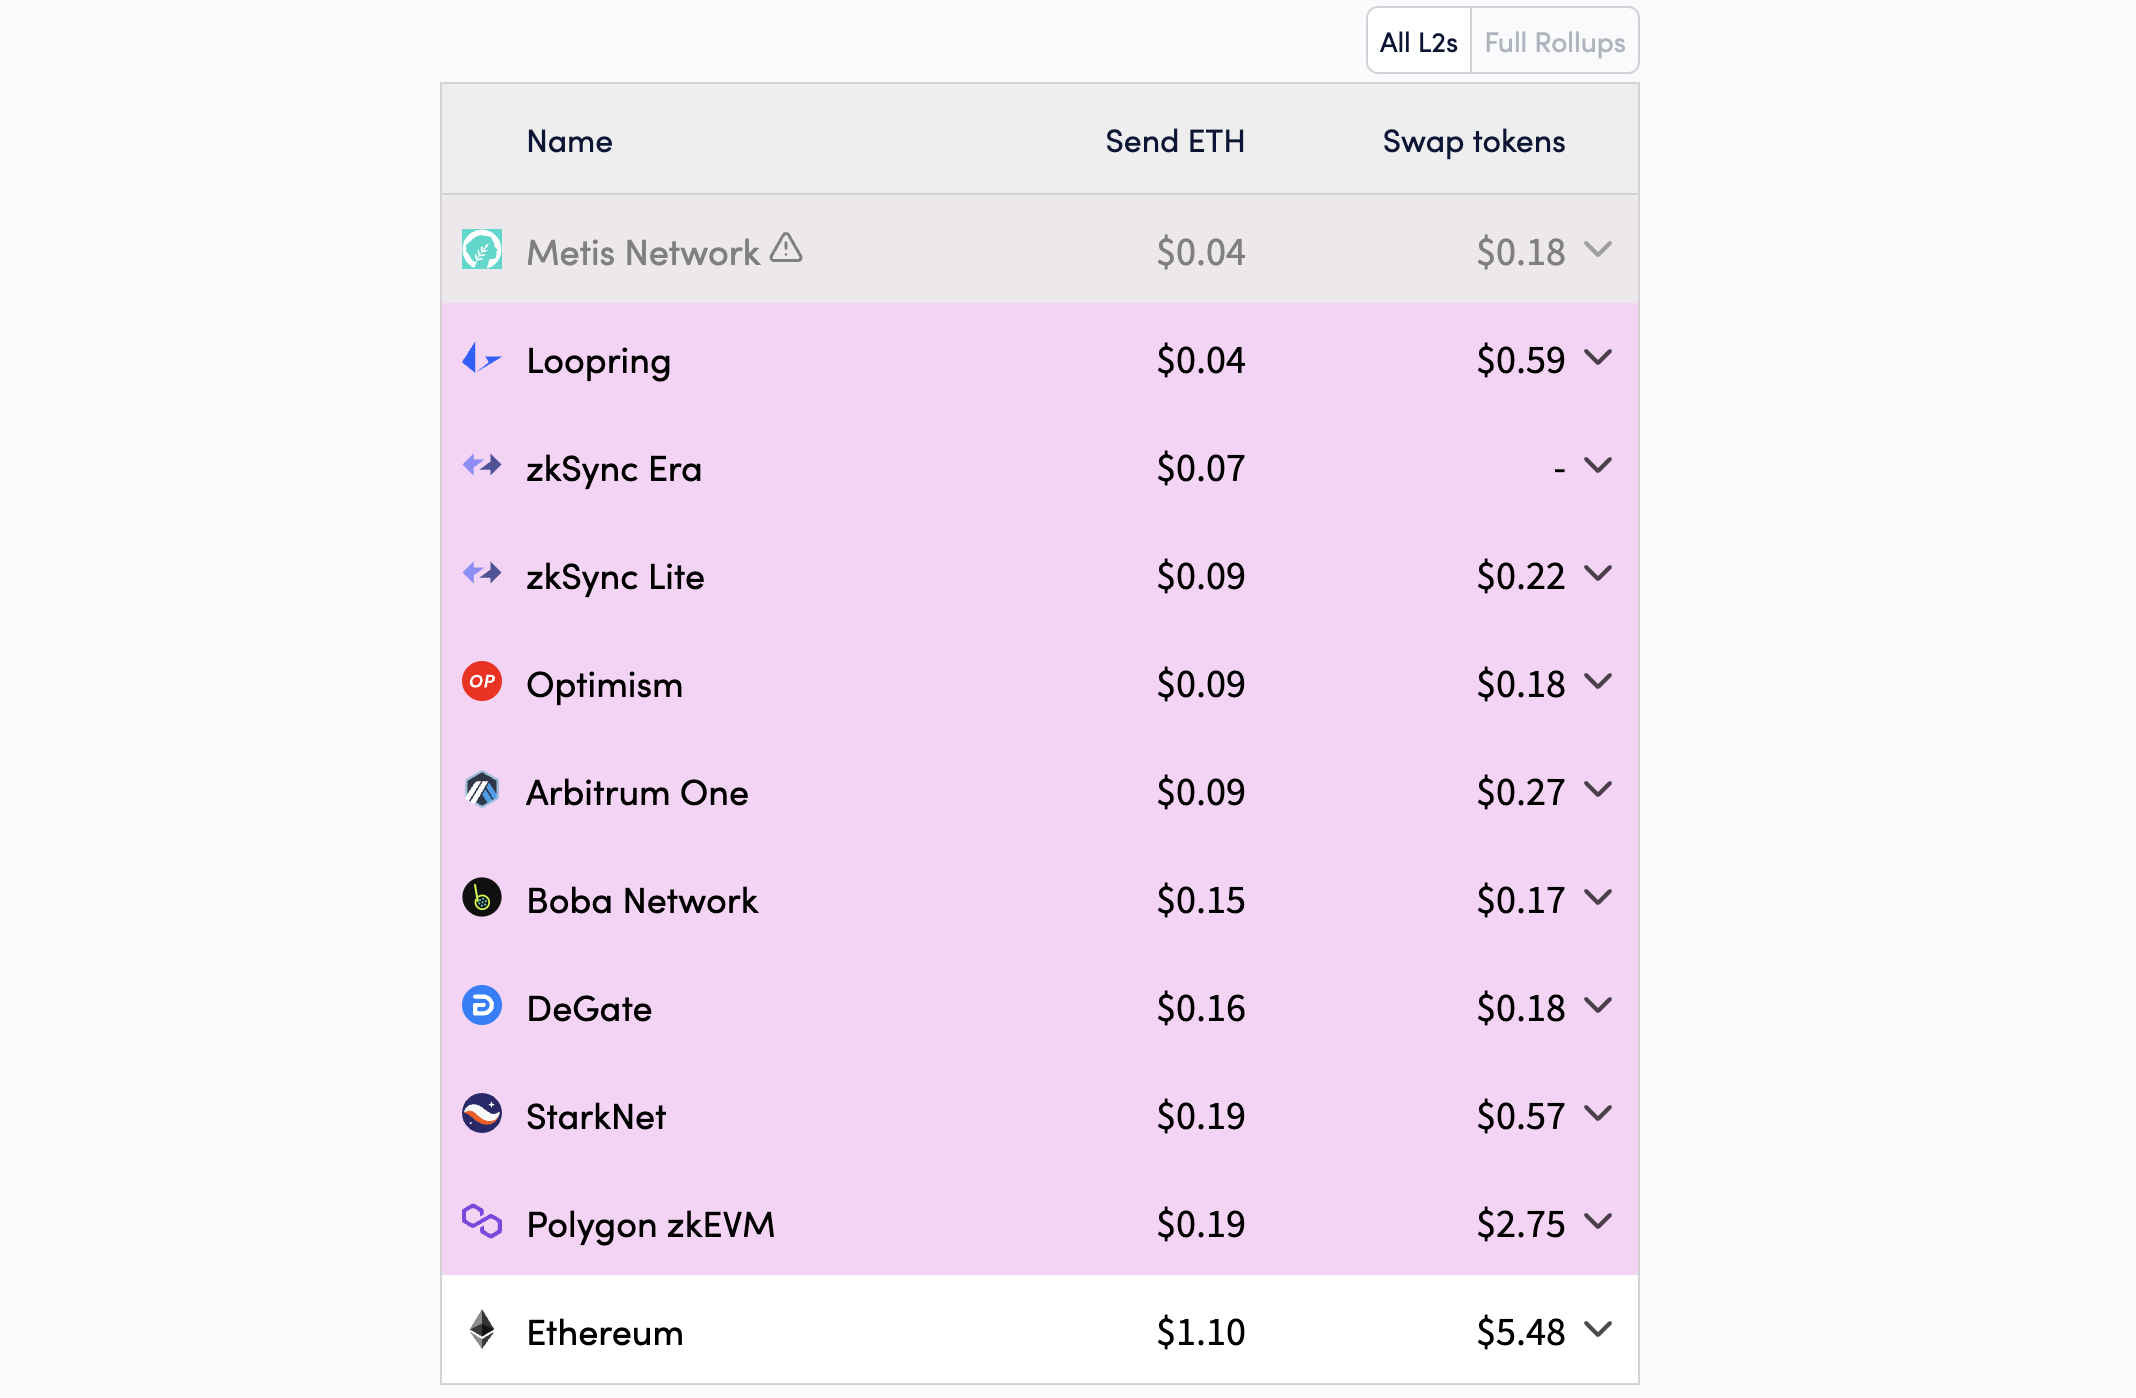
Base, a Coinbase Layer-2 network, ranked second with $193 million in DApp fee revenue, showing notable growth but still trailing Ethereum. BNB Chain followed in third with $170 million, Arbitrum with $73.8 million, and Avalanche C-Chain in fifth with $27.68 million.
DApp fee revenue is a key metric for measuring a blockchain’s activity and user value. On Ethereum, popular DApps include DeFi protocols like Uniswap and Aave, NFT platforms like OpenSea, blockchain games, and social applications. The growth in Ethereum’s DApp fee revenue indicates sustained high demand for these applications despite competition from other networks and often high transaction costs (gas fees) on the mainnet.
Why Ethereum Leads
Several factors explain Ethereum’s continued leadership in DApp fee revenue. Firstly, Ethereum was the first blockchain to support smart contracts, laying the foundation for its DApp ecosystem. According to DappRadar data, Ethereum remains the blockchain with the largest DApps, hosting over 4,983 active DApps, below the BNB Chain.
Second, Ethereum’s high security and reliability make it the preferred choice for developers and users. Despite high mainnet transaction costs, Ethereum has improved performance through upgrades like Dencun (implemented in 2024), which reduced costs on Layer-2 networks and enhanced scalability.
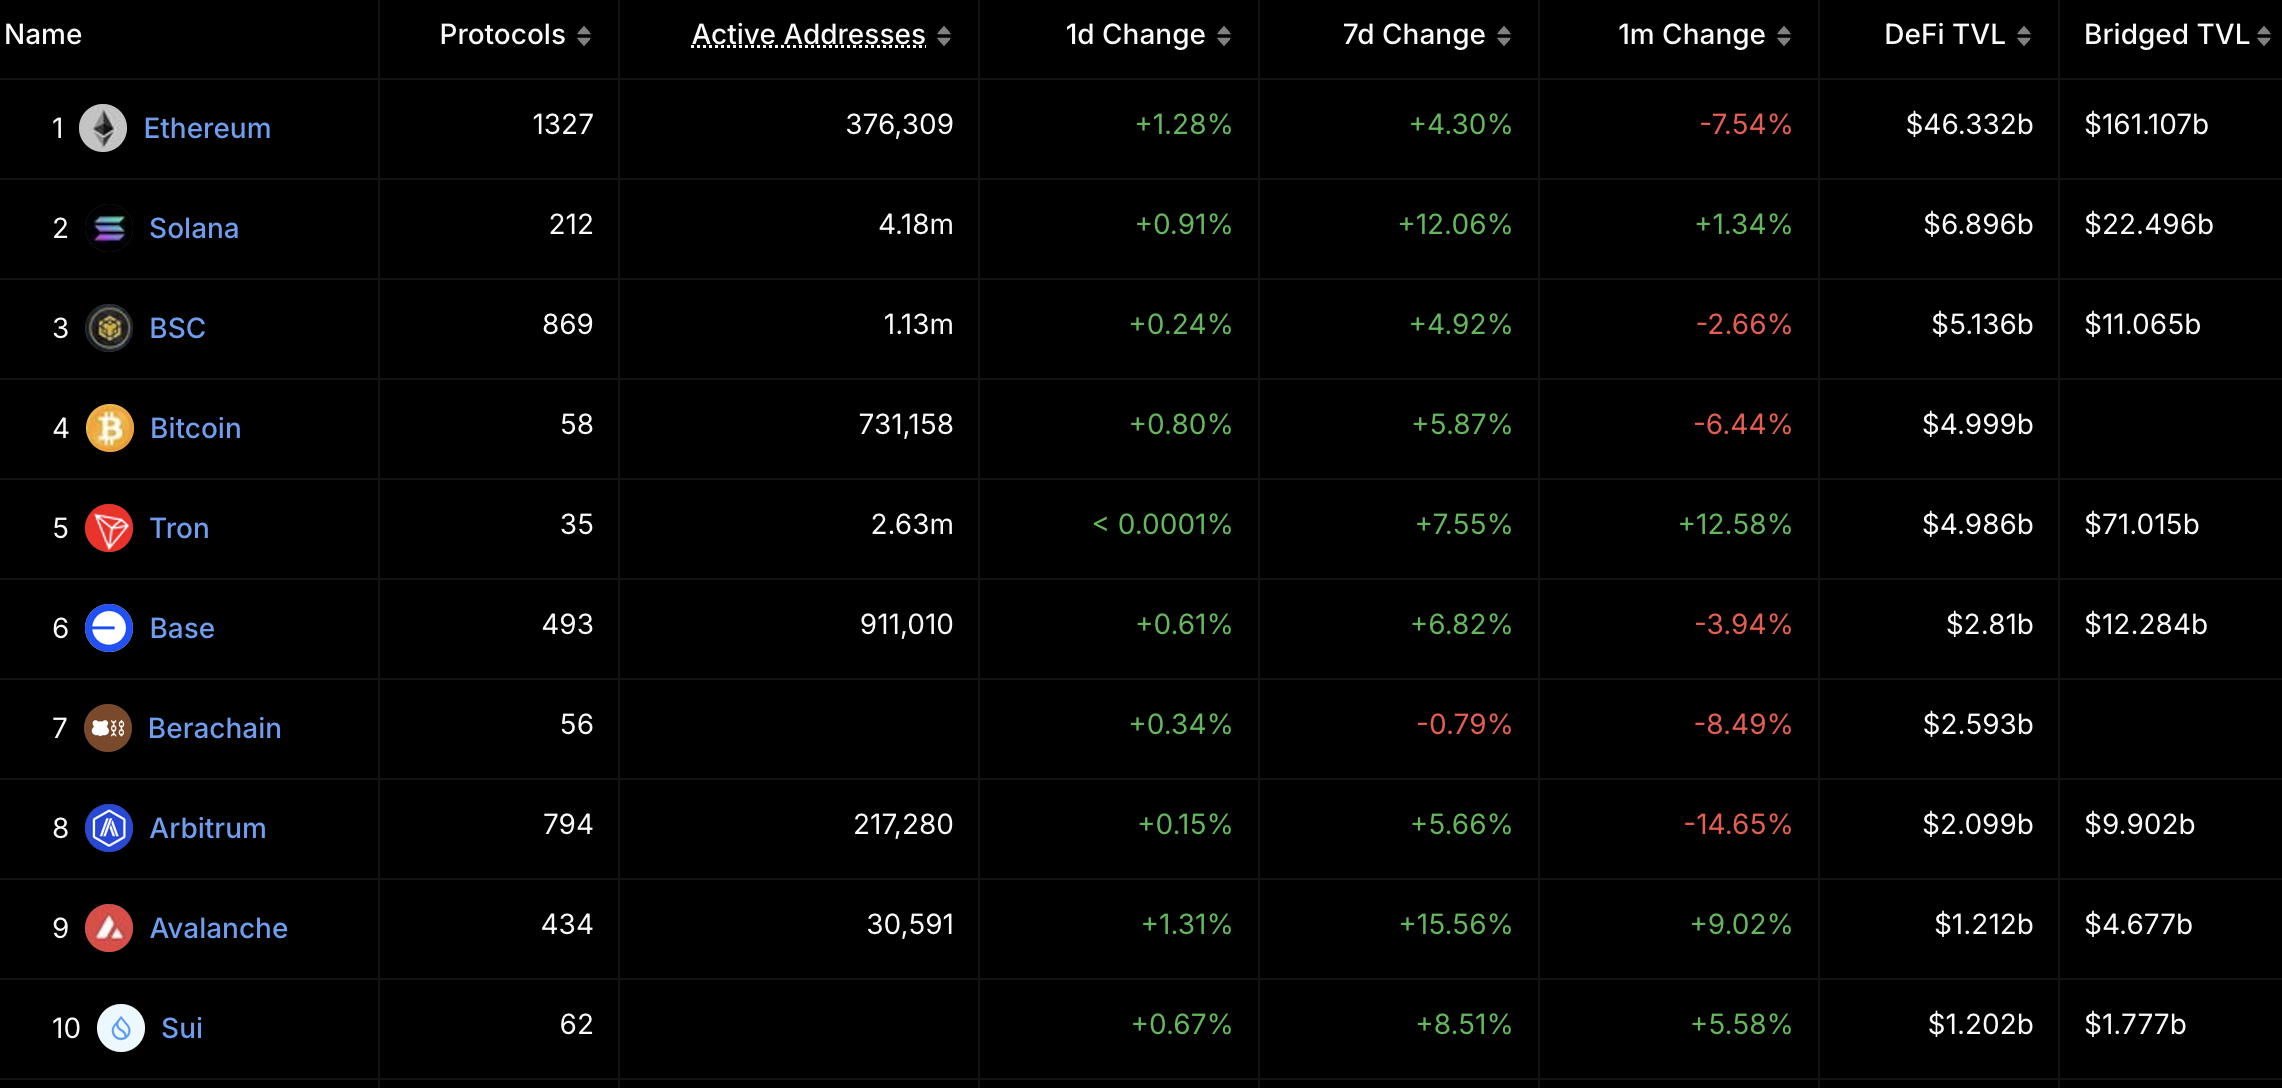
Third, Ethereum’s DeFi ecosystem remains a primary driver of fee revenue. According to DefiLlama, the Total Value Locked (TVL) in Ethereum’s DeFi protocols reached $46 billion, representing 51% of the total TVL in the DeFi market.
While Ethereum leads, other networks are also showing significant growth. According to Token Terminal, Base, Coinbase’s Layer-2, generated $193 million in DApp fee revenue, a 45% increase from Q4 2024.
BNB Chain, with $170 million, remains a strong competitor due to low costs and a diverse DApp ecosystem, including platforms like PancakeSwap. Arbitrum, another Ethereum Layer-2, recorded $73.8 million, driven by the expansion of DeFi and blockchain gaming DApps. With $27.68 million, Avalanche C-Chain excels in finance and NFTs but cannot match Ethereum’s scale.
Disclaimer
In adherence to the Trust Project guidelines, BeInCrypto is committed to unbiased, transparent reporting. This news article aims to provide accurate, timely information. However, readers are advised to verify facts independently and consult with a professional before making any decisions based on this content. Please note that our Terms and Conditions, Privacy Policy, and Disclaimers have been updated.
Reason to trust
![]()
Strict editorial policy that focuses on accuracy, relevance, and impartiality
Created by industry experts and meticulously reviewed
The highest standards in reporting and publishing
Strict editorial policy that focuses on accuracy, relevance, and impartiality
Morbi pretium leo et nisl aliquam mollis. Quisque arcu lorem, ultricies quis pellentesque nec, ullamcorper eu odio.
Bitcoin price started a fresh decline from the $86,500 zone. BTC is now consolidating and might continue to decline below the $83,200 support.
- Bitcoin started a fresh decline from the $86,500 zone.
- The price is trading below $85,000 and the 100 hourly Simple moving average.
- There was a break below a connecting bullish trend line with support at $84,500 on the hourly chart of the BTC/USD pair (data feed from Kraken).
- The pair could start another increase if it clears the $84,500 zone.
Bitcoin Price Faces Rejection
Bitcoin price started a fresh increase above the $83,500 zone. BTC formed a base and gained pace for a move above the $84,000 and $85,500 resistance levels.
The bulls pumped the price above the $86,000 resistance. A high was formed at $86,401 and the price recently corrected some gains. There was a move below the $85,000 support. Besides, there was a break below a connecting bullish trend line with support at $84,500 on the hourly chart of the BTC/USD pair.
The price tested the $83,200 support. Bitcoin price is now trading below $85,000 and the 100 hourly Simple moving average. On the upside, immediate resistance is near the $84,000 level and the 23.6% Fib retracement level of the downward move from the $86,401 swing high to the $83,171 low.
The first key resistance is near the $84,500 level. The next key resistance could be $84,750 and the 50% Fib retracement level of the downward move from the $86,401 swing high to the $83,171 low.

A close above the $84,750 resistance might send the price further higher. In the stated case, the price could rise and test the $85,500 resistance level. Any more gains might send the price toward the $86,400 level.
Another Decline In BTC?
If Bitcoin fails to rise above the $85,000 resistance zone, it could start another decline. Immediate support on the downside is near the $83,500 level. The first major support is near the $83,200 level.
The next support is now near the $82,200 zone. Any more losses might send the price toward the $81,500 support in the near term. The main support sits at $80,800.
Technical indicators:
Hourly MACD – The MACD is now gaining pace in the bearish zone.
Hourly RSI (Relative Strength Index) – The RSI for BTC/USD is now below the 50 level.
Major Support Levels – $83,200, followed by $82,200.
Major Resistance Levels – $84,750 and $85,500.

Crypto US stocks are showing mixed performance today, with Core Scientific (CORZ), MicroStrategy (MSTR), and Coinbase (COIN) in focus.
CORZ is down -0.84% in the pre-market and remains one of the worst performers in the sector this year. Meanwhile, MSTR is gaining momentum after a fresh $285 million Bitcoin purchase, pushing its 5-day gains to 16%. COIN is up +0.88% pre-market as it heads into its Q1 2025 earnings report on May 8, trying to recover from a steep YTD decline.
Core Scientific (CORZ)
Core Scientific (CORZ) is down -0.84% in pre-market trading, continuing its recent underperformance. Despite broader strength across crypto-related equities, the stock has struggled to attract buyers.
The company operates one of the largest Bitcoin mining businesses in North America. It provides infrastructure, hosting, and self-mining services through its network of data centers.

CORZ is down nearly 50% year-to-date, making it one of the worst performers among crypto stocks. In contrast, peers like Marathon Digital (MARA) and Coinbase (COIN) have held up much better.
While others benefit from diversification or stronger narratives, Core Scientific remains tied to mining economics—an area hit by rising costs and thinning margins, but that it could have a rebound as BTC rebuilds momentum.
Strategy (MSTR)
MicroStrategy (MSTR) closed yesterday up 3.82%, pushing its year-to-date return to 7.54%. The stock has shown strong momentum alongside Bitcoin’s recent price recovery, with MSTR price up 16% in the last 5 days.
The company, led by Michael Saylor, is best known for its aggressive Bitcoin accumulation strategy. While it originally focused on enterprise software, it has since become heavily tied to BTC’s performance.

Strategy recently purchased an additional $285 million worth of Bitcoin, adding 3,459 BTC to its balance sheet. This brings its total holdings to 531,644 BTC.
The move reinforces the firm’s position as the largest corporate holder of Bitcoin, effectively turning it into a leveraged BTC play for investors.
Coinbase (COIN)
Coinbase (COIN) is trading up +0.88% in the pre-market, showing signs of continued short-term strength. The move comes ahead of a key earnings update.

The company operates one of the largest cryptocurrency exchanges in the US, offering trading, custody, and staking services. Coinbase is set to report its Q1 2025 earnings on May 8, which could be a major catalyst for the stock.
COIN is up 12% over the last five days, attempting to rebound after falling nearly 29% year-to-date.
Disclaimer
In line with the Trust Project guidelines, this price analysis article is for informational purposes only and should not be considered financial or investment advice. BeInCrypto is committed to accurate, unbiased reporting, but market conditions are subject to change without notice. Always conduct your own research and consult with a professional before making any financial decisions. Please note that our Terms and Conditions, Privacy Policy, and Disclaimers have been updated.

Ethereum Leads Q1 2025 DApp Fees With $1.02 Billion

Bitcoin Price on The Brink? Signs Point to Renewed Decline

3 US Crypto Stocks to Watch Today: CORZ, MSTR, and COIN

Ethena Labs Leaves EU Market Over MiCA Compliance

Hedera Under Pressure as Volume Drops, Death Cross Nears

Solana (SOL) Jumps 20% as DEX Volume and Fees Soar

2.52 Million Altcoins Are Ruining Crypto’s Future

Animoca Brands Valuation Tanks 75% In Two Years, Here’s Why

Crypto exchange BingX hacked for $43 million

Are The Big Players Losing Interest?

Hong Kong’s Securities Association Tips Authorities On Crypto Self-Regulation

Coinbase cbBTC Set to go Live on Solana
2.52 Million Altcoins Are Ruining Crypto’s Future
Animoca Brands Valuation Tanks 75% In Two Years, Here’s Why
Crypto exchange BingX hacked for $43 million
Are The Big Players Losing Interest?
Hong Kong’s Securities Association Tips Authorities On Crypto Self-Regulation
Coinbase cbBTC Set to go Live on Solana
-

 Market19 hours ago
Can Pi Network Avoid a Similar Fate?
-

 Market22 hours ago
XRP Price Could Regain Momentum—Is a Bullish Reversal in Sight?
-

 Ethereum22 hours ago
SEC Delays Decision On Staking For Grayscale’s Ethereum ETFs
-

 Market24 hours ago
Trump’s Tariffs Spark Search for Jerome Powell’s Successor
-

 Market21 hours ago
Cardano Buyers Eye $0.70 as ADA Rallies 10%
-
 Bitcoin20 hours ago
Bitcoin Poised for Summer Rally as Gold Leads and Liquidity Peaks
-
 Altcoin19 hours ago
Binance Delists This Crypto Causing 40% Price Crash, Here’s All
-

 Market17 hours ago
Pi Network Price Rise To $1 is Now In The Hands Of Bitcoin
