
Market
XRP Liquidation Heatmap Points to Swift Rise to $0.62
Ripple (XRP) has recently experienced a surge in value over the past week, similar to other altcoins. However, it faced a slight dip in the past 24 hours, a setback that, according to the XRP liquidation heatmap, appears to be temporary.
Currently priced at $0.58, XRP’s recent decline is likely a short-term pause. Here’s why this stagnation might soon reverse.
Indicators Bullish for the Ripple Native Token
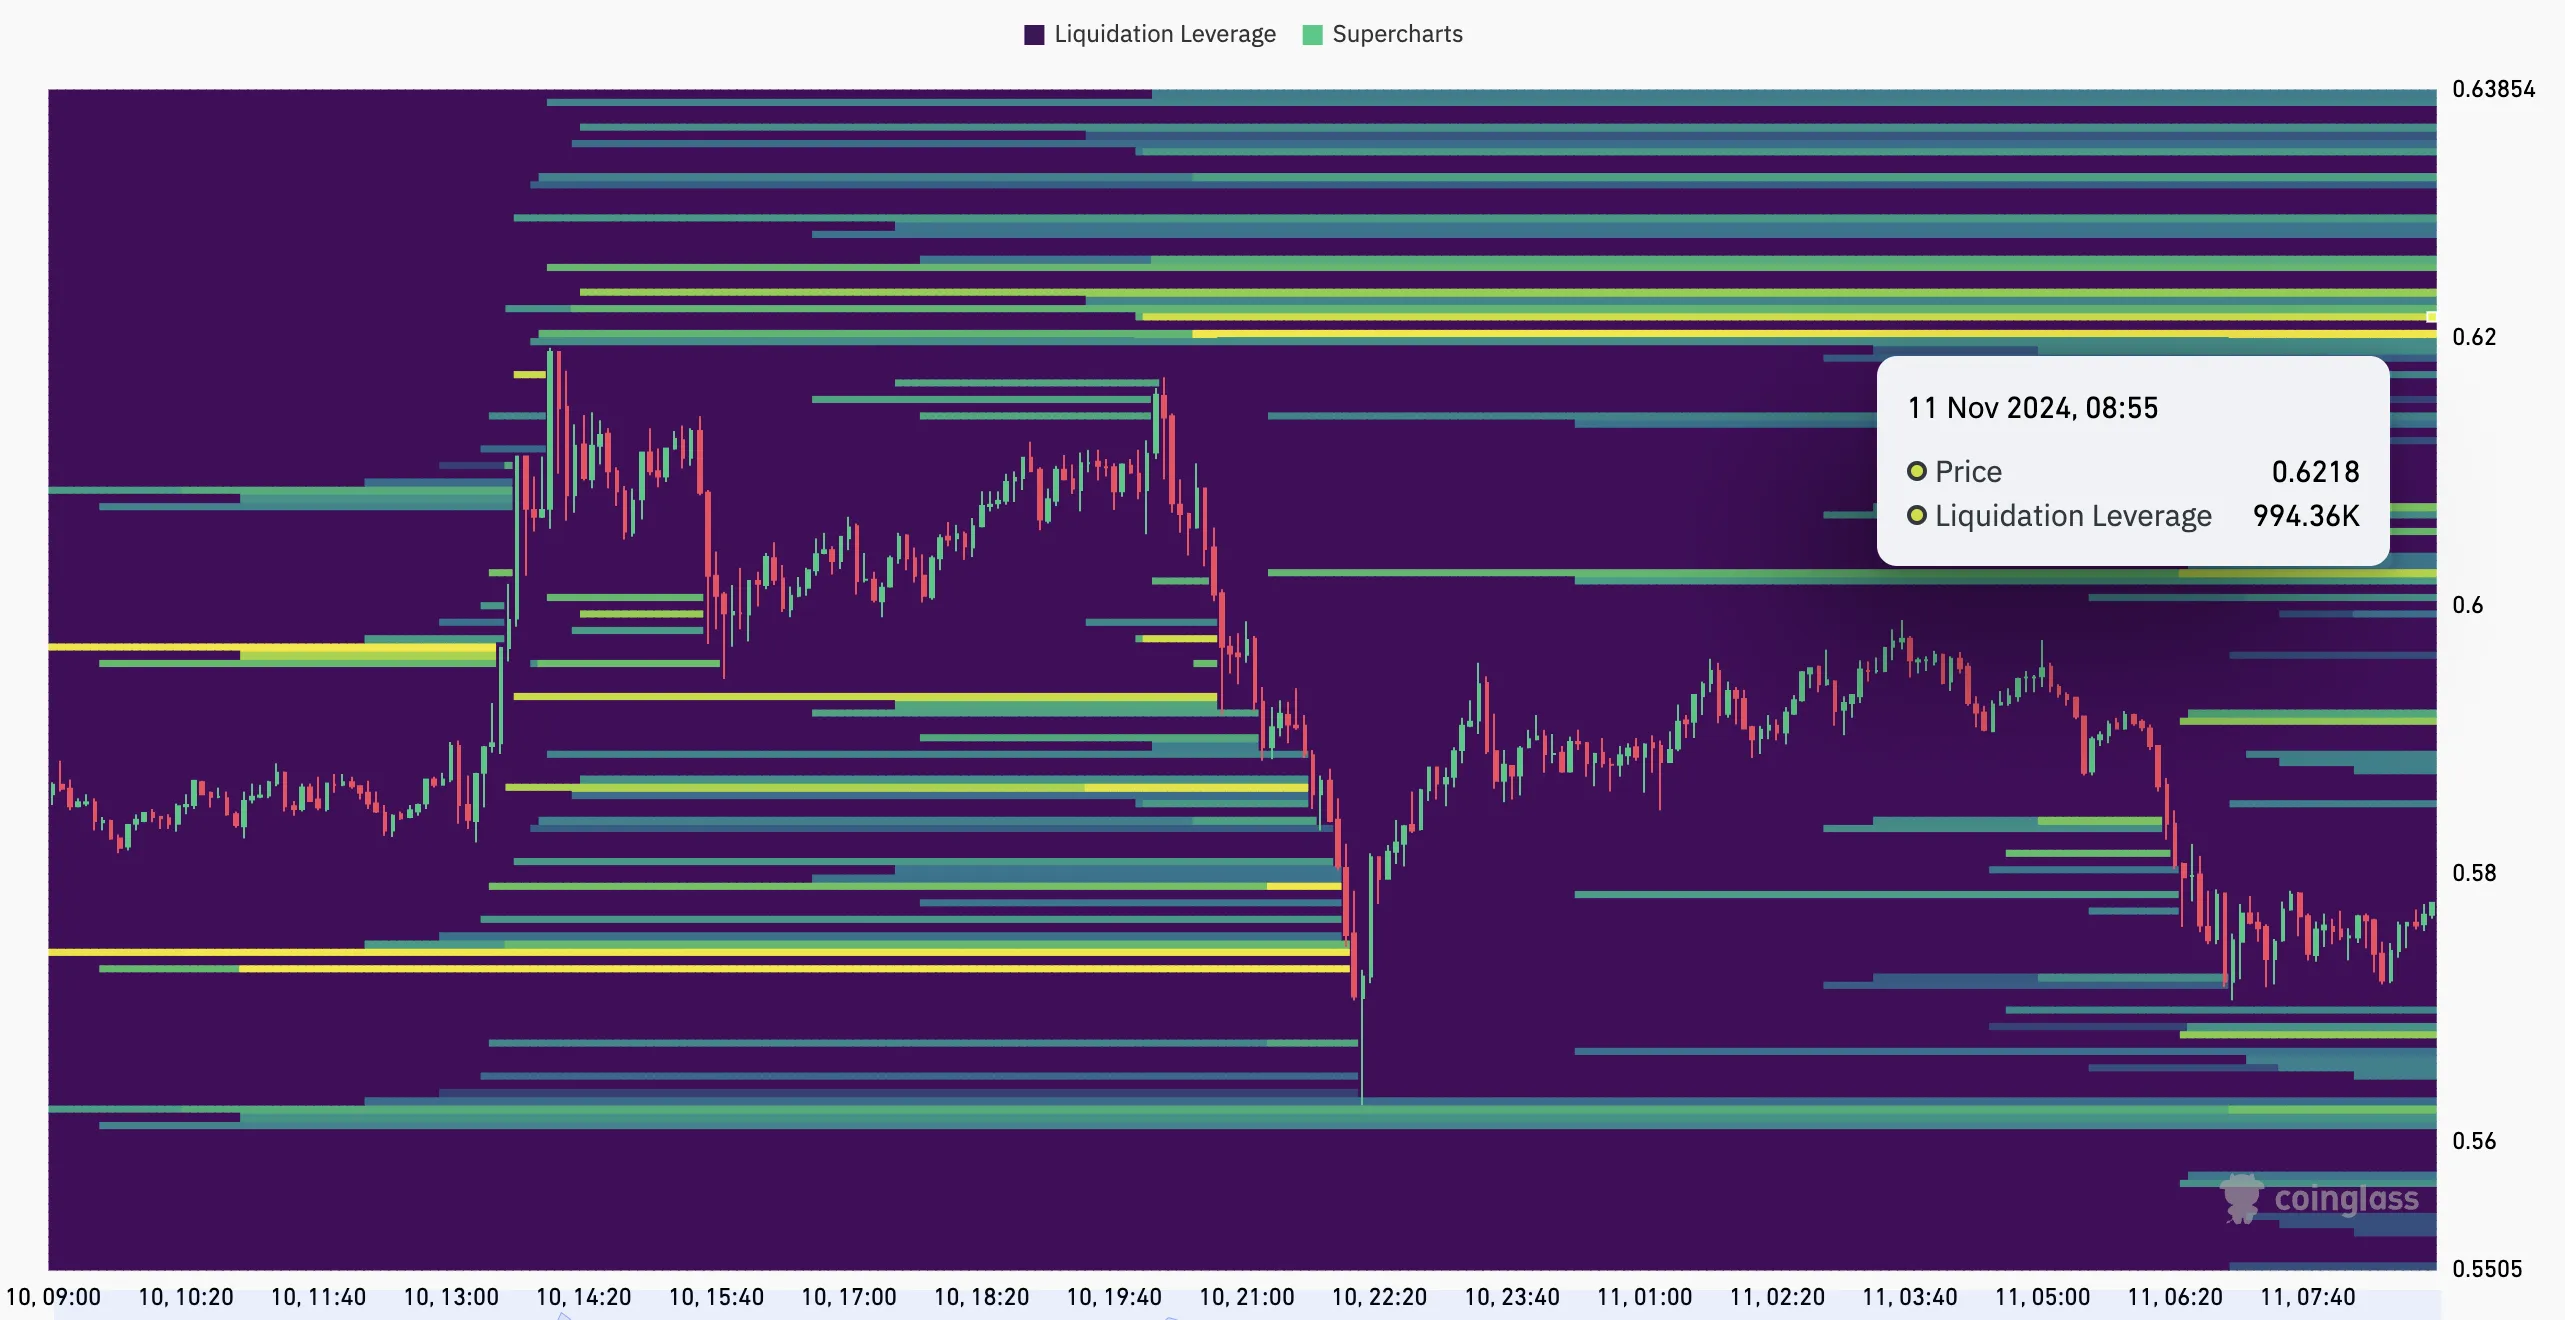
According to Coinglass, XRP has several price levels and a lot of liquidity, but the most notable one is around $0.62. As seen below, the XRP liquidation heatmap color has changed from purple to a clear yellow at that level.
For those unfamiliar, the liquidation heatmap predicts price levels where large-scale liquidations might occur. It also helps traders to identify areas of high liquidity. In most cases, the higher the liquidity, the higher the chances of a price move to that region.
In XRP’s case, a high concentration of liquidity appeared around $0.57 on November 10. But since the altcoin has beaten that region, it means that the next level to reach is the next major one, which is at $0.62.
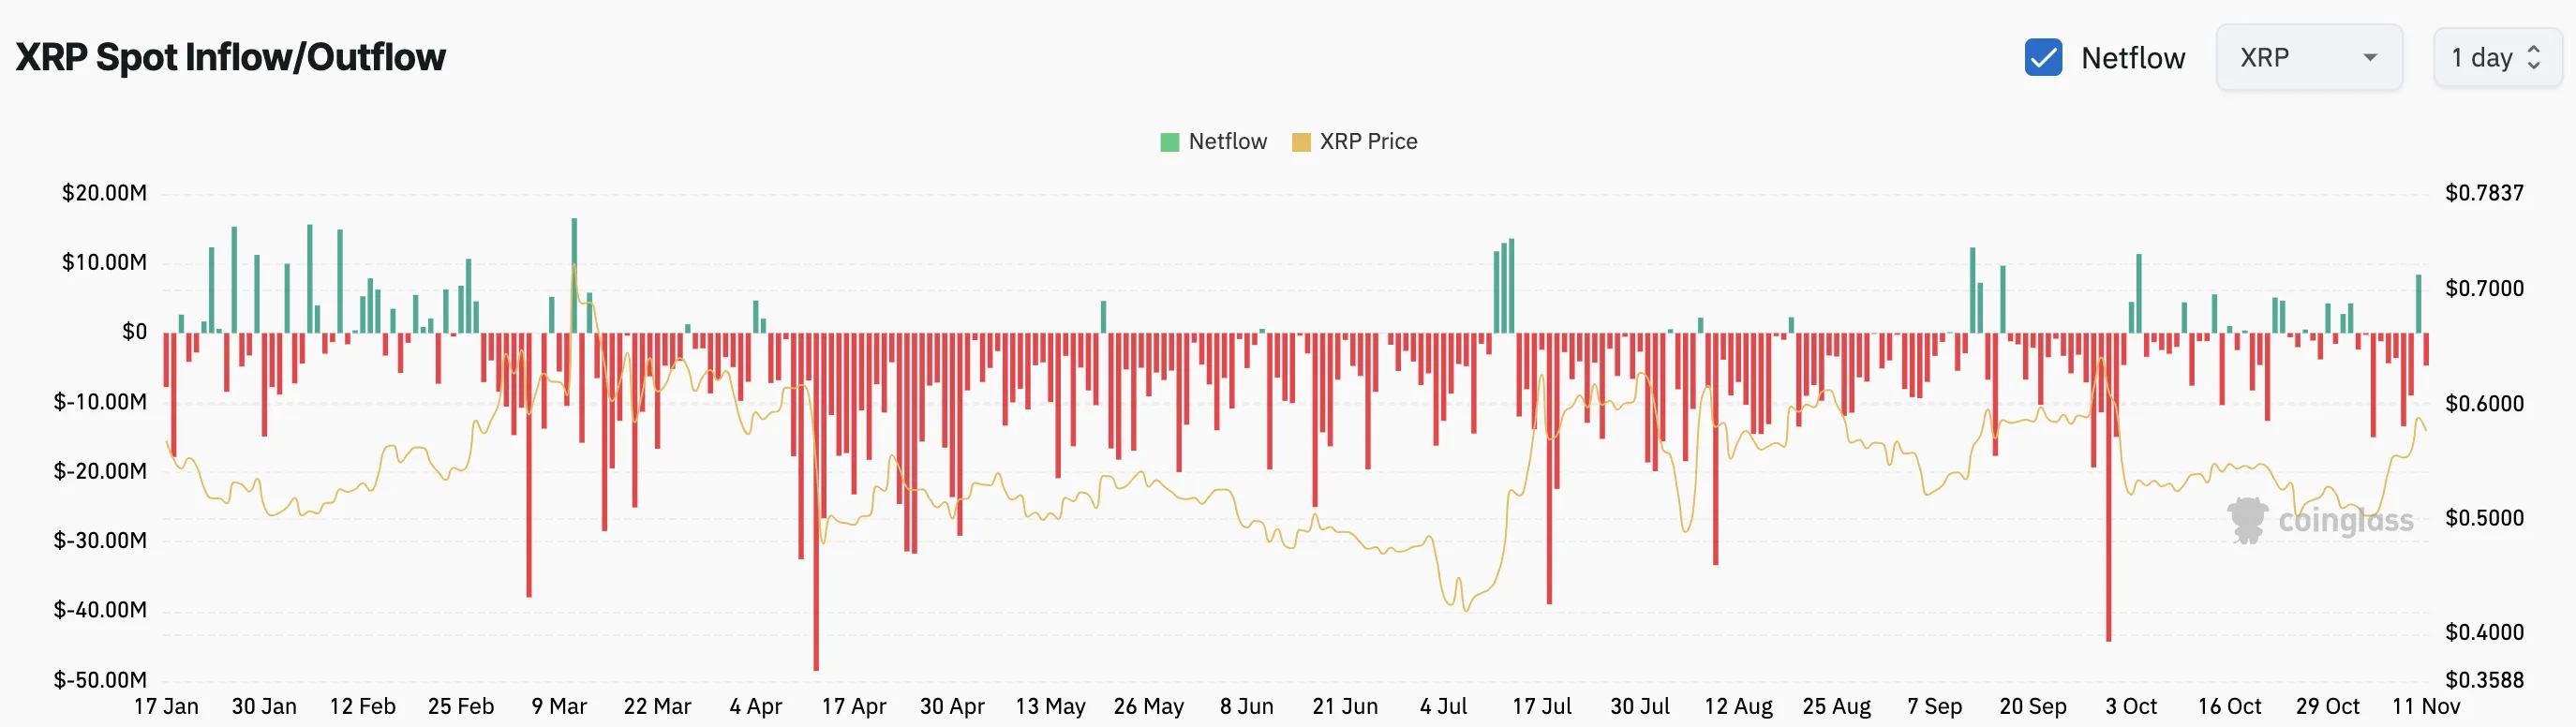
Further, the Spot Inflow/Outflow metric, which monitors token movement to and from exchanges, is another indicator suggesting a bullish outlook.
When large quantities of tokens flow into exchanges, it can signal an intent to sell, increasing downward price pressure. However, in this case, approximately $5 million worth of XRP has exited exchanges within the last 24 hours.
This outflow suggests that most XRP holders are choosing to hold rather than sell, reflecting a bullish sentiment as investors exhibit confidence in the token’s potential for further gains.
XRP Price Prediction: Rally Paused, Not Overruled
From a technical standpoint, XRP’s price moving above the 20- and 50-day Exponential Moving Averages (EMAs) indicates potential bullish momentum. These EMAs often serve as support and resistance levels, and a price rise above them indicates a bullish trend.
If XRP’s price was below them, then the trend would have been bearish. Therefore, the current reading suggests that XRP could be set up for a further upswing. If that remains the case and buying pressure grows, the altcoin’s value might rise by another 7% to $0.62.
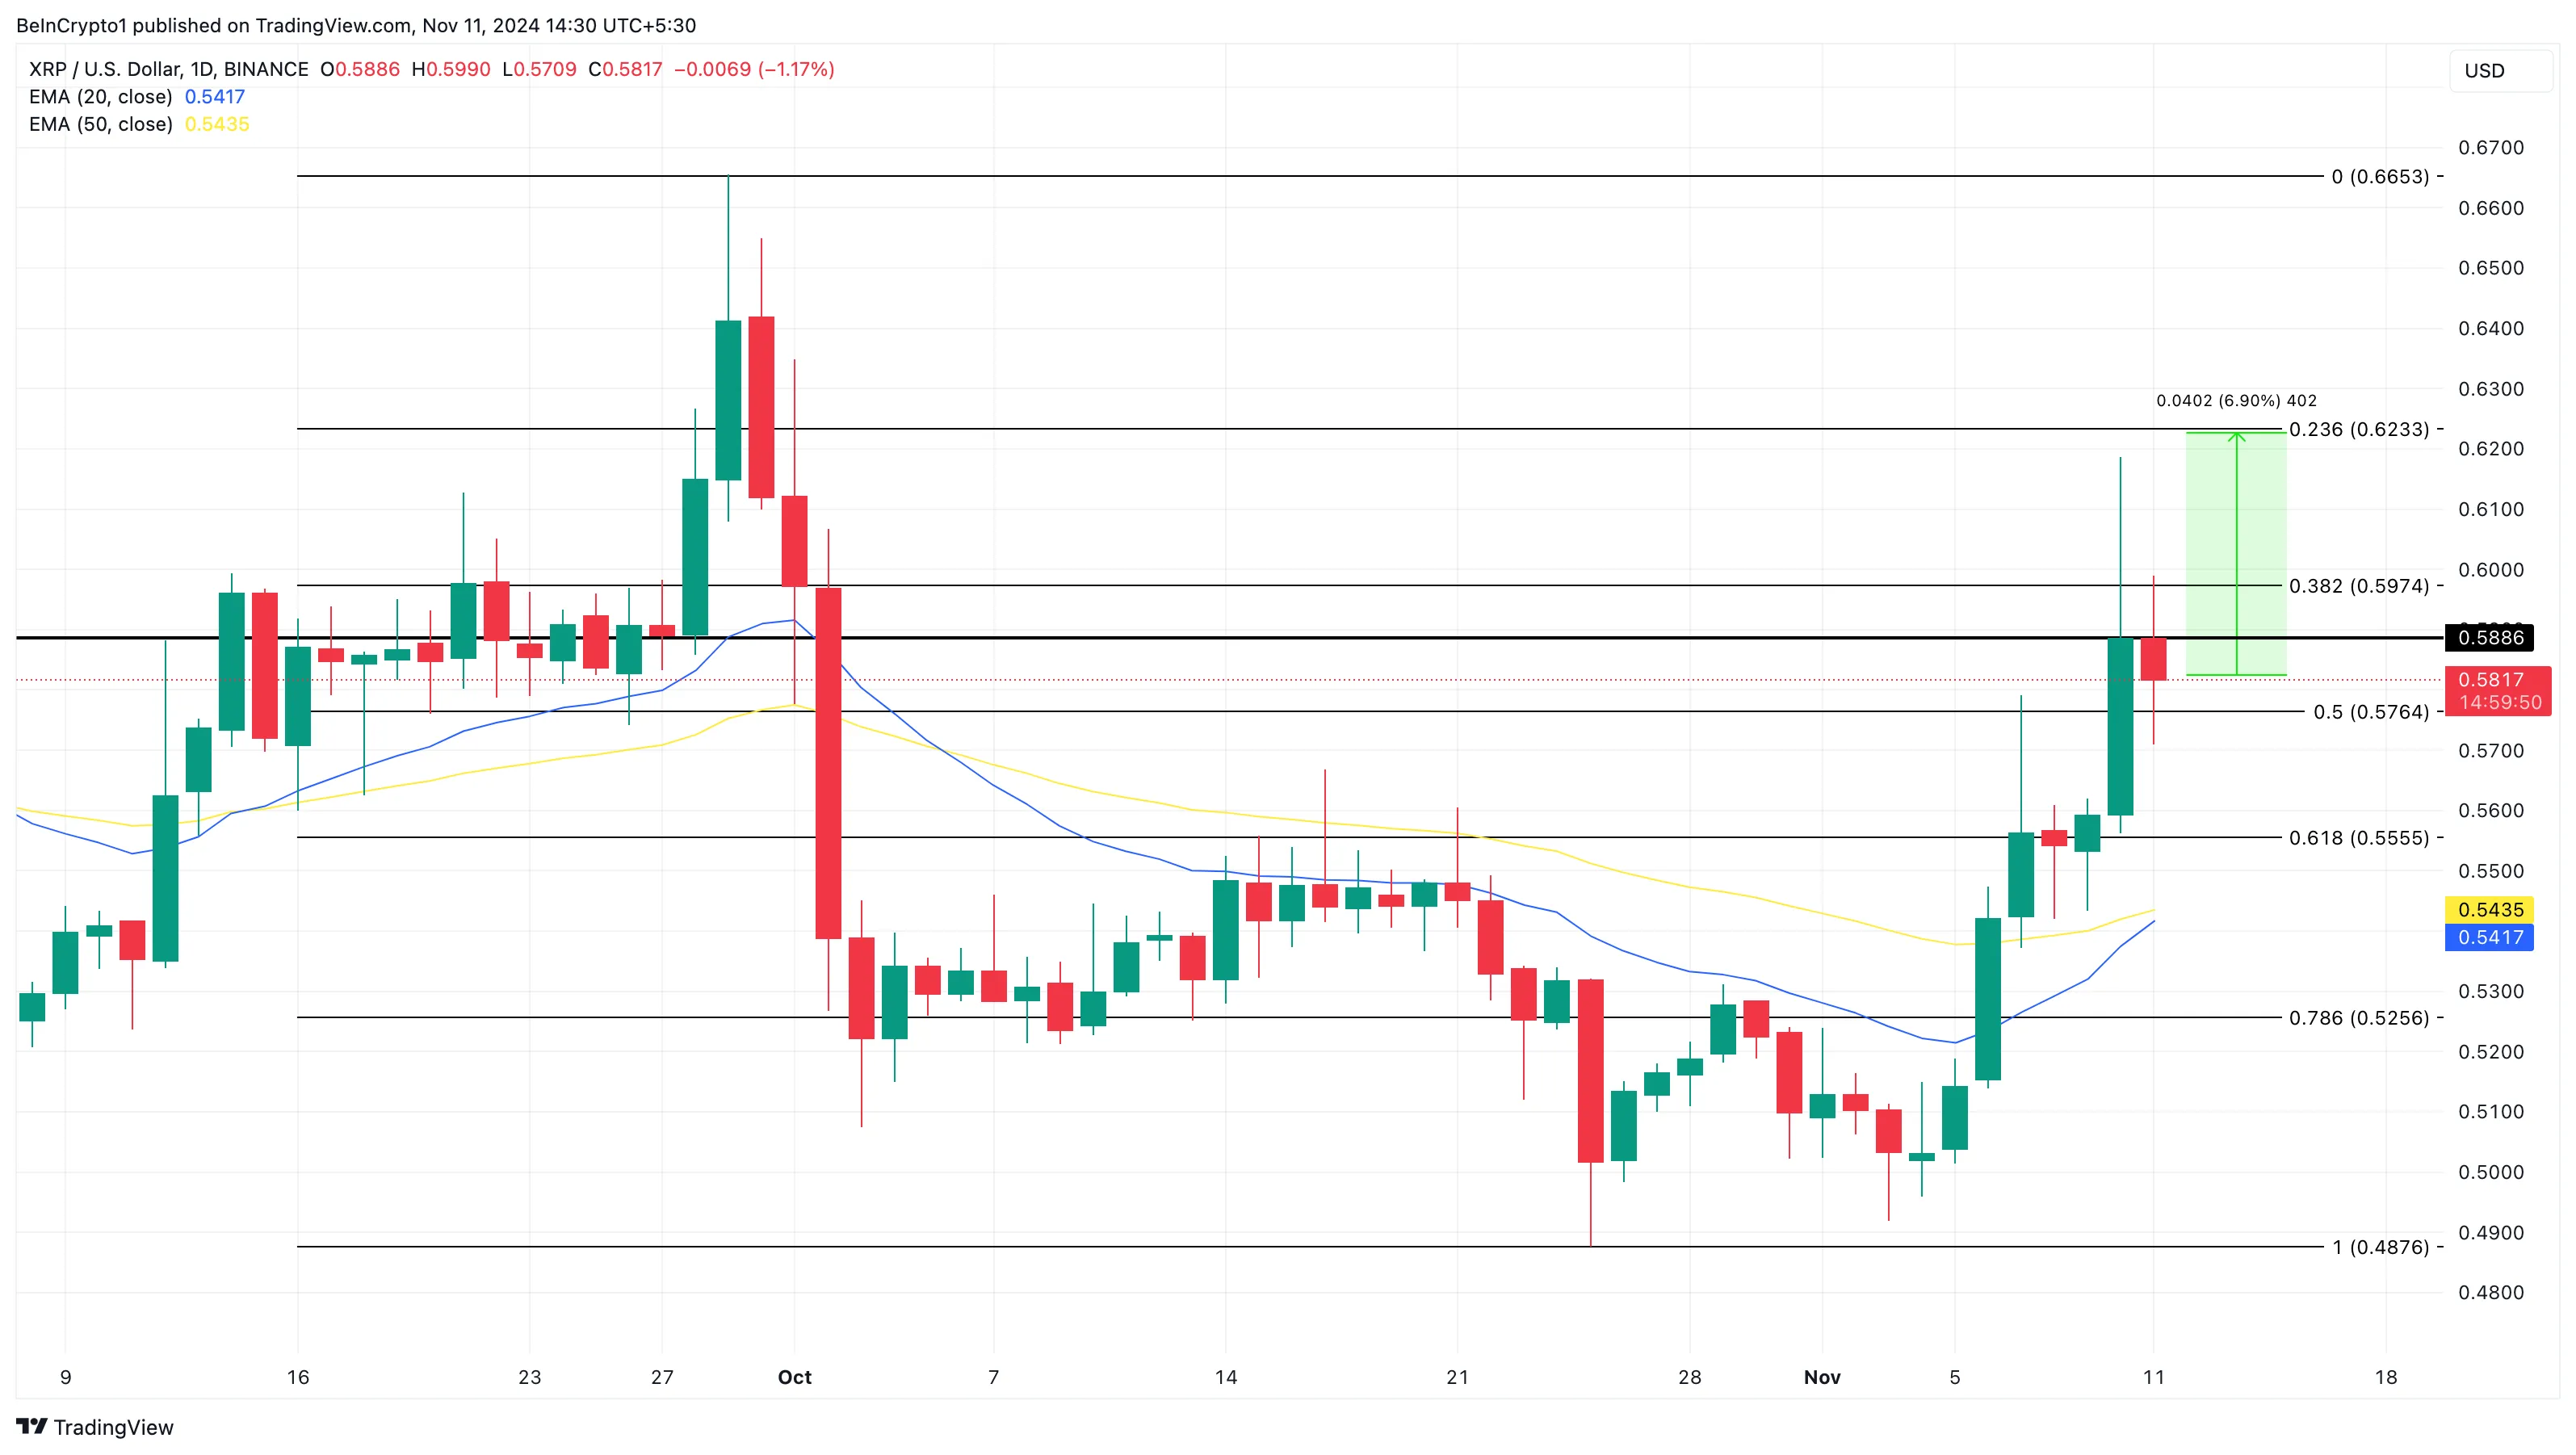
Interestingly, this position is also where the crucial 23.6% Fibonacci level lies. However, if the liquidation heatmap shows a movement of liquidity to a lower area, then the altcoin value might sink. In that scenario, XRP’s price might drop to the 61.8% Fibonacci level at $0.55.
Disclaimer
In line with the Trust Project guidelines, this price analysis article is for informational purposes only and should not be considered financial or investment advice. BeInCrypto is committed to accurate, unbiased reporting, but market conditions are subject to change without notice. Always conduct your own research and consult with a professional before making any financial decisions. Please note that our Terms and Conditions, Privacy Policy, and Disclaimers have been updated.


Cardano price started a fresh decline from the $0.680 zone. ADA is consolidating near $0.620 and remains at risk of more losses.
- ADA price started a recovery wave from the $0.5850 zone.
- The price is trading below $0.640 and the 100-hourly simple moving average.
- There is a connecting bearish trend line forming with resistance at $0.6350 on the hourly chart of the ADA/USD pair (data source from Kraken).
- The pair could start another increase if it clears the $0.640 resistance zone.
Cardano Price Faces Resistance
In the past few sessions, Cardano saw a fresh decline from the $0.680 level, like Bitcoin and Ethereum. ADA declined below the $0.650 and $0.640 support levels.
A low was formed at $0.6040 and the price is now consolidating losses. There was a minor move above the $0.6120 level. The price tested the 23.6% Fib retracement level of the recent decline from the $0.6481 swing high to the $0.6040 low.
Cardano price is now trading below $0.640 and the 100-hourly simple moving average. On the upside, the price might face resistance near the $0.6260 zone and the 50% Fib retracement level of the recent decline from the $0.6481 swing high to the $0.6040 low.
The first resistance is near $0.6350. There is also a connecting bearish trend line forming with resistance at $0.6350 on the hourly chart of the ADA/USD pair. The next key resistance might be $0.6480.

If there is a close above the $0.6480 resistance, the price could start a strong rally. In the stated case, the price could rise toward the $0.680 region. Any more gains might call for a move toward $0.70 in the near term.
Another Drop in ADA?
If Cardano’s price fails to climb above the $0.6350 resistance level, it could start another decline. Immediate support on the downside is near the $0.6040 level.
The next major support is near the $0.60 level. A downside break below the $0.60 level could open the doors for a test of $0.580. The next major support is near the $0.5550 level where the bulls might emerge.
Technical Indicators
Hourly MACD – The MACD for ADA/USD is gaining momentum in the bearish zone.
Hourly RSI (Relative Strength Index) – The RSI for ADA/USD is now below the 50 level.
Major Support Levels – $0.6040 and $0.580.
Major Resistance Levels – $0.6350 and $0.6480.

The total value of real-world assets (RWAs) on the Arbitrum network has surged over 1,000-fold since the start of 2024.
From a modest $100,000 to $200,000 in early January last year, Arbitrum now hosts more than $200 million in tokenized RWAs. This reflects one of the most explosive growth trajectories in decentralized finance (DeFi) this year.
RWA Total Value on Arbitrum Increases 1,000X
This exponential expansion is largely attributed to Arbitrum DAO’s Stable Treasury Endowment Program (STEP), which is currently in its 2.0 phase. The program allocated 85 million ARB tokens to support stable, liquid, yield-generating RWAs.
“The DAO just approved 35M ARB for RWAs via STEP 2.0. This brings the total RWA investments from the DAO treasury to 85M ARB, one of the largest DAO-led RWA allocations in Web3,” Arbitrum said in February.
The strategy aims to reduce the DAO’s exposure to volatile native crypto assets and help build a more resilient treasury, and it appears to be yielding results.

US Treasuries dominate Arbitrum’s RWA ecosystem, making up 97% of the sector. Franklin Templeton’s BENJI leads the pack, which holds a 36% market share, followed by SPIKO’s European treasuries, accounting for 18%.
This diversification beyond US-centric instruments is a healthy sign for global institutional engagement with Arbitrum.
“The eco welcomes global diversification beyond US instruments,” The Learning Pill remarked.
New entrants like Dinari have also added to the ecosystem’s momentum, offering tokenized versions of traditional securities. These include stocks, ETFs (exchange-traded funds), and REITs via its dShares platform.
More than 18 tokenized RWA products live on Arbitrum, covering various asset classes from bonds to real estate. Arbitrum itself highlighted this institutional influx on X (Twitter)
“RWA and Stablecoin adoption on Arbitrum has been monumental! Some of the largest institutions are bringing their tokenized assets to the land of liquidity with $4.7 billion in Stablecoins and over $214 million in RWAs already onchain,” the network stated.
Teams like Securitize, DigiFT, and SPIKO are tokenizing everything from sovereign debt to real estate portfolios, signaling the early formation of a new financial substrate.
Yet, despite the strong ecosystem development, ARB, the network’s native token, is down 88% from its all-time high.

Further downside pressure looms, with a 92.63 million ARB token unlock imminent. With only 46% of the total supply currently in circulation, concerns about dilution and lack of direct token accrual from RWA growth remain key market overhangs.

Tokenized RWA Cross $11 Billion, Ethereum Dominates Onchain Finance Frontier
Beyond Arbitrum, the broader real-world asset sector has quietly become one of the most significant trends in crypto, even if it does not dominate headlines.
According to DeFiLlama, on-chain RWAs have surpassed $11.169 billion in total value locked, up 2.5X over the past year.

Tokenized US Treasuries and tokenized gold are the engines behind this boom. BlackRock’s BUIDL fund now holds over $2.38 billion in tokenized Treasuries alone. Meanwhile, blockchain-based gold assets, driven by both market demand and rising metal prices, have crossed $1.2 billion, according to a recent BeInCrypto report.
Ethereum remains in the frontline, hosting approximately 80% of all on-chain RWAs. As TradFi giants seek programmable exposure to dollar yields and real assets, Ethereum offers the infrastructure and liquidity needed to bridge capital markets with blockchain rails.
“The top RWA protocols aren’t chasing crypto narratives. They are offering something TradFi understands: yield, dollar exposure, and gold. This is not the future of DeFi. It’s the future of finance,” DeFi analyst Patrick Scott observed.
Builders point out that adoption is already deeply embedded in on-chain-native applications like Pendle, Morpho, Frax, and various automated market makers (AMMs) and staking layers. The “real yield” thesis has arrived, coded into the new financial system’s base layer.
“The TradFi narrative is nice, but the adoption so far is on-chain-native,” DeFi builder Artem Tolkachev noted.
While flashy DeFi experiments often mimic casinos, RWAs show that slow, stable, and scalable wins the race.
The next frontier lies in improving access, liquidity, and incentives, particularly on non-Ethereum chains like Arbitrum, where the technical groundwork is strong, but market confidence remains in flux.
Tokenized RWAs may not be the loudest narrative in crypto, but they are becoming its most consequential.
“Onchain RWAs are quietly becoming the backbone of future finance, not hype, just real value TradFi gets: yield, dollars, and gold,” Validatus.com quipped.
Disclaimer
In adherence to the Trust Project guidelines, BeInCrypto is committed to unbiased, transparent reporting. This news article aims to provide accurate, timely information. However, readers are advised to verify facts independently and consult with a professional before making any decisions based on this content. Please note that our Terms and Conditions, Privacy Policy, and Disclaimers have been updated.
XRP price started a fresh increase above the $2.20 resistance. The price is now correcting gains and might find bids near the $2.050 zone.
- XRP price started a downside correction from the $2.250 resistance zone.
- The price is now trading below $2.120 and the 100-hourly Simple Moving Average.
- There was a break below a connecting bullish trend line with support at $2.140 on the hourly chart of the XRP/USD pair (data source from Kraken).
- The pair might extend losses if there is a close below the $2.050 support zone.
XRP Price Dips Again
XRP price started a fresh increase above the $1.980 resistance, like Bitcoin and Ethereum. The price climbed above the $2.020 and $2.050 resistance levels.
A high was formed at $2.244 and the price recently started a downside correction. There was a move below the $2.120 support zone. Besides, there was a break below a connecting bullish trend line with support at $2.140 on the hourly chart of the XRP/USD pair.
The price even spiked below the 50% Fib retracement level of the upward move from the $1.920 swing low to the $2.244 high. The price is now trading below $2.120 and the 100-hourly Simple Moving Average.

On the upside, the price might face resistance near the $2.120 level. The first major resistance is near the $2.180 level. The next resistance is $2.20. A clear move above the $2.20 resistance might send the price toward the $2.250 resistance. Any more gains might send the price toward the $2.320 resistance or even $2.350 in the near term. The next major hurdle for the bulls might be $2.50.
Another Decline?
If XRP fails to clear the $2.120 resistance zone, it could start another decline. Initial support on the downside is near the $2.050 level and the 61.8% Fib retracement level of the upward move from the $1.920 swing low to the $2.244 high. The next major support is near the $2.00 level.
If there is a downside break and a close below the $2.00 level, the price might continue to decline toward the $1.920 support. The next major support sits near the $1.840 zone.
Technical Indicators
Hourly MACD – The MACD for XRP/USD is now gaining pace in the bearish zone.
Hourly RSI (Relative Strength Index) – The RSI for XRP/USD is now below the 50 level.
Major Support Levels – $2.050 and $2.00.
Major Resistance Levels – $2.120 and $2.180.

China Liquidates Seized Crypto to Boost Struggling Treasury
Expert Reveals Current Status Of 9 Ripple ETFs

Cardano (ADA) Pressure Mounts—More Downside on the Horizon?

Is Bitcoin the Solution to Managing US Debt? VanEck Explains

Arbitrum RWA Market Soars – But ARB Still Struggles

Ripple Whale Moves $273M As Analyst Predicts XRP Price Crash To $1.90

2.52 Million Altcoins Are Ruining Crypto’s Future

Animoca Brands Valuation Tanks 75% In Two Years, Here’s Why

Crypto exchange BingX hacked for $43 million

Are The Big Players Losing Interest?

Hong Kong’s Securities Association Tips Authorities On Crypto Self-Regulation

Coinbase cbBTC Set to go Live on Solana
2.52 Million Altcoins Are Ruining Crypto’s Future
Animoca Brands Valuation Tanks 75% In Two Years, Here’s Why
Crypto exchange BingX hacked for $43 million
Are The Big Players Losing Interest?
Hong Kong’s Securities Association Tips Authorities On Crypto Self-Regulation
Coinbase cbBTC Set to go Live on Solana
-

 Market22 hours ago
Can Pi Network Avoid a Similar Fate?
-

 Altcoin17 hours ago
Whispers Of Insider Selling As Mantra DAO Relocates Nearly $27 Million In OM To Binance
-
 Bitcoin24 hours ago
Bitcoin Poised for Summer Rally as Gold Leads and Liquidity Peaks
-

 Market16 hours ago
Trump Family Plans Crypto Game Inspired by Monopoly
-
 Altcoin22 hours ago
Binance Delists This Crypto Causing 40% Price Crash, Here’s All
-

 Bitcoin22 hours ago
Bolivia Reverses Crypto-for-Fuel Plan Amid Energy Crisis
-

 Market21 hours ago
Ethereum Price Consolidation Hints at Strength—Is a Move Higher Coming?
-
 Market18 hours ago
XRP Early Investors Continue To Sell As Price Holds Above $2
