
Market
XRP ETF Speculation Sparks FOMO: Could Price Rally Continue?

Ripple (XRP) is experiencing a surge in positive sentiment ahead of the upcoming launch of the Grayscale Trust for the cryptocurrency. As excitement grows, market participants are positioning themselves for potential gains.
This development has sparked speculation about a possible XRP Exchange Traded Fund (ETF) in the US. Here’s how the altcoin’s price could react as this sentiment continues to unfold.
Ripple ETF Rumors Spread
On September 12, Grayscale, one of the largest digital asset investment managers globally, announced the launch of its XRP Trust in the US. Following the announcement, XRP’s price quickly surged from $0.53 to $0.58.
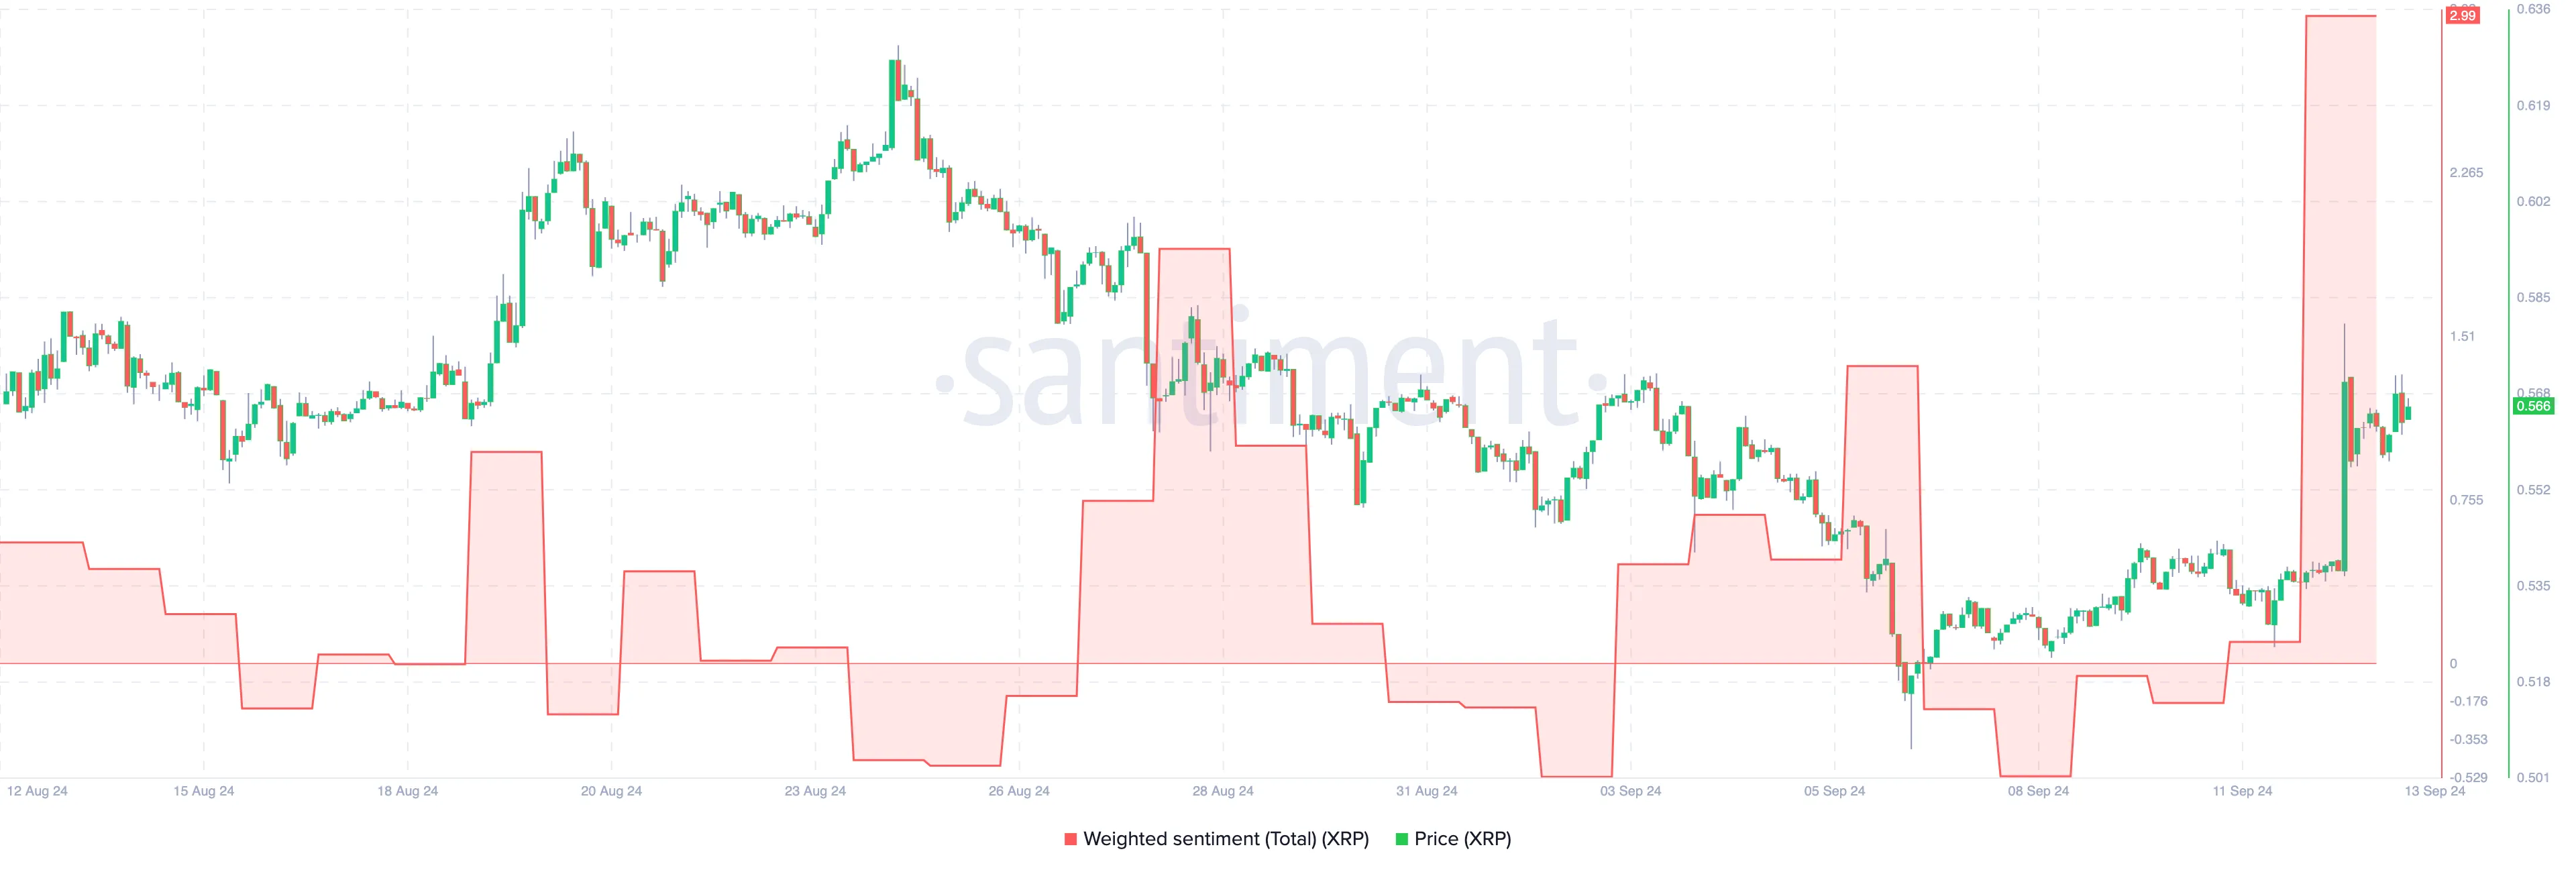
Although the price has since settled to $0.56, on-chain data from Santiment reveals a significant spike in Weighted Sentiment, reaching its highest level in over a month. Weighted Sentiment tracks social volume to gauge whether the market is leaning bullish or bearish on a project.
A surge in this metric indicates a high volume of positive comments, posts, or messages, while a decline suggests growing pessimism. The recent spike signifies that previously cautious participants are now increasingly optimistic about XRP’s future prospects.
Read more: XRP ETF Explained: What It Is and How It Works
In crypto terms, this is known as the Fear of Mission Out (FOMO) — possibly on the next crypto ETF. Regarding this development, Doctor Crypto, an analyst on X, opined that the XRP ETF might come sooner than expected.
“Today Grayscale announced the first XRP trust. Most likely, in 4-8 months, you will see the first XRP ETF,” Doctor Profit said.
Historically, extremely high positive sentiment often leads to a short-term price decline. If this trend continues, XRP could face a potential price drop in the near future.
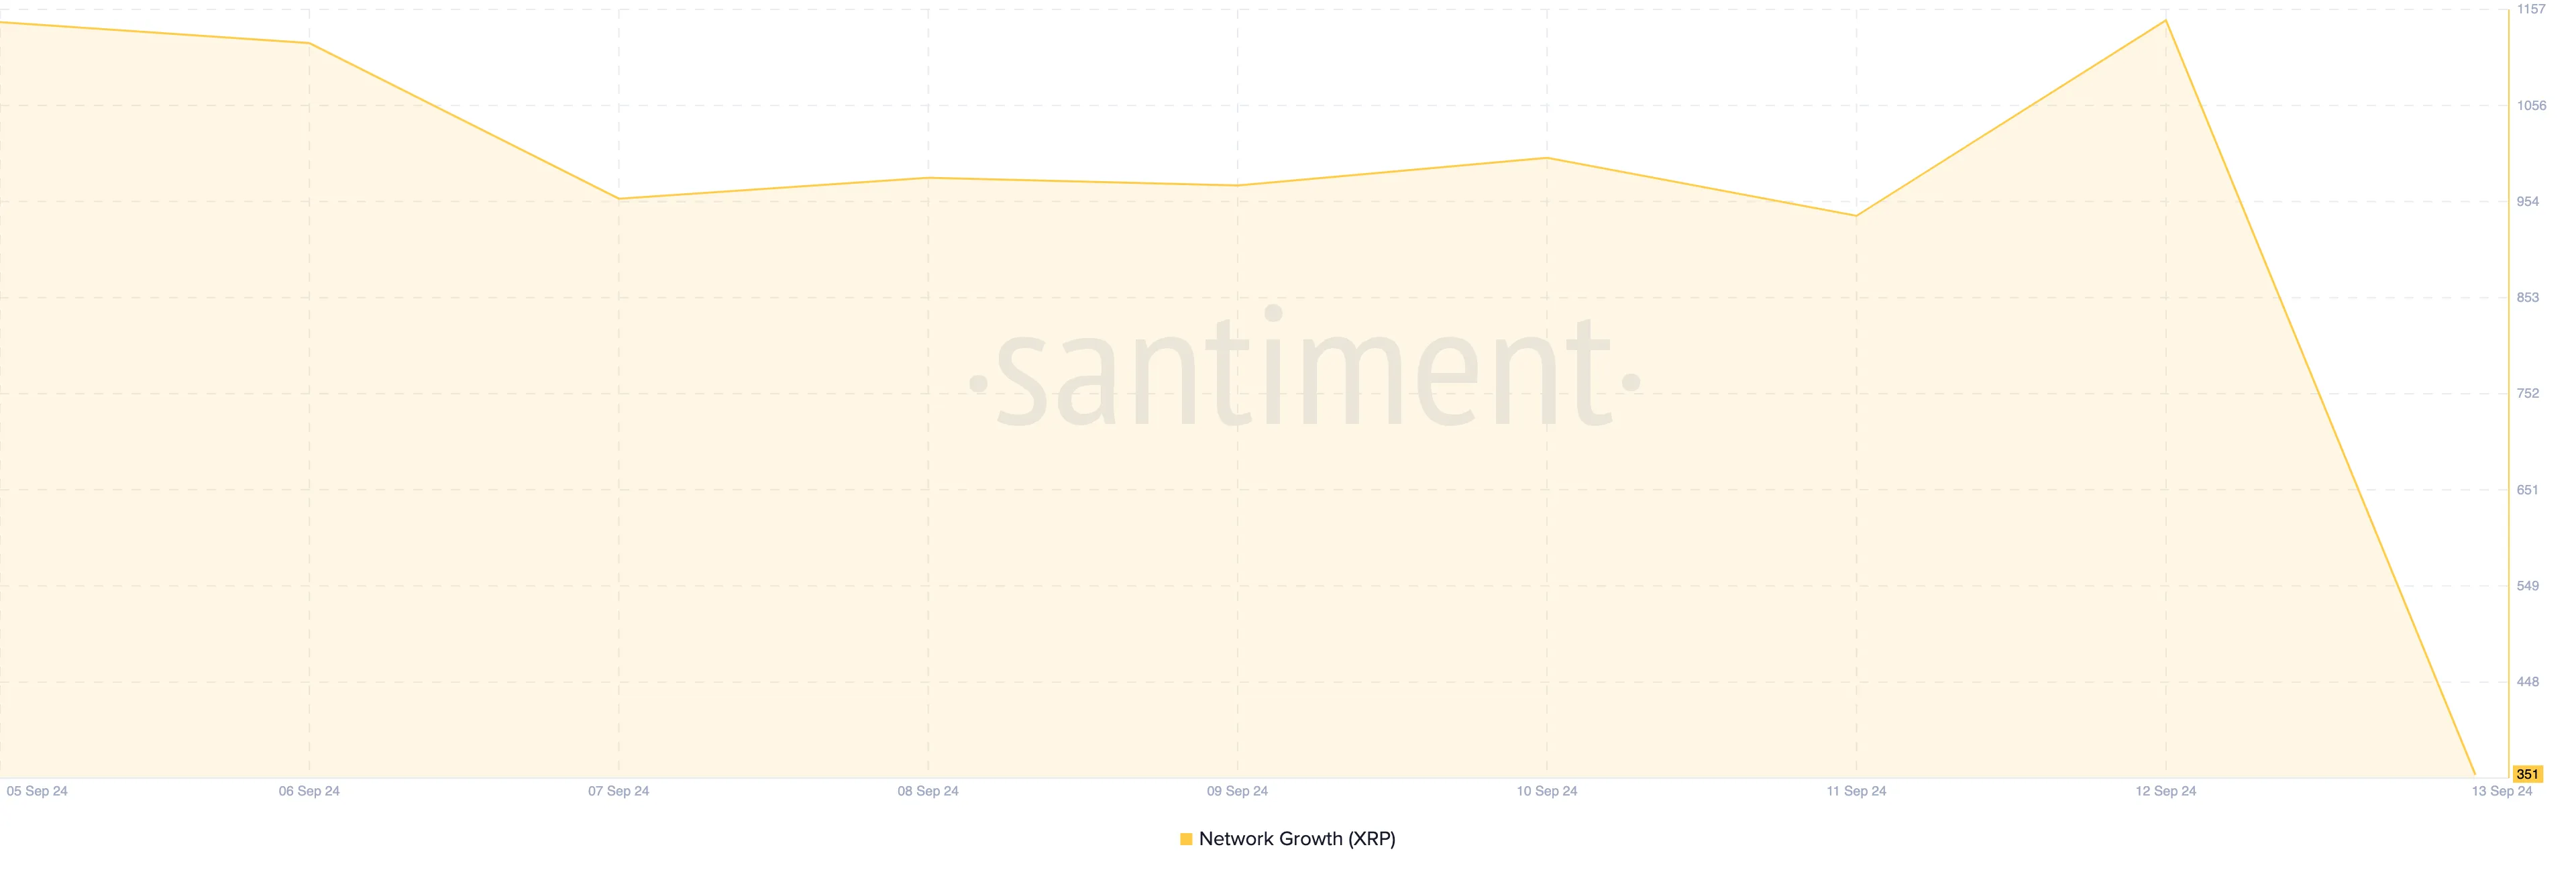
Supporting this outlook, the Network Growth metric aligns with this bearish bias. Following Grayscale’s announcement, the number of new addresses entering the XRP Ledger (XRPL) surged, indicating growing demand for XRP.
Yet, the number of new addresses with successful transactions has since decreased, suggesting XRP’s price might erase more of its recent gains.
XRP Price Prediction: Bearish Reversal Imminent
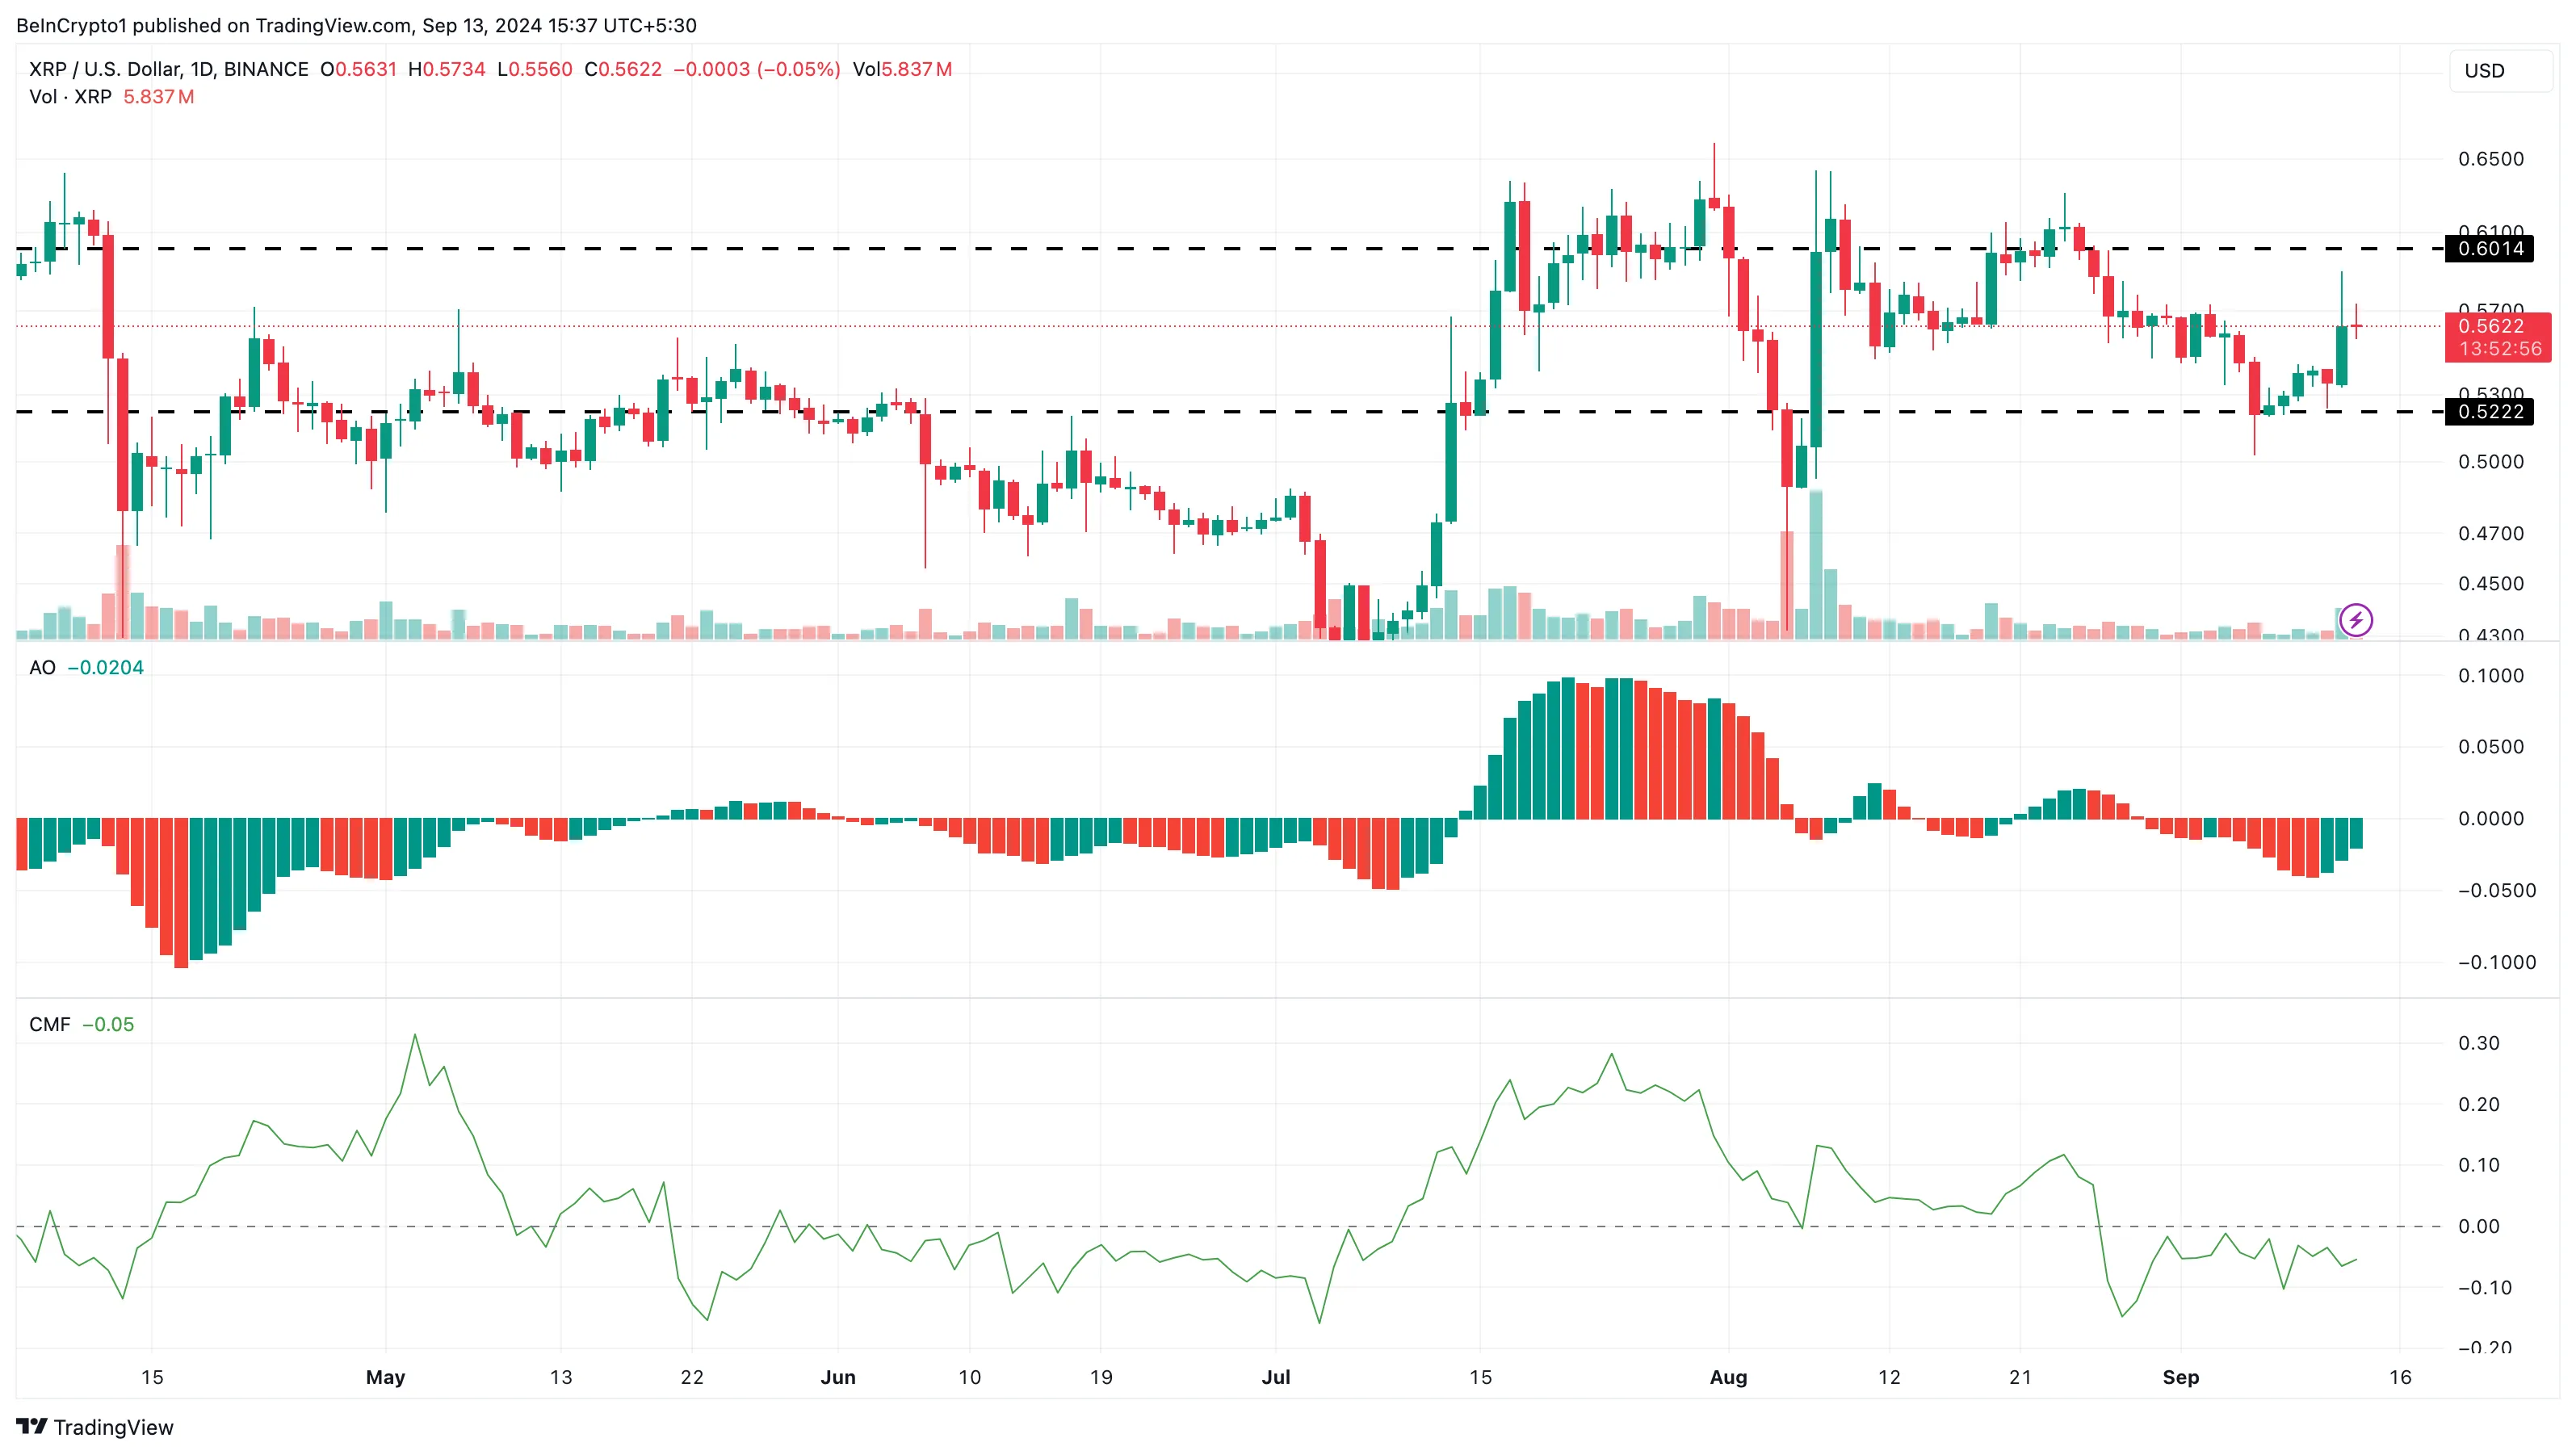
XRP’s price increase over the past 24 hours allowed it to outperform other top 10 cryptocurrencies. Despite this, the Chaikin Money Flow (CMF) on the daily chart remains in the negative region.
This negative CMF reading suggests that XRP’s distribution still exceeds accumulation, indicating a potential price decline. Similarly, the Awesome Oscillator (AO) is also in the negative zone, even though it shows green histogram bars.
The AO measures momentum, and while a positive reading signals bullish momentum, the current negative reading implies that bulls lack the strength to sustain or intensify the price increase. Given these conditions, XRP’s price could drop to $0.52 in the coming days.
Read more: Ripple (XRP) Price Prediction 2024/2025/2030
On the flip side, XRP could defy the bearish trend. If this happens, the uptrend may continue, potentially pushing the cryptocurrency’s value to $0.60.
Disclaimer
In line with the Trust Project guidelines, this price analysis article is for informational purposes only and should not be considered financial or investment advice. BeInCrypto is committed to accurate, unbiased reporting, but market conditions are subject to change without notice. Always conduct your own research and consult with a professional before making any financial decisions. Please note that our Terms and Conditions, Privacy Policy, and Disclaimers have been updated.


The meme coin market is experiencing a surge in investor interest, helping certain tokens recover from their all-time lows (ATLs). Memecoin (MEME) is one such token that has avoided a new ATL and also posted a significant 73% rise.
BeInCrypto has analyzed two other meme coins that have performed well over the past day, making them important tokens to watch.
Memecoin (MEME)
- Launch Date – November 2023
- Total Circulating Supply – 43.11 Billion MEME
- Maximum Supply – 69 Billion MEME
- Fully Diluted Valuation (FDV) – $135.37 Million
MEME had a rough week, hitting a new all-time low at $0.00137. However, the altcoin rebounded sharply, rising by 38% in the last 24 hours to trade at $0.00196. This surge marks a significant recovery, driven by renewed interest in meme coins.
The recent surge in MEME’s price was fueled by a sudden spike in interest for joke tokens, driving a 73% intraday high. To maintain its gains, MEME must successfully breach and flip the $0.00228 resistance into support, a critical level for sustaining its upward momentum.
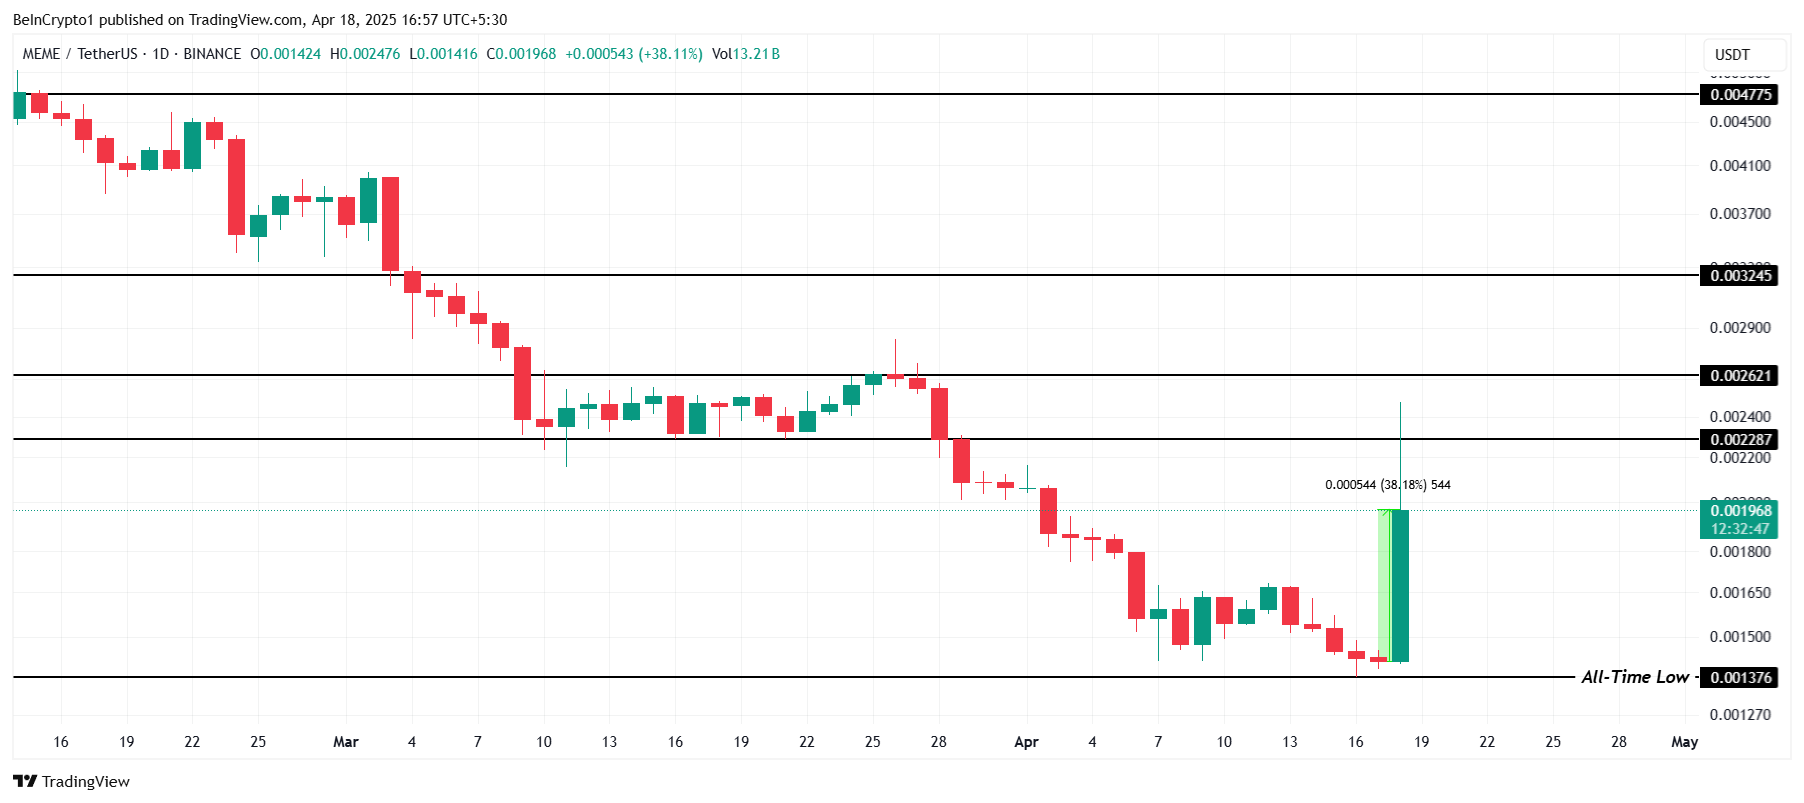
If MEME experiences profit-taking from investors, it could reverse course and drop back down to the all-time low of $0.00137. A decline through this level would invalidate the bullish outlook and signal further challenges for the meme coin.
Bone ShibaSwap (BONE)
- Launch Date – July 2021
- Total Circulating Supply – 249.89 Million BONE
- Maximum Supply – 250 Million BONE
- Fully Diluted Valuation (FDV) – $71.67 Million
BONE posted an impressive 18.5% rise over the last 24 hours, trading at $0.285. The altcoin is currently under the key resistance of $0.295. Given the recent momentum, it seems poised to breach this level, signaling a potential upward trajectory for the token in the near future.
Flipping the $0.295 resistance into support would open the door for BONE to target its next major resistance at $0.348. A sustained push above this level could drive further bullish sentiment, propelling the token toward even higher price levels.

However, if BONE fails to breach $0.295, the bullish momentum could fade. A decline from this point could send the meme coin back towards $0.232, invalidating the optimistic outlook. Such a reversal would likely create caution among investors, delaying potential upward movement.
- Launch Date – April 2024
- Total Circulating Supply – 999.96 Million BAN
- Maximum Supply – 1 Billion BAN
- Fully Diluted Valuation (FDV) – $40.54 Million
BAN, a small-cap token, has caught the attention of investors, rising nearly 25% in the last 24 hours to trade at $0.040. This surge highlights the growing interest in the meme coin market, with BAN standing out despite its smaller market capitalization.
Inspired by the infamous banana taped to a wall, BAN gained significant fame after being purchased by Tron’s founder, Justin Sun, for $6.2 million last year. If the token continues its upward momentum, it could breach the $0.045 barrier and potentially flip it into support, securing its gains.

However, failing to break through the $0.045 resistance could lead to a drop back to $0.032. If this occurs, it would invalidate the bullish outlook and erase the recent gains, putting investors on alert for further price declines.
Disclaimer
In line with the Trust Project guidelines, this price analysis article is for informational purposes only and should not be considered financial or investment advice. BeInCrypto is committed to accurate, unbiased reporting, but market conditions are subject to change without notice. Always conduct your own research and consult with a professional before making any financial decisions. Please note that our Terms and Conditions, Privacy Policy, and Disclaimers have been updated.

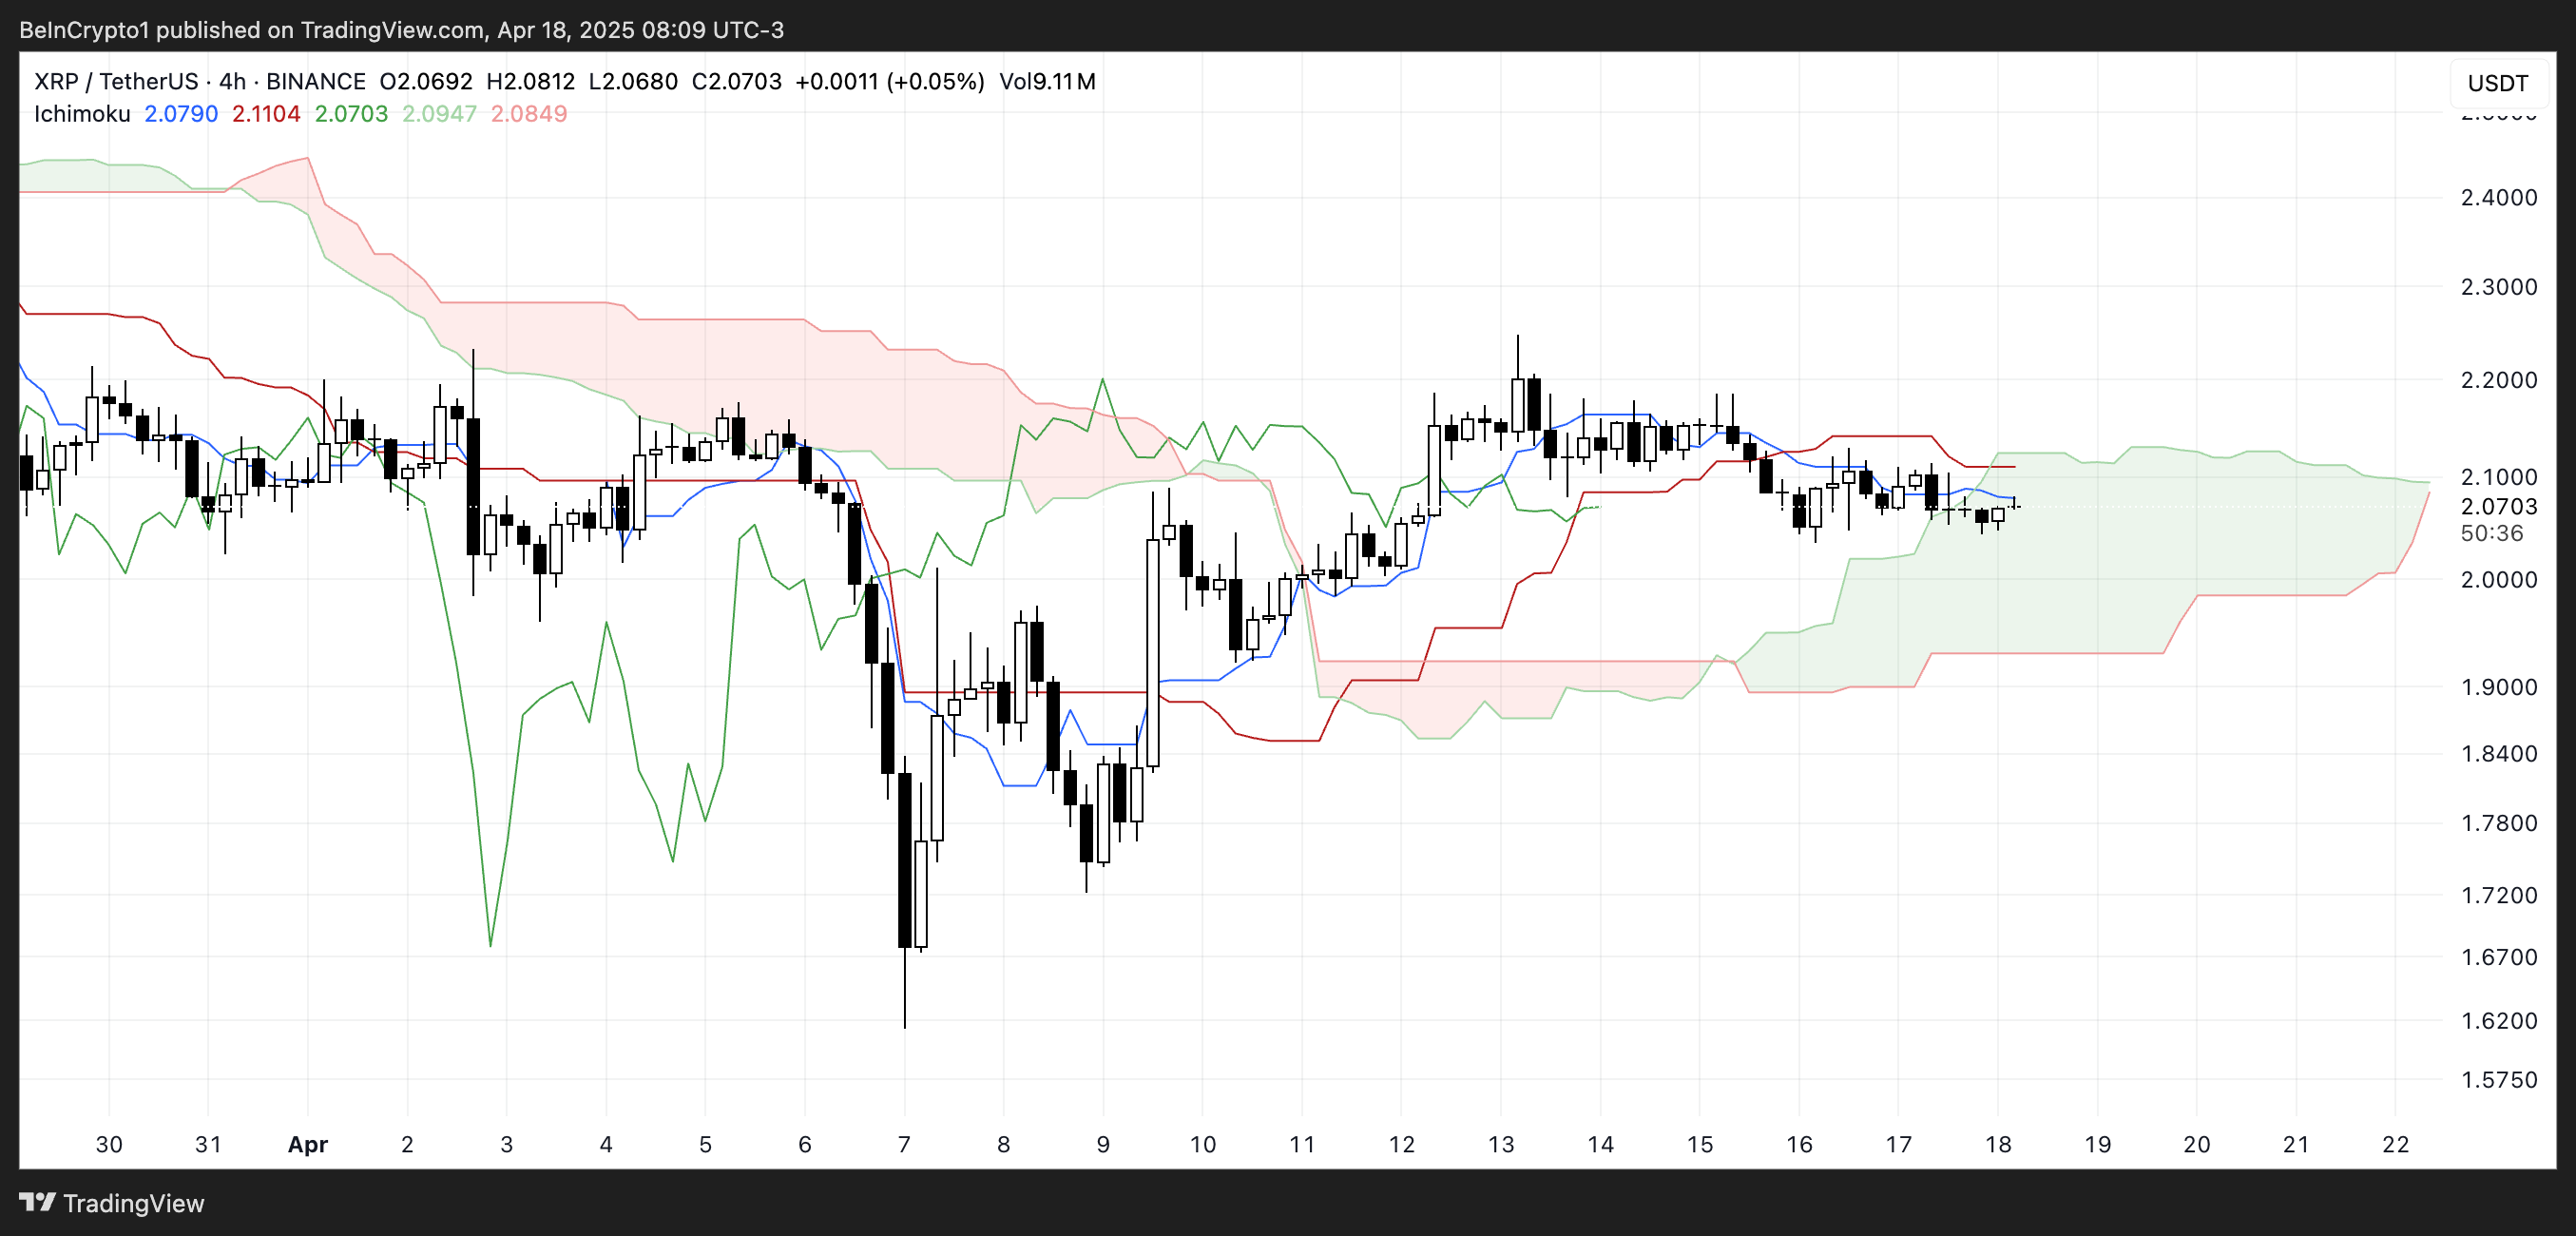
XRP is currently showing signs of indecision, trading sideways with limited momentum as traders await a clearer signal. Over the past 24 hours, XRP’s trading volume has dropped by 20.37%, now sitting at $2.4 billion—a decline that reflects cooling interest in the short term.
Technical indicators like the RSI and Ichimoku Cloud suggest a neutral trend, with no strong bullish or bearish dominance in play. Price action remains confined between key support and resistance levels, leaving the next breakout direction still uncertain.
Neutral RSI Reading Suggests Caution for XRP Traders
XRP’s Relative Strength Index (RSI) is currently sitting at 46.82, signaling neutral momentum in the market. This neutral zone has persisted since April 7, with no significant shifts into either overbought or oversold territory.
Notably, the RSI was at 57.30 just three days ago, indicating that XRP has experienced a recent decline in buying pressure.
The drop suggests cooling interest or a possible shift in sentiment among traders, as the asset now hovers closer to the midpoint of the RSI scale.

The RSI is a momentum oscillator that measures the speed and magnitude of recent price changes, typically on a scale from 0 to 100.
Readings above 70 often suggest an asset is overbought and could be due for a pullback, while readings below 30 indicate it may be oversold and potentially poised for a bounce. With XRP now at 46.82, the asset is neither overbought nor oversold, implying indecision in the market.
This level, combined with the recent dip from 57.30, may signal growing caution or weakening bullish momentum. It could potentially point to a consolidation phase or slight downward pressure in the short term unless buyers re-enter with conviction.
Ichimoku Indicators Show Indecision in XRP’s Price Action
XRP is currently trading inside the Ichimoku Cloud, reflecting a state of indecision or consolidation.
The Tenkan-sen (blue line) and Kijun-sen (red line) are flat and closely aligned, suggesting weak momentum and a lack of short-term trend direction.
The Senkou Span A and B (the cloud boundaries) are relatively flat as well, which typically indicates that the market is in equilibrium without strong pressure from either buyers or sellers.
The Ichimoku Cloud, or Kumo, helps visualize support, resistance, and trend direction at a glance. When the price is above the cloud, the trend is considered bullish; below it, bearish.
Inside the cloud, as XRP currently is, the trend is neutral, and volatility often contracts. The flatness of the cloud’s leading edges implies a consolidation phase, and the fact that price is not breaking clearly above or below the cloud reinforces the idea of market uncertainty.
For now, the lack of a decisive breakout suggests XRP could remain range-bound until a stronger trend develops.
$2.03 Support and $2.09 Resistance Hold the Key to XRP’s Next Move
XRP price is currently trading within a narrow consolidation range, with key support at $2.03 and resistance at $2.09.
The price action has been relatively muted, but the EMA lines are starting to show signs of potential weakness, as a death cross—where the short-term EMA crosses below the long-term EMA—appears to be forming.
If this bearish crossover confirms and XRP breaks below the $2.03 support, a move down to $1.96 becomes increasingly likely.

A strong continuation of the downtrend could trigger a steeper drop. It could potentially drive the price as low as $1.61 if selling pressure accelerates.
However, there’s still a bullish scenario on the table. If buyers manage to push XRP above the $2.09 resistance, it could open the door for a retest of the $2.17 and $2.35 levels.
This would indicate renewed strength and a shift in momentum in favor of the bulls. Should the rally gain traction beyond these levels, XRP could make a run toward $2.50, marking a significant recovery.
Disclaimer
In line with the Trust Project guidelines, this price analysis article is for informational purposes only and should not be considered financial or investment advice. BeInCrypto is committed to accurate, unbiased reporting, but market conditions are subject to change without notice. Always conduct your own research and consult with a professional before making any financial decisions. Please note that our Terms and Conditions, Privacy Policy, and Disclaimers have been updated.

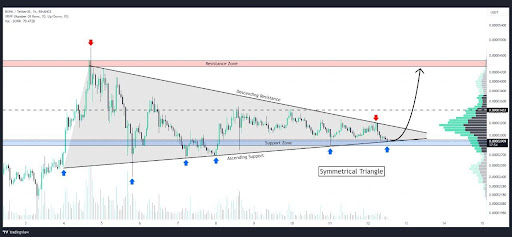
Bonk (BONK), one of the more energetic players in the meme coin space, is showing signs of a potentially explosive move as it coils tighter within a symmetrical triangle pattern. This classic chart formation, characterized by converging trendlines of lower highs and higher lows, often acts as a pressure booster for price action — the longer the squeeze, the more powerful the breakout tends to be.
The symmetrical triangle squeeze is a technical signal that often precedes sharp breakouts, and in BONK’s case, it couldn’t come at a more pivotal moment. With the broader meme coin market showing signs of strength and sentiment slowly shifting, a decisive move from this setup could define the next chapter for BONK. A breakout above the upper trendline might ignite fresh bullish momentum and open the door to new highs, while a break below support could trigger a sell-off toward lower key levels.
Bonk’s Recent Price Action: The Setup For A Big Move
According to a recent post by Whales_Crypto_Trading on X (formerly Twitter), Bonk is currently forming a symmetrical triangle pattern on the 1-hour chart. The price has just rebounded from the lower support trendline of the triangle, suggesting that buyers are stepping in to defend the structure and potentially build momentum for an upward breakout.
What makes this pattern particularly noteworthy is the potential upside. Whales_Crypto_Trading highlighted a profit target range of 70–80%, should BONK successfully break above the upper resistance trendline. With volatility tightening and volume starting to show signs of recovery, such a breakout could offer a substantial short-term trading opportunity.
However, traders are advised to keep a close eye on volume confirmation and key breakout levels to avoid possible fakeouts, as symmetrical triangles can break in either direction.
Will The Meme Coin Explode Or Fizzle Out?
Bonk’s symmetrical triangle pattern has reached a critical stage, raising speculations about whether the meme coin will break free with force or lose steam under pressure. The recent bounce off the support trendline suggests bullish interest is still alive, and if momentum continues to build, BONK could be gearing up for a powerful breakout, potentially delivering gains in the 70–80% range as projected by traders.
However, it’s important to remain cautious. Symmetrical triangles are neutral by nature, meaning a breakdown is still on the table if buyers fail to push through resistance. The next few candles on the 1-hour chart could provide key confirmation of BONK’s direction.
In the end, BONK is approaching a defining moment. Whether it explodes into a bullish run or fizzles out into another rejection will largely depend on volume, sentiment, and the strength of the breakout. Traders should stay alert, as a big move may be closer than it seems.

MEME Rallies 73%, BONE Follows

Canary Capital Files For Staked Tron ETF

XRP Volume Plunges 20% Amid Market Uncertainty

BONK Symmetrical Triangle Squeeze: Is A Mega Breakout Imminent?

XRP Price History Signals July As The Next Bullish Month
BANK Token Surges 150% After Binance Futures Listing

2.52 Million Altcoins Are Ruining Crypto’s Future

Animoca Brands Valuation Tanks 75% In Two Years, Here’s Why

Crypto exchange BingX hacked for $43 million

Are The Big Players Losing Interest?

Hong Kong’s Securities Association Tips Authorities On Crypto Self-Regulation

Coinbase cbBTC Set to go Live on Solana
2.52 Million Altcoins Are Ruining Crypto’s Future
Animoca Brands Valuation Tanks 75% In Two Years, Here’s Why
Crypto exchange BingX hacked for $43 million
Are The Big Players Losing Interest?
Hong Kong’s Securities Association Tips Authorities On Crypto Self-Regulation
Coinbase cbBTC Set to go Live on Solana
-
 Altcoin21 hours ago
Tron Founder Justin Sun Reveals Plan To HODL Ethereum Despite Price Drop
-

 Market18 hours ago
Ethereum Price Fights for Momentum—Traders Watch Key Resistance
-

 Market24 hours ago
Crypto Ignores ECB Rate Cuts, Highlighting EU’s Fading Influence
-
 Altcoin18 hours ago
Expert Predicts Pi Network Price Volatility After Shady Activity On Banxa
-

 Market23 hours ago
Binance Leads One-Third of the CEX Market in Q1 2025
-

 Market16 hours ago
Is XRP’s Low Price Part of Ripple’s Long-Term Growth Strategy?
-

 Altcoin22 hours ago
Dogecoin Price Breakout in view as Analyst Predicts $5.6 high
-

 Ethereum21 hours ago
Ethereum Investors Suffer More Losses Than Bitcoin Amid Ongoing Market Turmoil