
Market
XRP Bulls on Edge—Could the Downtrend Continue?

XRP price started a fresh decline below the $2.650 resistance. The price is now consolidating losses and might face resistance near the $2.550 zone.
- XRP price started a fresh decline below the $2.650 zone.
- The price is now trading above $2.40 and the 100-hourly Simple Moving Average.
- There is a short-term rising channel forming with support at $2.40 on the hourly chart of the XRP/USD pair (data source from Kraken).
- The pair might continue to move down if it remains below the $2.550 resistance zone.
XRP Price Faces Resistance
XRP price started a fresh decline from the $3.00 resistance, like Bitcoin and Ethereum. The price dipped below the $2.80 and $2.60 levels.
The bears were able to push the price below the 50% Fib retracement level of the upward move from the $1.95 swing low to the $3.00 high. Finally, the bulls appeared near the $2.20 support zone. A base is forming and the price is now attempting to recover above $2.30.
The price is now trading above $2.40 and the 100-hourly Simple Moving Average. There is also a short-term rising channel forming with support at $2.40 on the hourly chart of the XRP/USD pair.
On the upside, the price might face resistance near the $2.550 level. The first major resistance is near the $2.650 level. The next resistance is $2.750. A clear move above the $2.750 resistance might send the price toward the $2.80 resistance.

Any more gains might send the price toward the $2.880 resistance or even $2.920 in the near term. The next major hurdle for the bulls might be $3.00.
Another Decline?
If XRP fails to clear the $2.550 resistance zone, it could start another decline. Initial support on the downside is near the $2.40 level. The next major support is near the $2.320 level.
If there is a downside break and a close below the $2.320 level, the price might continue to decline toward the $2.20 support and the 76.4% Fib retracement level of the upward move from the $1.95 swing low to the $3.00 high. The next major support sits near the $2.120 zone.
Technical Indicators
Hourly MACD – The MACD for XRP/USD is now losing pace in the bearish zone.
Hourly RSI (Relative Strength Index) – The RSI for XRP/USD is now above the 50 level.
Major Support Levels – $2.40 and $2.320.
Major Resistance Levels – $2.550 and $2.750.


Aayush Jindal, a luminary in the world of financial markets, whose expertise spans over 15 illustrious years in the realms of Forex and cryptocurrency trading. Renowned for his unparalleled proficiency in providing technical analysis, Aayush is a trusted advisor and senior market expert to investors worldwide, guiding them through the intricate landscapes of modern finance with his keen insights and astute chart analysis.
From a young age, Aayush exhibited a natural aptitude for deciphering complex systems and unraveling patterns. Fueled by an insatiable curiosity for understanding market dynamics, he embarked on a journey that would lead him to become one of the foremost authorities in the fields of Forex and crypto trading. With a meticulous eye for detail and an unwavering commitment to excellence, Aayush honed his craft over the years, mastering the art of technical analysis and chart interpretation.
As a software engineer, Aayush harnesses the power of technology to optimize trading strategies and develop innovative solutions for navigating the volatile waters of financial markets. His background in software engineering has equipped him with a unique skill set, enabling him to leverage cutting-edge tools and algorithms to gain a competitive edge in an ever-evolving landscape.
In addition to his roles in finance and technology, Aayush serves as the director of a prestigious IT company, where he spearheads initiatives aimed at driving digital innovation and transformation. Under his visionary leadership, the company has flourished, cementing its position as a leader in the tech industry and paving the way for groundbreaking advancements in software development and IT solutions.
Despite his demanding professional commitments, Aayush is a firm believer in the importance of work-life balance. An avid traveler and adventurer, he finds solace in exploring new destinations, immersing himself in different cultures, and forging lasting memories along the way. Whether he’s trekking through the Himalayas, diving in the azure waters of the Maldives, or experiencing the vibrant energy of bustling metropolises, Aayush embraces every opportunity to broaden his horizons and create unforgettable experiences.
Aayush’s journey to success is marked by a relentless pursuit of excellence and a steadfast commitment to continuous learning and growth. His academic achievements are a testament to his dedication and passion for excellence, having completed his software engineering with honors and excelling in every department.
At his core, Aayush is driven by a profound passion for analyzing markets and uncovering profitable opportunities amidst volatility. Whether he’s poring over price charts, identifying key support and resistance levels, or providing insightful analysis to his clients and followers, Aayush’s unwavering dedication to his craft sets him apart as a true industry leader and a beacon of inspiration to aspiring traders around the globe.
In a world where uncertainty reigns supreme, Aayush Jindal stands as a guiding light, illuminating the path to financial success with his unparalleled expertise, unwavering integrity, and boundless enthusiasm for the markets.
Even as crypto markets try to put on a brave face this week, institutional investors clearly are not buying it. Yesterday, Bitcoin spot ETFs recorded another round of outflows, marking the sixth straight day of capital flight from these funds.
Despite the broader market’s attempt at a short-term rebound, the continued withdrawals suggest that institutional sentiment remains cautious. The consistent outflows paint a picture of investors seeking safety or perhaps just sitting on the sidelines while volatility does its thing.
Bitcoin ETFs Continue Losing Streak
On Thursday, net outflows from BTC ETFs totaled $149.66 million, reflecting a 17% increase from the $127.12 million in outflows seen on Wednesday.
This marked the sixth consecutive day of withdrawals from spot Bitcoin ETF funds, highlighting the growing caution and weakening sentiment among institutional BTC investors.
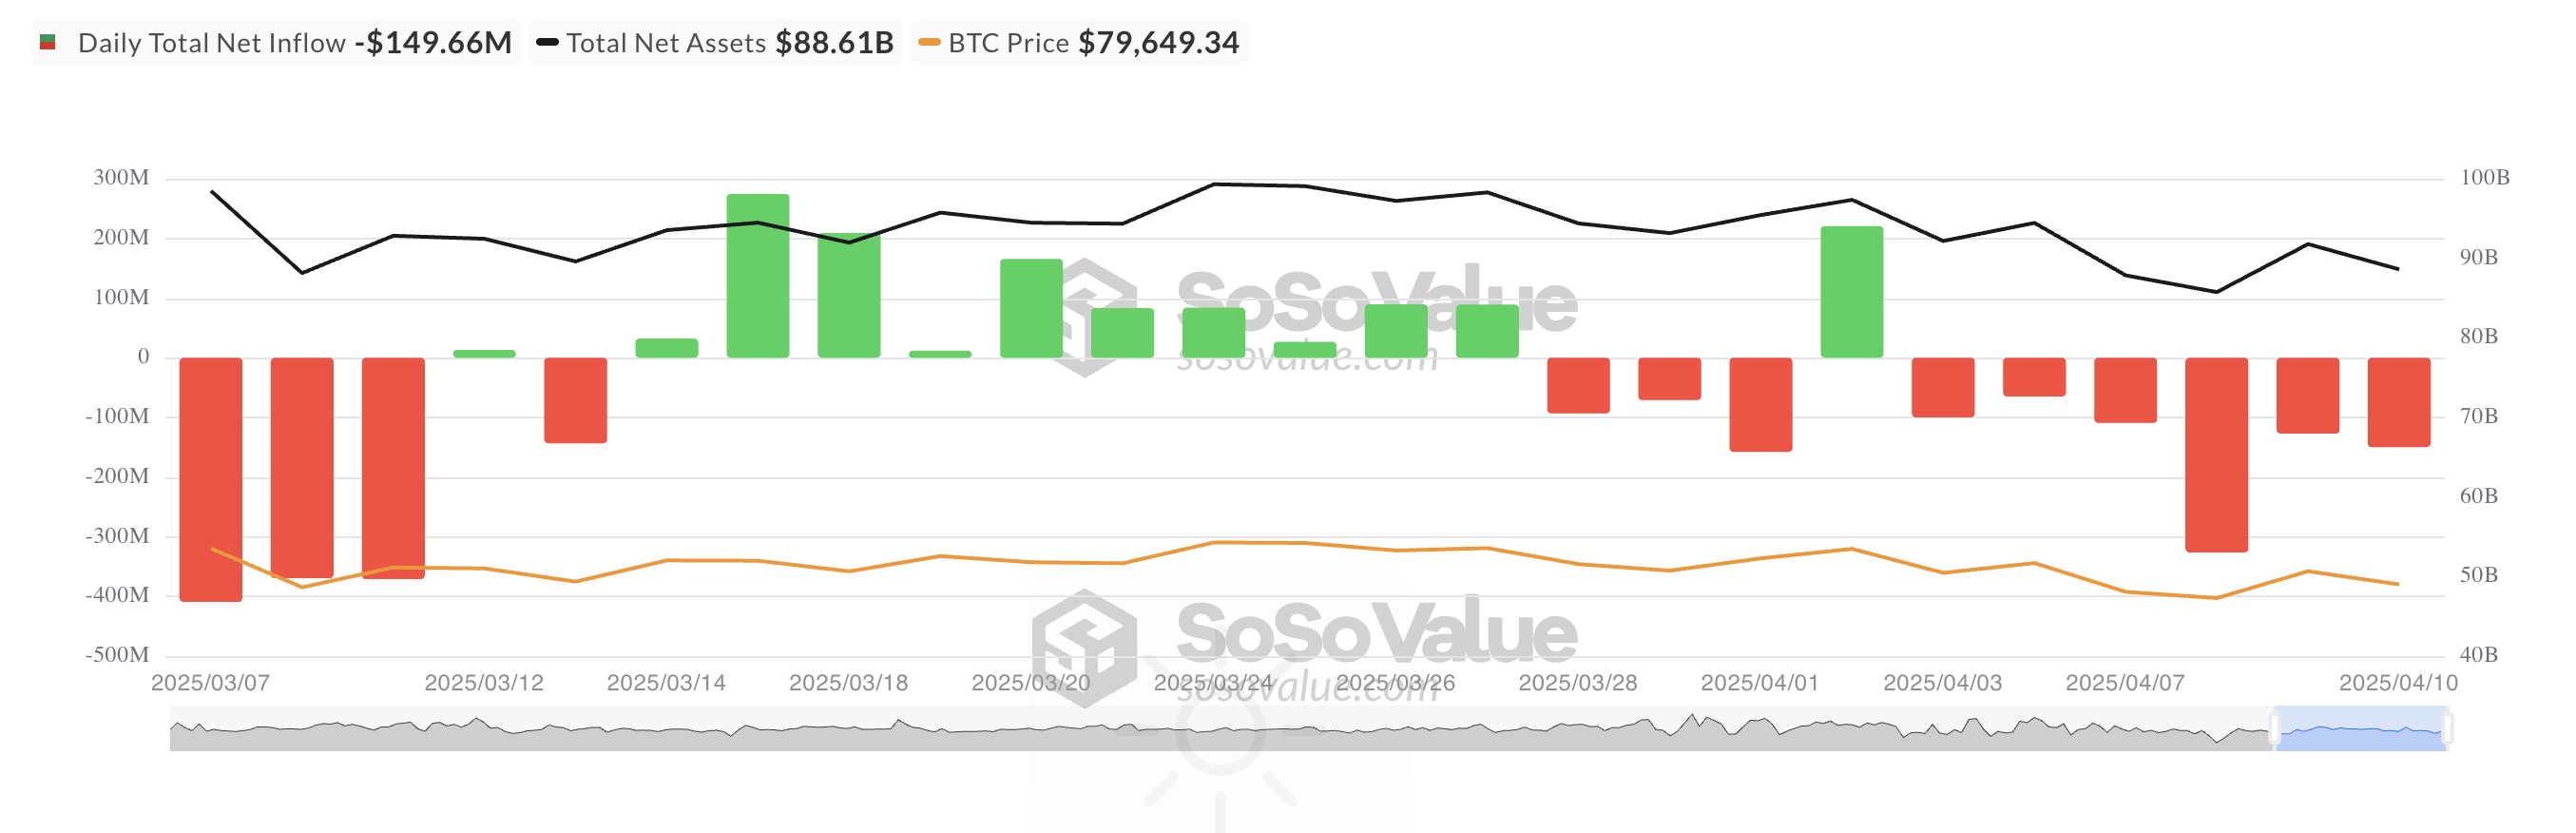
According to SosoValue, Grayscale Bitcoin Mini Trust ETF $BTC recorded the highest net inflow on that day, totaling $9.87 million, bringing the fund’s historical net inflow to $1.15 billion.
On the other hand, Fidelity’s ETF FBTC witnessed the highest net outflow on Wednesday, totaling $74.67 million. As of this writing, its total historical net inflow is $11.40 billion.
Derivatives Market Remain Optimistic
Meanwhile, BTC futures open interest has taken a modest hit, in line with the broader market dip. At press time, it stands at $51.73 billion, falling by 7% over the past day. This comes amid the decline in broader cryptocurrency market activity over the past 24 hours, during which BTC’s value has dipped by 2%.

A drop in open interest during a price decline suggests that traders are closing out positions rather than opening new ones. This indicates a possible bottoming phase or reduced volatility ahead.
But the story doesn’t end there.
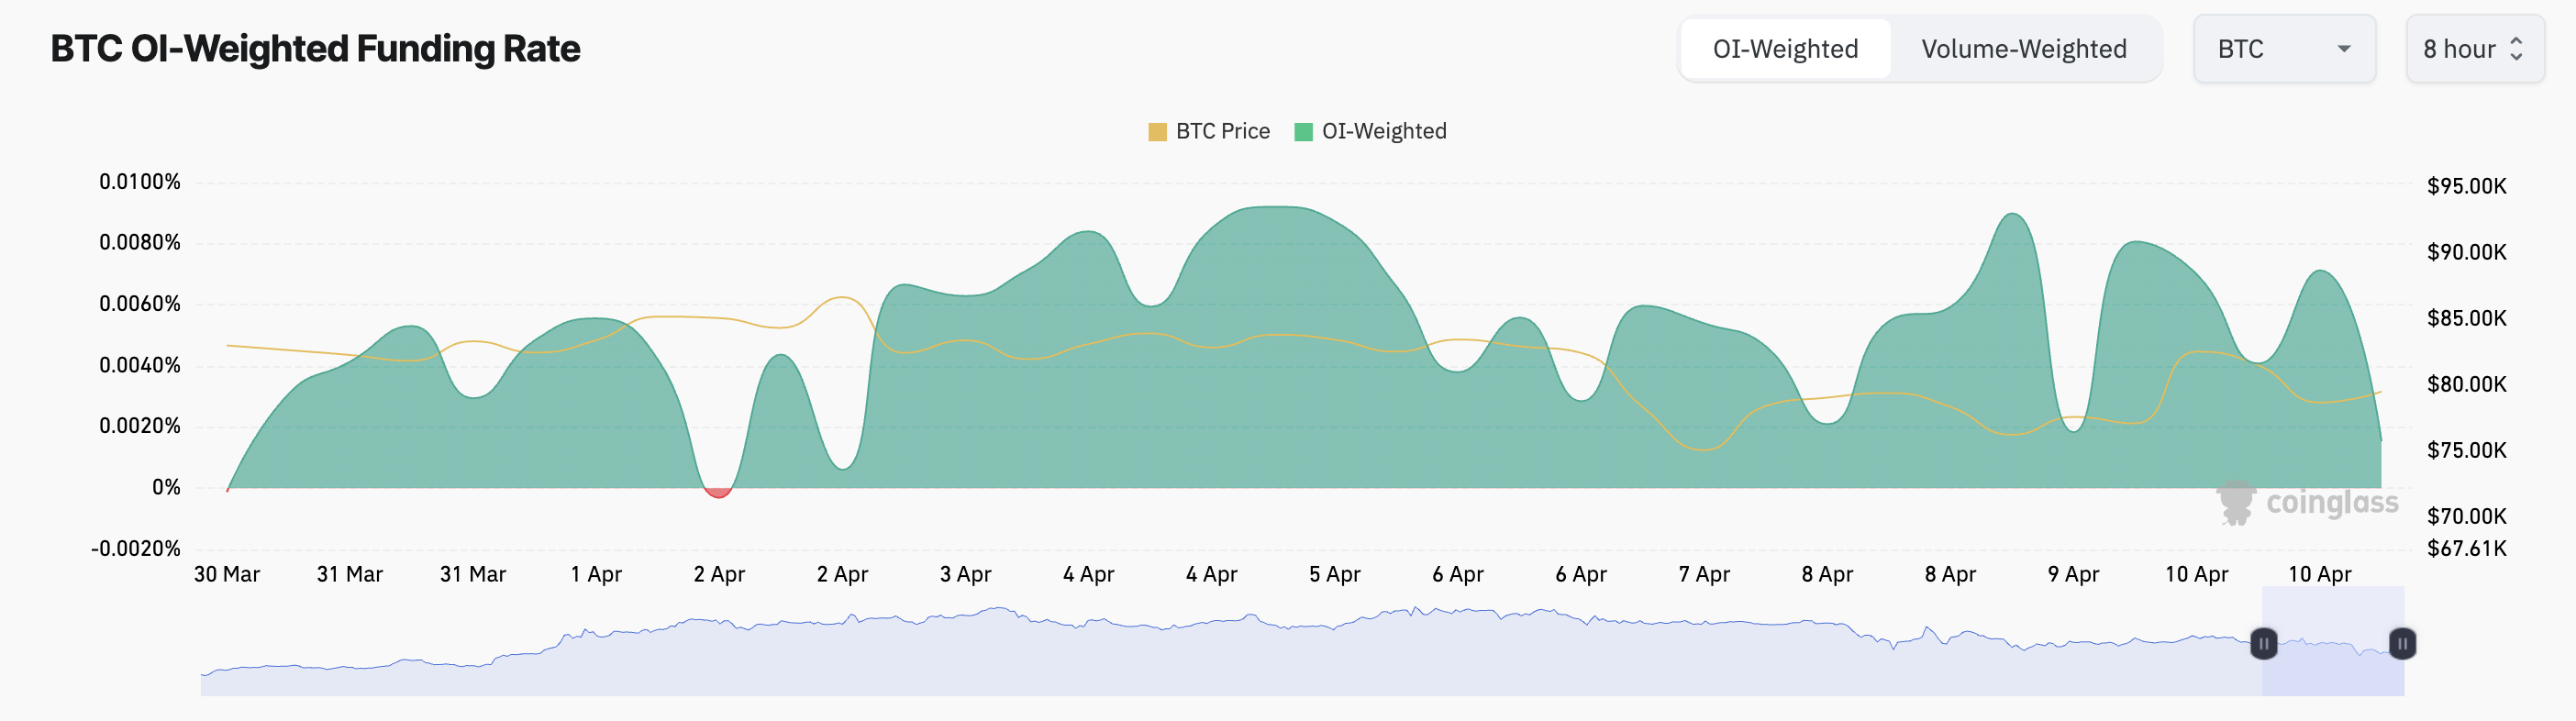
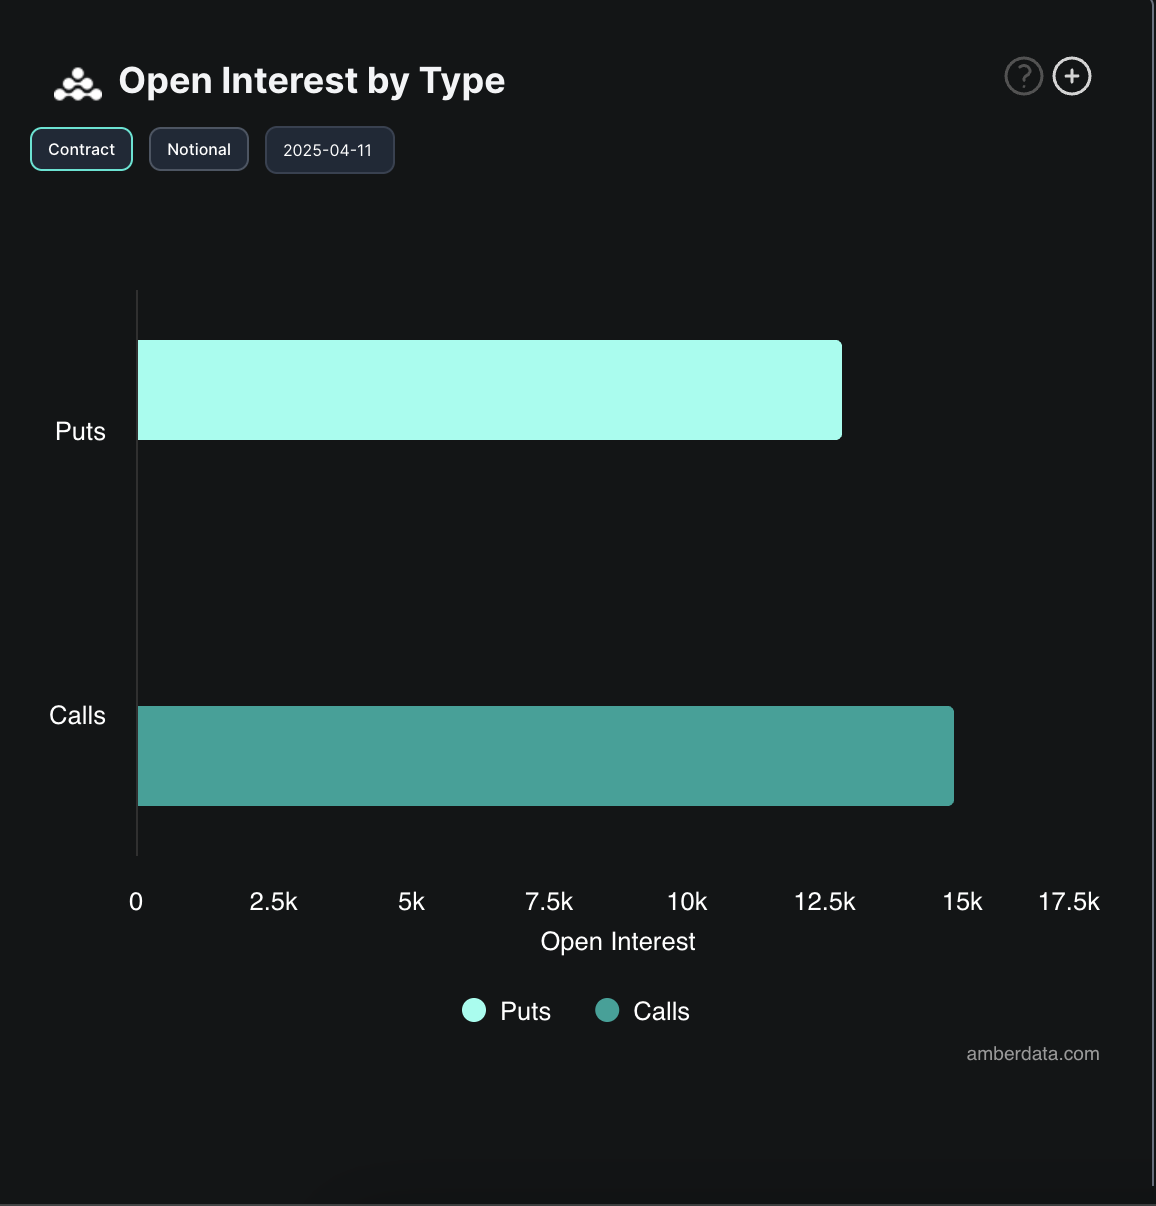
Funding rates remain positive, and call options are in high demand, both considered bullish signals.
At press time, BTC’s funding rate stands at 0.0015%. The funding rate is a recurring payment exchanged between long and short traders in perpetual futures markets to keep contract prices aligned with the spot market. A positive funding rate like this indicates that long traders pay short traders, signaling that bullish sentiment is dominant.
In the options market, there is a high demand for calls over puts, further reflecting a bullish bias toward BTC.
The divergence between ETF flows and derivatives activity recorded this week suggests that while traditional institutions may be scaling back exposure, retail and leveraged traders continue to bet on rebounds.
Disclaimer
In line with the Trust Project guidelines, this price analysis article is for informational purposes only and should not be considered financial or investment advice. BeInCrypto is committed to accurate, unbiased reporting, but market conditions are subject to change without notice. Always conduct your own research and consult with a professional before making any financial decisions. Please note that our Terms and Conditions, Privacy Policy, and Disclaimers have been updated.

Aayush Jindal, a luminary in the world of financial markets, whose expertise spans over 15 illustrious years in the realms of Forex and cryptocurrency trading. Renowned for his unparalleled proficiency in providing technical analysis, Aayush is a trusted advisor and senior market expert to investors worldwide, guiding them through the intricate landscapes of modern finance with his keen insights and astute chart analysis.
From a young age, Aayush exhibited a natural aptitude for deciphering complex systems and unraveling patterns. Fueled by an insatiable curiosity for understanding market dynamics, he embarked on a journey that would lead him to become one of the foremost authorities in the fields of Forex and crypto trading. With a meticulous eye for detail and an unwavering commitment to excellence, Aayush honed his craft over the years, mastering the art of technical analysis and chart interpretation.
As a software engineer, Aayush harnesses the power of technology to optimize trading strategies and develop innovative solutions for navigating the volatile waters of financial markets. His background in software engineering has equipped him with a unique skill set, enabling him to leverage cutting-edge tools and algorithms to gain a competitive edge in an ever-evolving landscape.
In addition to his roles in finance and technology, Aayush serves as the director of a prestigious IT company, where he spearheads initiatives aimed at driving digital innovation and transformation. Under his visionary leadership, the company has flourished, cementing its position as a leader in the tech industry and paving the way for groundbreaking advancements in software development and IT solutions.
Despite his demanding professional commitments, Aayush is a firm believer in the importance of work-life balance. An avid traveler and adventurer, he finds solace in exploring new destinations, immersing himself in different cultures, and forging lasting memories along the way. Whether he’s trekking through the Himalayas, diving in the azure waters of the Maldives, or experiencing the vibrant energy of bustling metropolises, Aayush embraces every opportunity to broaden his horizons and create unforgettable experiences.
Aayush’s journey to success is marked by a relentless pursuit of excellence and a steadfast commitment to continuous learning and growth. His academic achievements are a testament to his dedication and passion for excellence, having completed his software engineering with honors and excelling in every department.
At his core, Aayush is driven by a profound passion for analyzing markets and uncovering profitable opportunities amidst volatility. Whether he’s poring over price charts, identifying key support and resistance levels, or providing insightful analysis to his clients and followers, Aayush’s unwavering dedication to his craft sets him apart as a true industry leader and a beacon of inspiration to aspiring traders around the globe.
In a world where uncertainty reigns supreme, Aayush Jindal stands as a guiding light, illuminating the path to financial success with his unparalleled expertise, unwavering integrity, and boundless enthusiasm for the markets.
Which Altcoins Made Grayscale’s Q2 2025 Cut?

BNB Price Recovery in Motion—Uphill Battle Ahead Near Crucial $600 Level

BTC ETF Outflows Continue Amid Institutional Caution,
Over $2.5 Billion in Bitcoin and Ethereum Options Expire Today

BNB Chain Completes Lorentz Testnet Hardforks; Here’s The Timeline For Mainnet

XRP Price Ready to Run? Bulls Eyes Fresh Gains Amid Bullish Setup

2.52 Million Altcoins Are Ruining Crypto’s Future

Animoca Brands Valuation Tanks 75% In Two Years, Here’s Why

Crypto exchange BingX hacked for $43 million

Are The Big Players Losing Interest?

Hong Kong’s Securities Association Tips Authorities On Crypto Self-Regulation

Coinbase cbBTC Set to go Live on Solana
2.52 Million Altcoins Are Ruining Crypto’s Future
Animoca Brands Valuation Tanks 75% In Two Years, Here’s Why
Crypto exchange BingX hacked for $43 million
Are The Big Players Losing Interest?
Hong Kong’s Securities Association Tips Authorities On Crypto Self-Regulation
Coinbase cbBTC Set to go Live on Solana
-

 Altcoin23 hours ago
Will Q2 2025 Mark the Return of Altcoin Season?
-
 Altcoin22 hours ago
Analyst Reveals How XRP Price Can Hit $22 If BTC Rallies To This Level
-
 Bitcoin21 hours ago
Bullish Signal for Bitcoin in 2025?
-

 Market21 hours ago
Solana (SOL) Jumps But Smacks Into $120 Resistance Wall—Can It Break Through?
-
 Market20 hours ago
Onyxcoin Buyers Drive Strong Demand as XCN Surges Past $0.01
-

 Altcoin20 hours ago
Binance Lists BABY As Bitcoin Protocol Babylon Goes Live
-

 Market16 hours ago
Fuser on How Crypto Regulation in Europe is Finally Catching Up
-

 Market18 hours ago
Solana Price Attempts Recovery, Nears $120, But Needs A Push