
Market
Will Solana Reach $200 After Breaking Key Resistance?

Solana’s (SOL) price has reached $180 for the first time since July, igniting speculation that the altcoin might be set for an extended breakout. This upward momentum coincides with surging investor interest, but the question remains: will Solana reach $200?
While traders eagerly anticipate this breakout, technical indicators suggest that a pullback may be imminent before SOL can continue its ascent.
Solana Becomes Overbought After Impressive Hike
One key indicator warning of a pullback for Solana is the Chaikin Money Flow (CMF), which measures buying and selling pressure on an asset.
A decreasing CMF, especially during a price rise, signals weakening buying pressure. Conversely, a rising CMF during an upward trend indicates strong buying support. The CMF also reveals whether an asset is overbought or oversold.
Typically, readings above 0.20 indicate an overbought condition, while readings below -0.20 suggest oversold status. In Solana’s case, the CMF recently hit 0.28, indicating that the upward price movement has received sufficient buying volume.
Read more: How to Buy Solana (SOL) and Everything You Need to Know
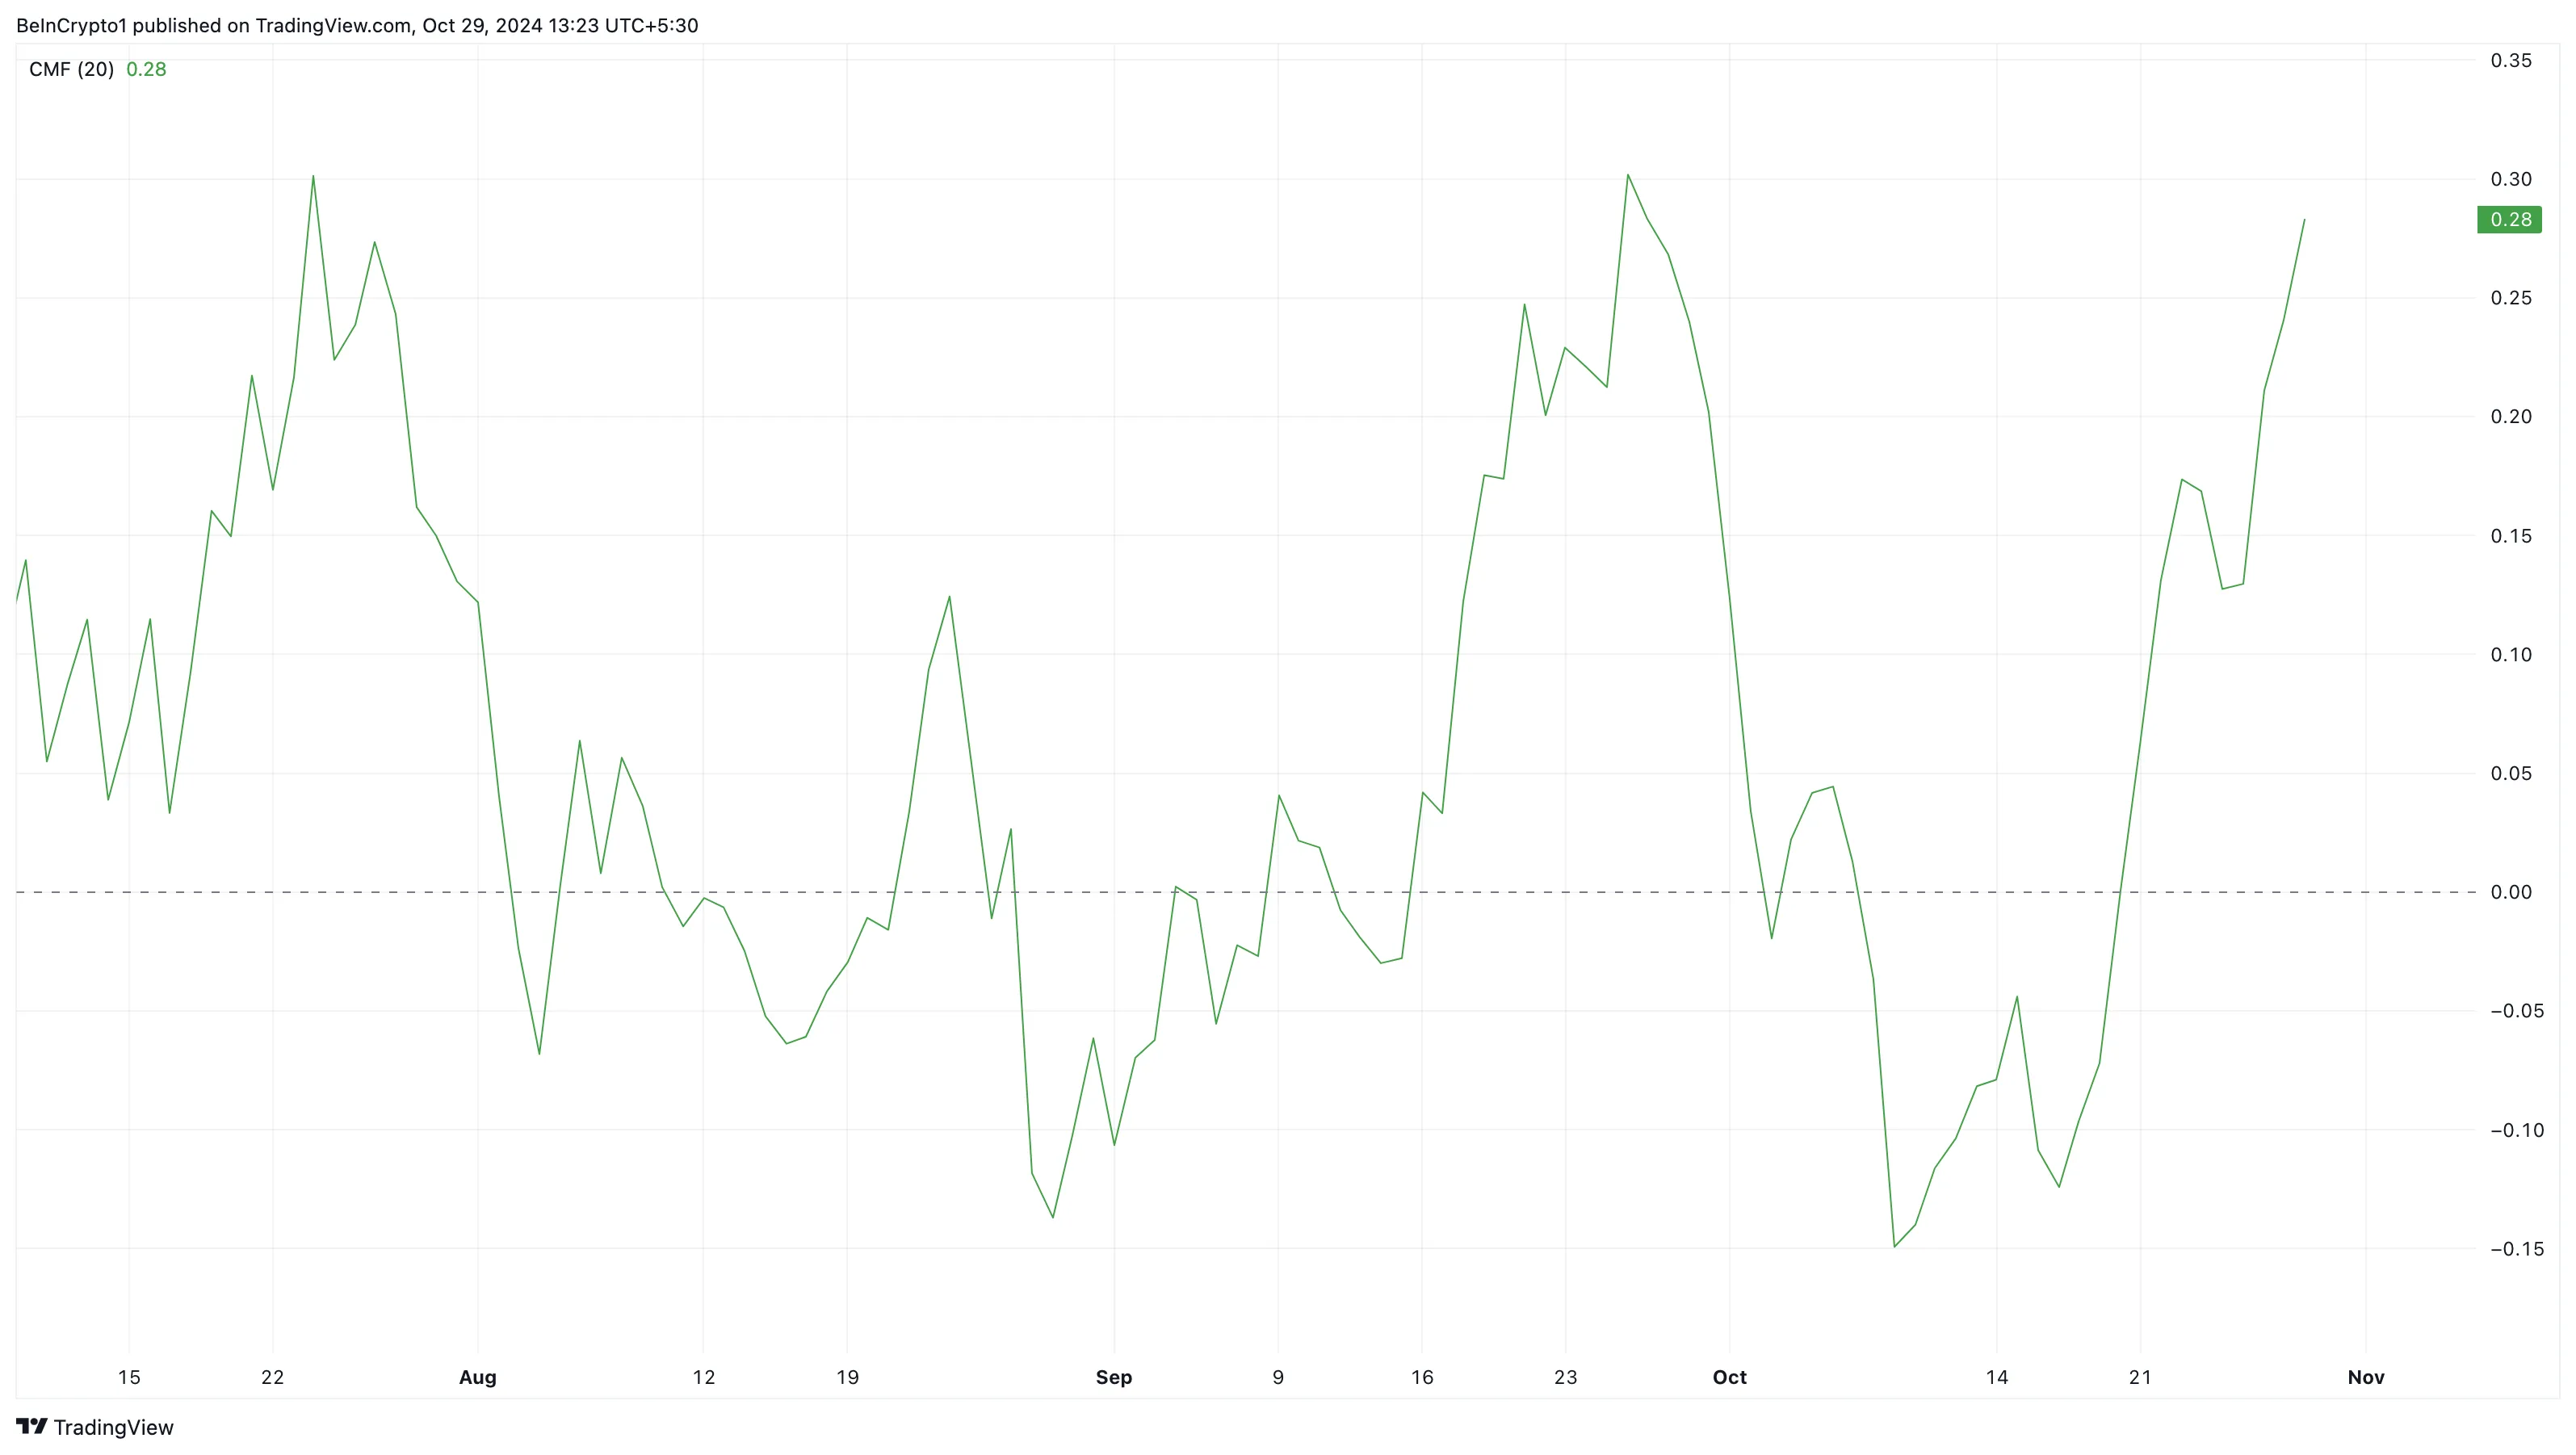
However, this also suggests that buying pressure has overheated, leading to a potentially negative response to the question: “Will Solana reach $200?”
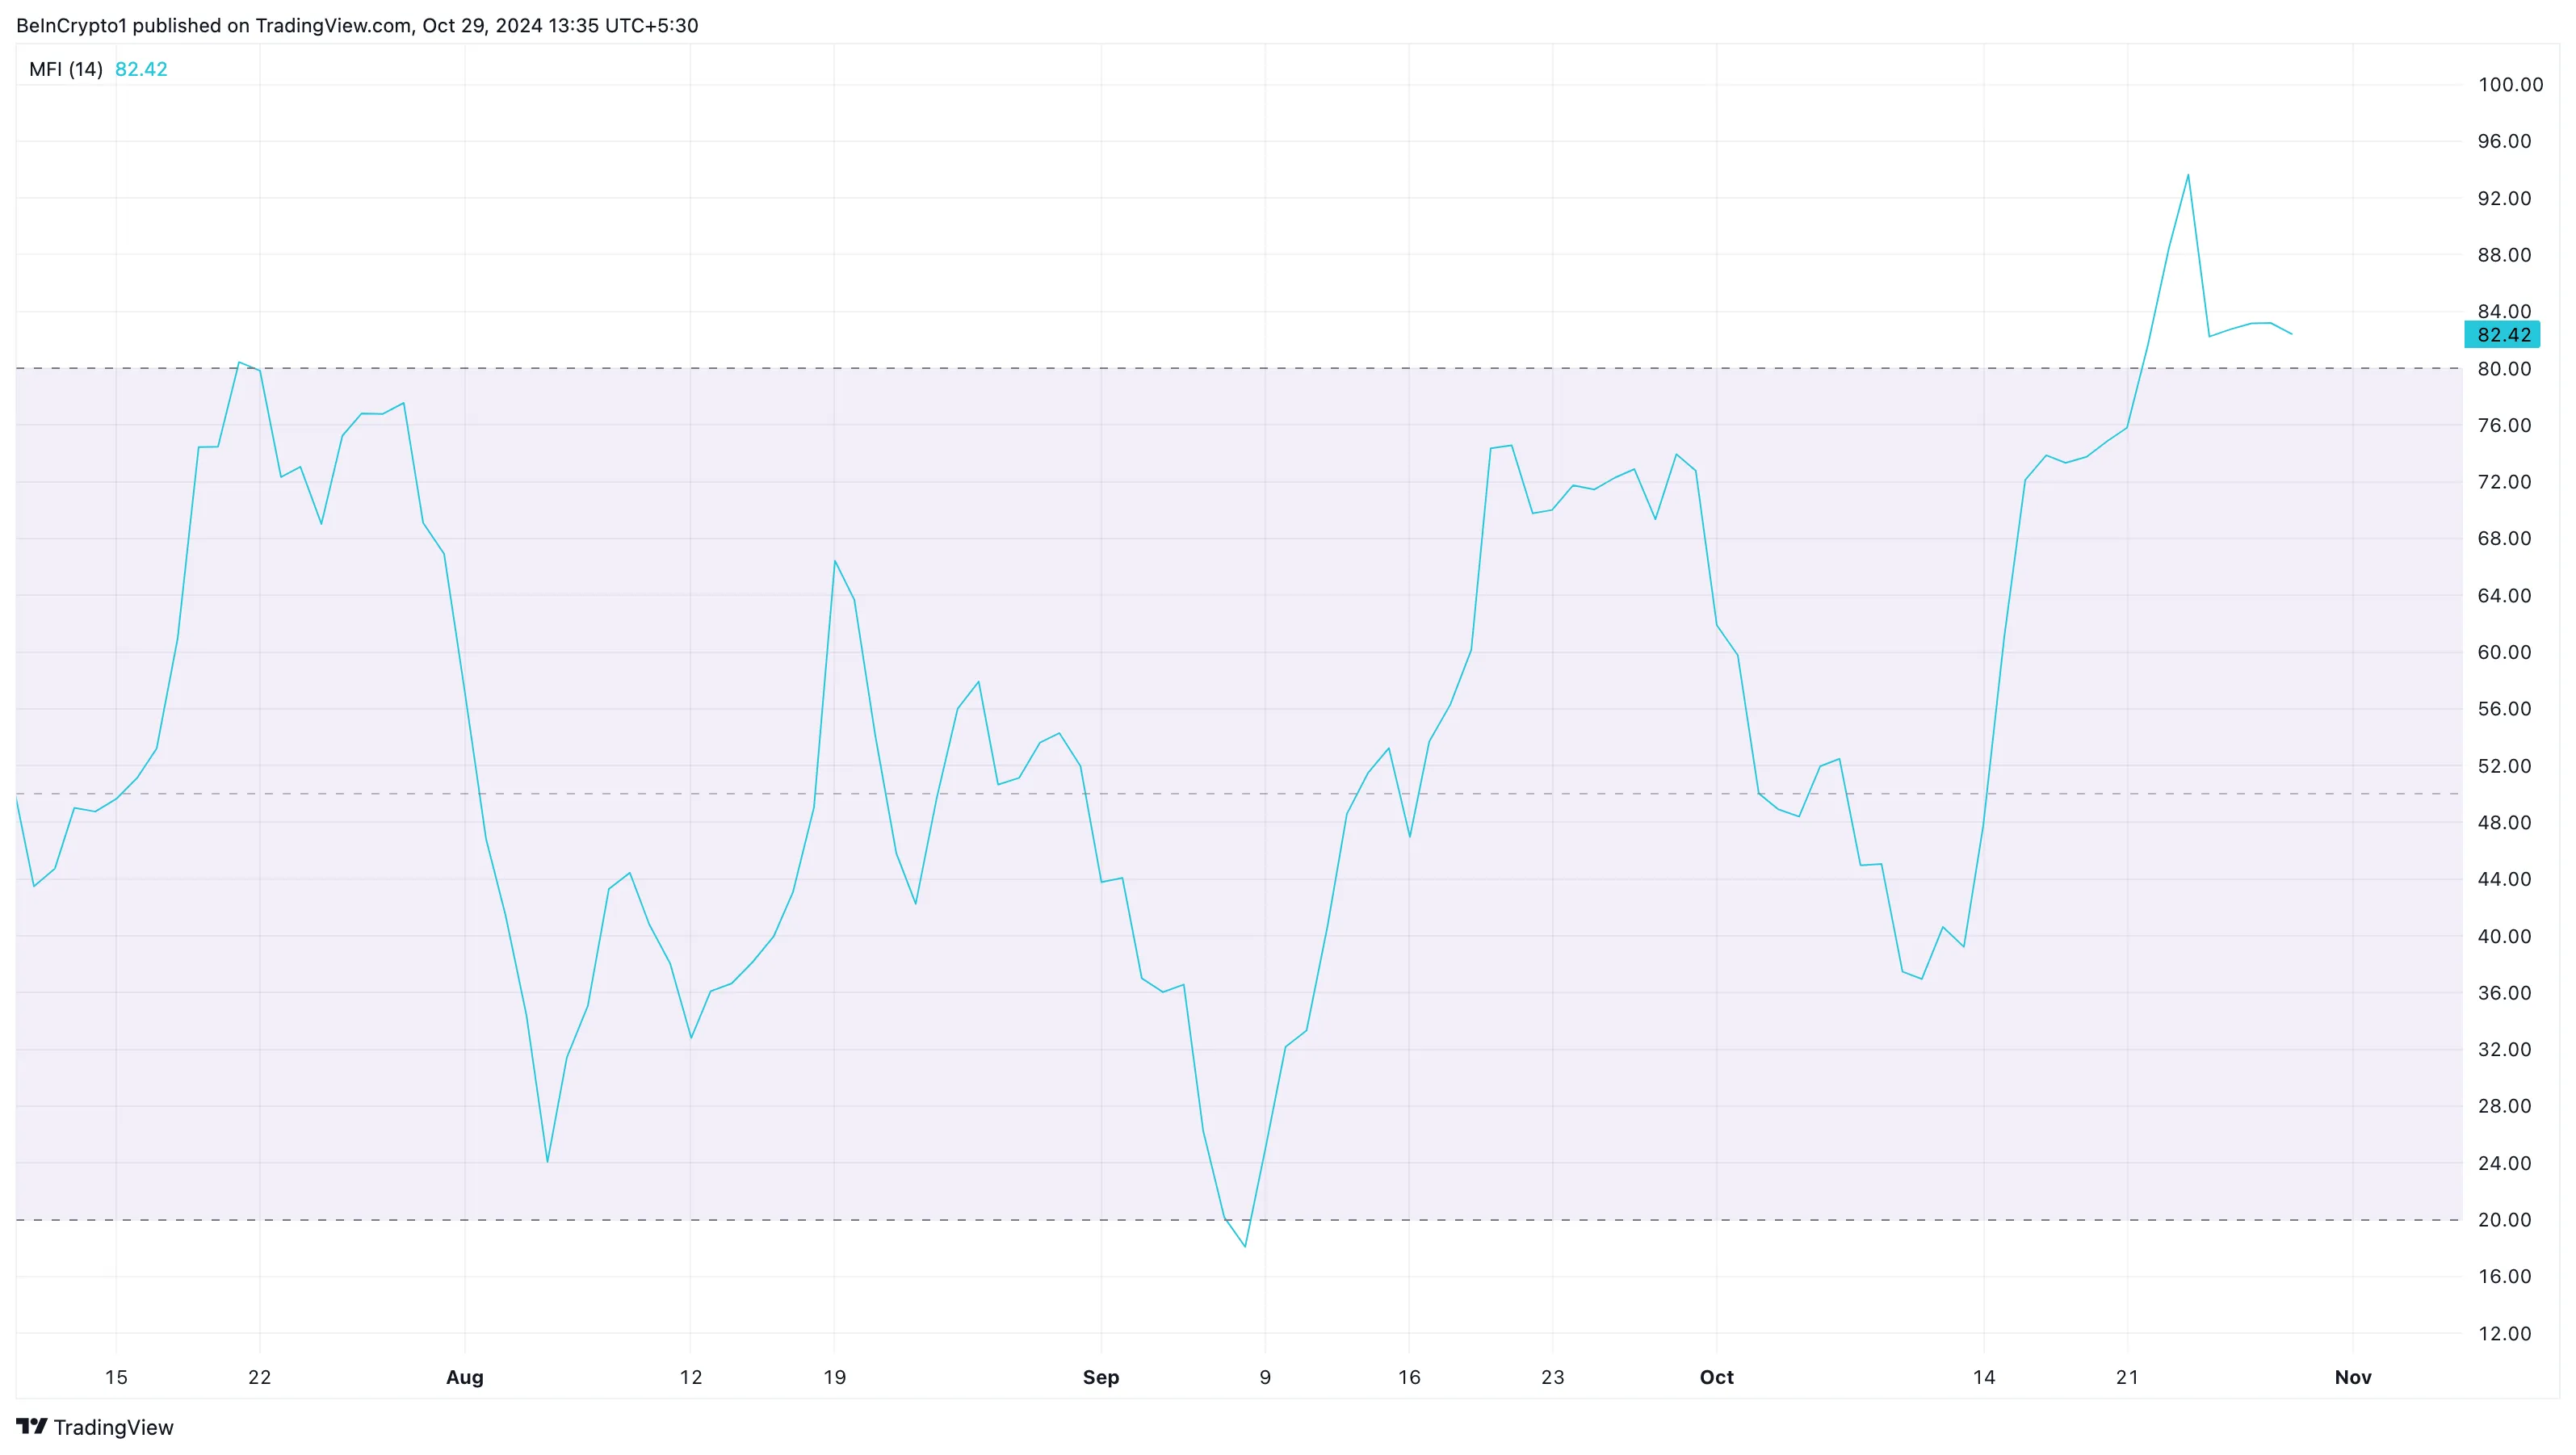
The Money Flow Index (MFI) raises similar caution signals. Currently, the MFI has surpassed a reading of 80.00, confirming that SOL is overbought. If the reading were below 20.00, it would indicate oversold conditions.
Given this outlook, Solana’s upward momentum could ease, potentially resulting in a short-term correction before another notable surge.
SOL Price Prediction: Retracement Could Be Next
On the daily chart, Solana’s price successfully retested the $180 mark after breaking out of an ascending triangle pattern. This breakout signaled a bullish trend, indicating that traders were eager to push the price higher.
However, even though SOL could trade higher, the supply zone at $185 is likely to push the value down. The last time SOL hit $185, it faced a 30% correction and is yet to hit the mark again.
This is not to say that Solana will not reach $200. But before that happens, the overhead resistance could pull the price back to $161.81 before making another attempt to go higher.
Read more: Solana (SOL) Price Prediction 2024/2025/2030
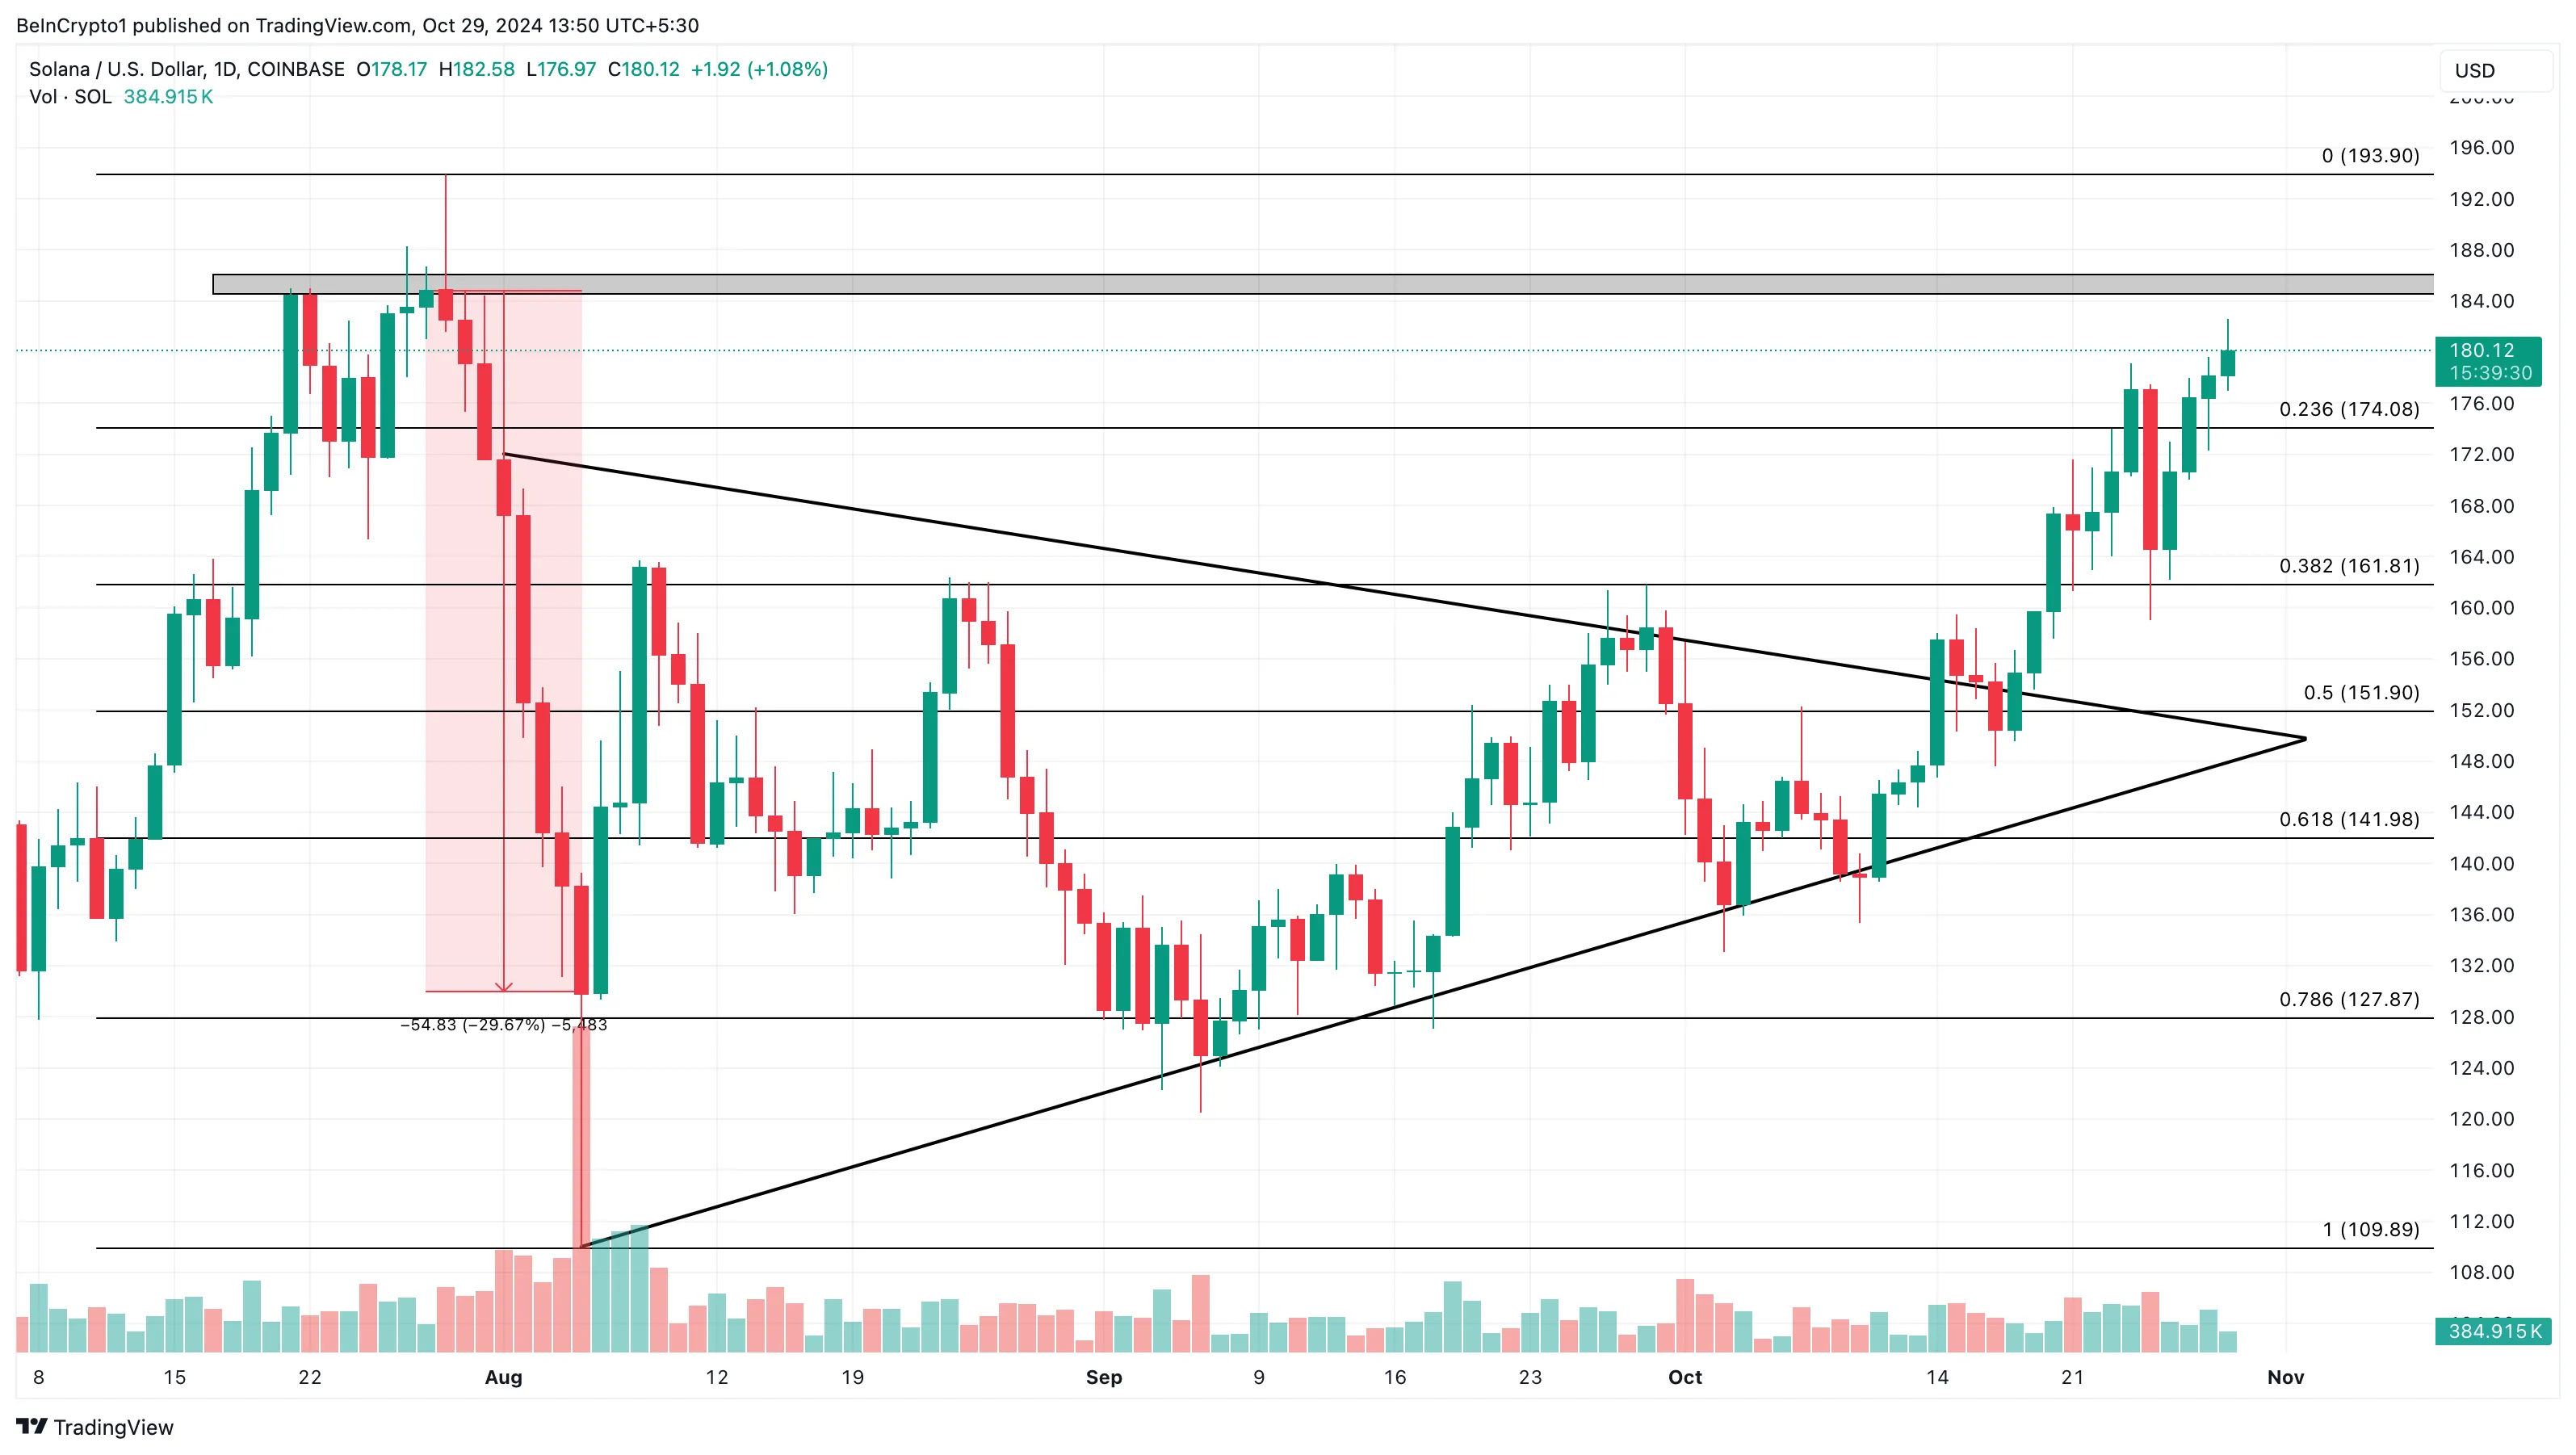
On the other hand, if bulls successfully drive the token above $185, the price might not experience a drawback before it hits $200.
Disclaimer
In line with the Trust Project guidelines, this price analysis article is for informational purposes only and should not be considered financial or investment advice. BeInCrypto is committed to accurate, unbiased reporting, but market conditions are subject to change without notice. Always conduct your own research and consult with a professional before making any financial decisions. Please note that our Terms and Conditions, Privacy Policy, and Disclaimers have been updated.


Despite regulatory hurdles and listing concerns, a new report from TokenInsight shows that Binance is comfortably leading the CEX market. Increasing competition from MEXC and Bitget saw Binance’s market share drop 1%, but it still dominates more than one-third of the CEX trades.
The firm dominates in every metric that the report examined, from market share to public notoriety. It leads both in spot and derivatives trading volume and maintains the most stable ratio between the two of any CEX.
Binance is Winning the CEX Race By a Mile
Binance suffered a few setbacks in this period, but it still comfortably leads the CEX market in a few key areas. Its token listings are not performing like they used to, prompting community backlash, and its potential ties with the Trump family are also raising concerns.
However, the exchange had a strong Q1 2025, as its trading volume continued to dominate one-third of the CEX market.
“Binance maintained its market-leading position in both quarters, with a trading volume of $9.95 trillion in Q4 2024. Due to market volatility, its trading volume in Q1 2025 was approximately $8.39 trillion. Binance continued to lead in market share, holding 36.5% in Q1 2025,” the report claimed.
In terms of total market share, Binance isn’t completely surpassing the CEX market. In fact, its control actually decreased by 1.38%.
No other exchange saw this level of decline, as Bybit only lost 0.89% after the infamous hack. Nonetheless, most of the biggest CEXs also declined slightly, and none of the growing exchanges managed to compete with its head start.
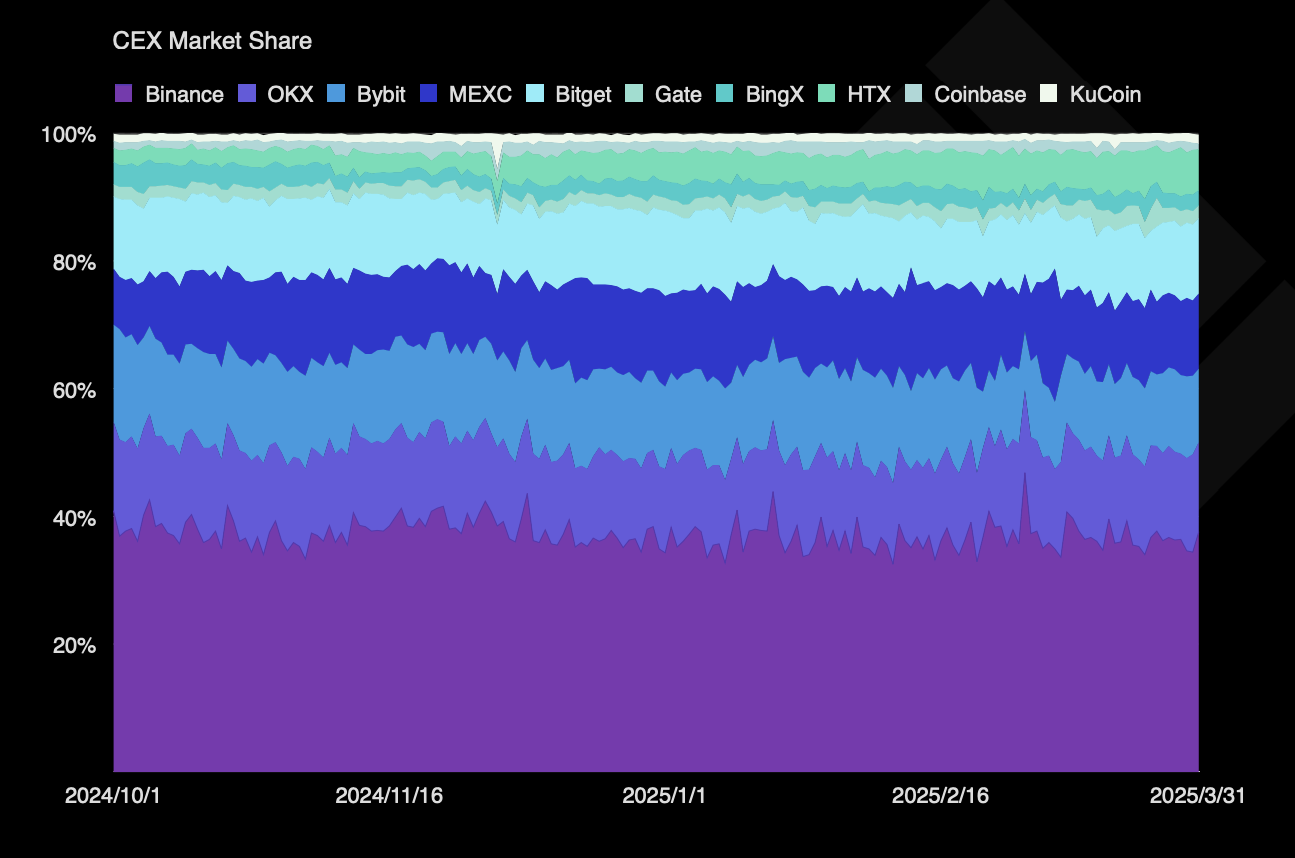
Binance accounts for nearly 36% of the CEX market share, but this isn’t its only advantage. It also leads in both spot trading and derivatives volumes, controlling 45% of the former and maintaining a 17% lead with the latter.
Additionally, TokenInsight determined that it had the most stable platform structure, keeping its ratio of spot to derivatives trading very consistent.
The firm also ranked number one in open interest market share, but this was its least comfortable lead. However, TokenInsight identified a few intangibles that significantly impacted Binance’s CEX performance.

In its list of noteworthy industry events for Q1 2025, Binance was mentioned more than any other exchange. In one such mention, Forbes listed it as one of the world’s most trusted crypto exchanges.
Overall, despite ongoing regulatory scrutiny in several different regions, the exchange seemingly holds a firm grip on the market.
Disclaimer
In adherence to the Trust Project guidelines, BeInCrypto is committed to unbiased, transparent reporting. This news article aims to provide accurate, timely information. However, readers are advised to verify facts independently and consult with a professional before making any decisions based on this content. Please note that our Terms and Conditions, Privacy Policy, and Disclaimers have been updated.


The European Central Bank (ECB) cut interest rates by another 25 basis points today, but the crypto market has hardly noticed. This highlights the European market’s declining influence over the crypto sector compared to the US.
Meanwhile, the crypto community is praying for rate cuts in the US, and false tariff rumors caused a massive pump. These policies still matter, but Europe is losing its macro influence.
The ECB Cuts Rates To Crypto Ambivalence
Global recession fears are circulating throughout the crypto market, and regulation plays a key role in them. US investors have been desperate for a rate cut in the hopes that it could provide a bullish narrative.
None has yet materialized. However, the ECB cut interest rates today for the sixth consecutive time, yet the crypto market barely reacted.
“The outlook for growth has deteriorated owing to rising trade tensions. Increased uncertainty is likely to reduce confidence among households and firms, and the adverse and volatile market response to the trade tensions is likely to have a tightening impact on financing conditions,” the ECB said in a public statement.
According to price data, the total crypto market cap has decreased by 0.2% since the ECB announced these rate cuts. Of the top 10 largest assets, all of them posted gains today except one.
Does this mean that macroeconomic factors are losing influence on crypto markets? That notion is demonstrably untrue. Less than two weeks ago, crypto had a huge rally after a false rumor that Trump would pause tariffs.
These gains came back when the pause actually happened. So, macro influence is still very strong in the current markets; it’s specifically that the ECB and Europe are losing influence.
The European Union isn’t the only economic bloc that’s losing its power in the space. Yesterday, the British government announced that inflation was lower than expected, potentially enabling another rate cut.
This, too, had a negligible impact on crypto. Macroeconomic concerns still impact the crypto market, but its strongest links are to the US and Asia.
A clear sign of this change in crypto happened months before the ECB cuts. Tether was forced to leave the EU due to MiCA regulations, but its business was minimally impacted.
It’s still the world’s largest stablecoin despite losing out on the entire European market. In fact, since then, it has taken steps to better integrate with US regulations.
Meanwhile, many large crypto businesses are reorienting towards Asia and the US and away from Europe. Earlier this year, a16z shut down its London office to focus on the US.
Tether relocated to El Salvador, giving it close proximity to the US and easier access to the Latin American market. This growth area is apparently more fruitful than trying again in Europe.
The ECB’s rate cuts barely impacted the crypto market, but that doesn’t mean that the industry will ignore the whole continent. Moving forward, however, EU operations will matter less and less to the largest companies.
This mirrors broader trends, as international capital is refocusing away from Europe. It’s only natural that crypto is part of that pattern.
Disclaimer
In adherence to the Trust Project guidelines, BeInCrypto is committed to unbiased, transparent reporting. This news article aims to provide accurate, timely information. However, readers are advised to verify facts independently and consult with a professional before making any decisions based on this content. Please note that our Terms and Conditions, Privacy Policy, and Disclaimers have been updated.

Cardano (ADA) has been trading below the $0.70 mark since March 29, struggling to regain bullish momentum. Despite brief signs of strength, recent indicators now point to weakening trend conditions.
Both the BBTrend and ADX show fading buying pressure, while EMA alignment remains bearish. With price stuck between key support and resistance levels, ADA’s next move could define its short-term direction.
Cardano BBTrend Turns Negative, Signaling Momentum Reversal
Cardano’s BBTrend has flipped negative, currently sitting at -0.78 after spending the last five days in positive territory. The indicator reached a peak of 9.76 on April 14, signaling strong bullish momentum at the time.
BBTrend, short for Bollinger Band Trend, measures the strength and direction of a price move relative to its Bollinger Bands.
Positive values typically indicate bullish trends, while negative values point to bearish conditions or weakening momentum.

The shift to -0.78 suggests that Cardano’s recent uptrend has lost strength and may be reversing. A negative BBTrend reading means the price is now moving closer to the lower band, often a sign of rising selling pressure.
While it doesn’t confirm a strong downtrend yet, this reversal could indicate the beginning of a broader consolidation or bearish phase unless momentum quickly recovers.
Traders may want to watch closely for follow-through or a bounce to assess ADA’s short-term direction.
Cardano Momentum Fades as ADX Crashes and Selling Pressure Rises
Cardano’s DMI chart shows a sharp drop in trend strength, with its ADX falling to 15.12 from 28.34 just two days ago.
The ADX (Average Directional Index) measures trend intensity—readings above 25 suggest a strong trend, while values below 20 indicate a weak or consolidating market.
The steep decline in the ADX signals that the momentum behind Cardano’s recent move is quickly fading.

At the same time, the +DI (bullish directional indicator) has dropped from 22.61 to 17.39, showing weakening buying pressure. Meanwhile, the -DI (bearish indicator) has risen from 10.5 to 14.95, pointing to a gradual increase in selling strength.
With both the ADX and +DI falling, and -DI climbing, the setup hints at a potential shift in favor of the bears.
Unless bullish momentum returns quickly, Cardano could enter a period of sideways movement or even a short-term downtrend.
Bearish Structure Still Dominates Cardano
Cardano’s EMA lines remain bearish, with short-term averages still positioned below the long-term ones—indicating that downward momentum is intact.
Cardano price is holding above a key support zone near $0.594, but if this level fails, it could trigger a deeper drop toward $0.511. This would confirm a continuation of the downtrend and reflect growing selling pressure.
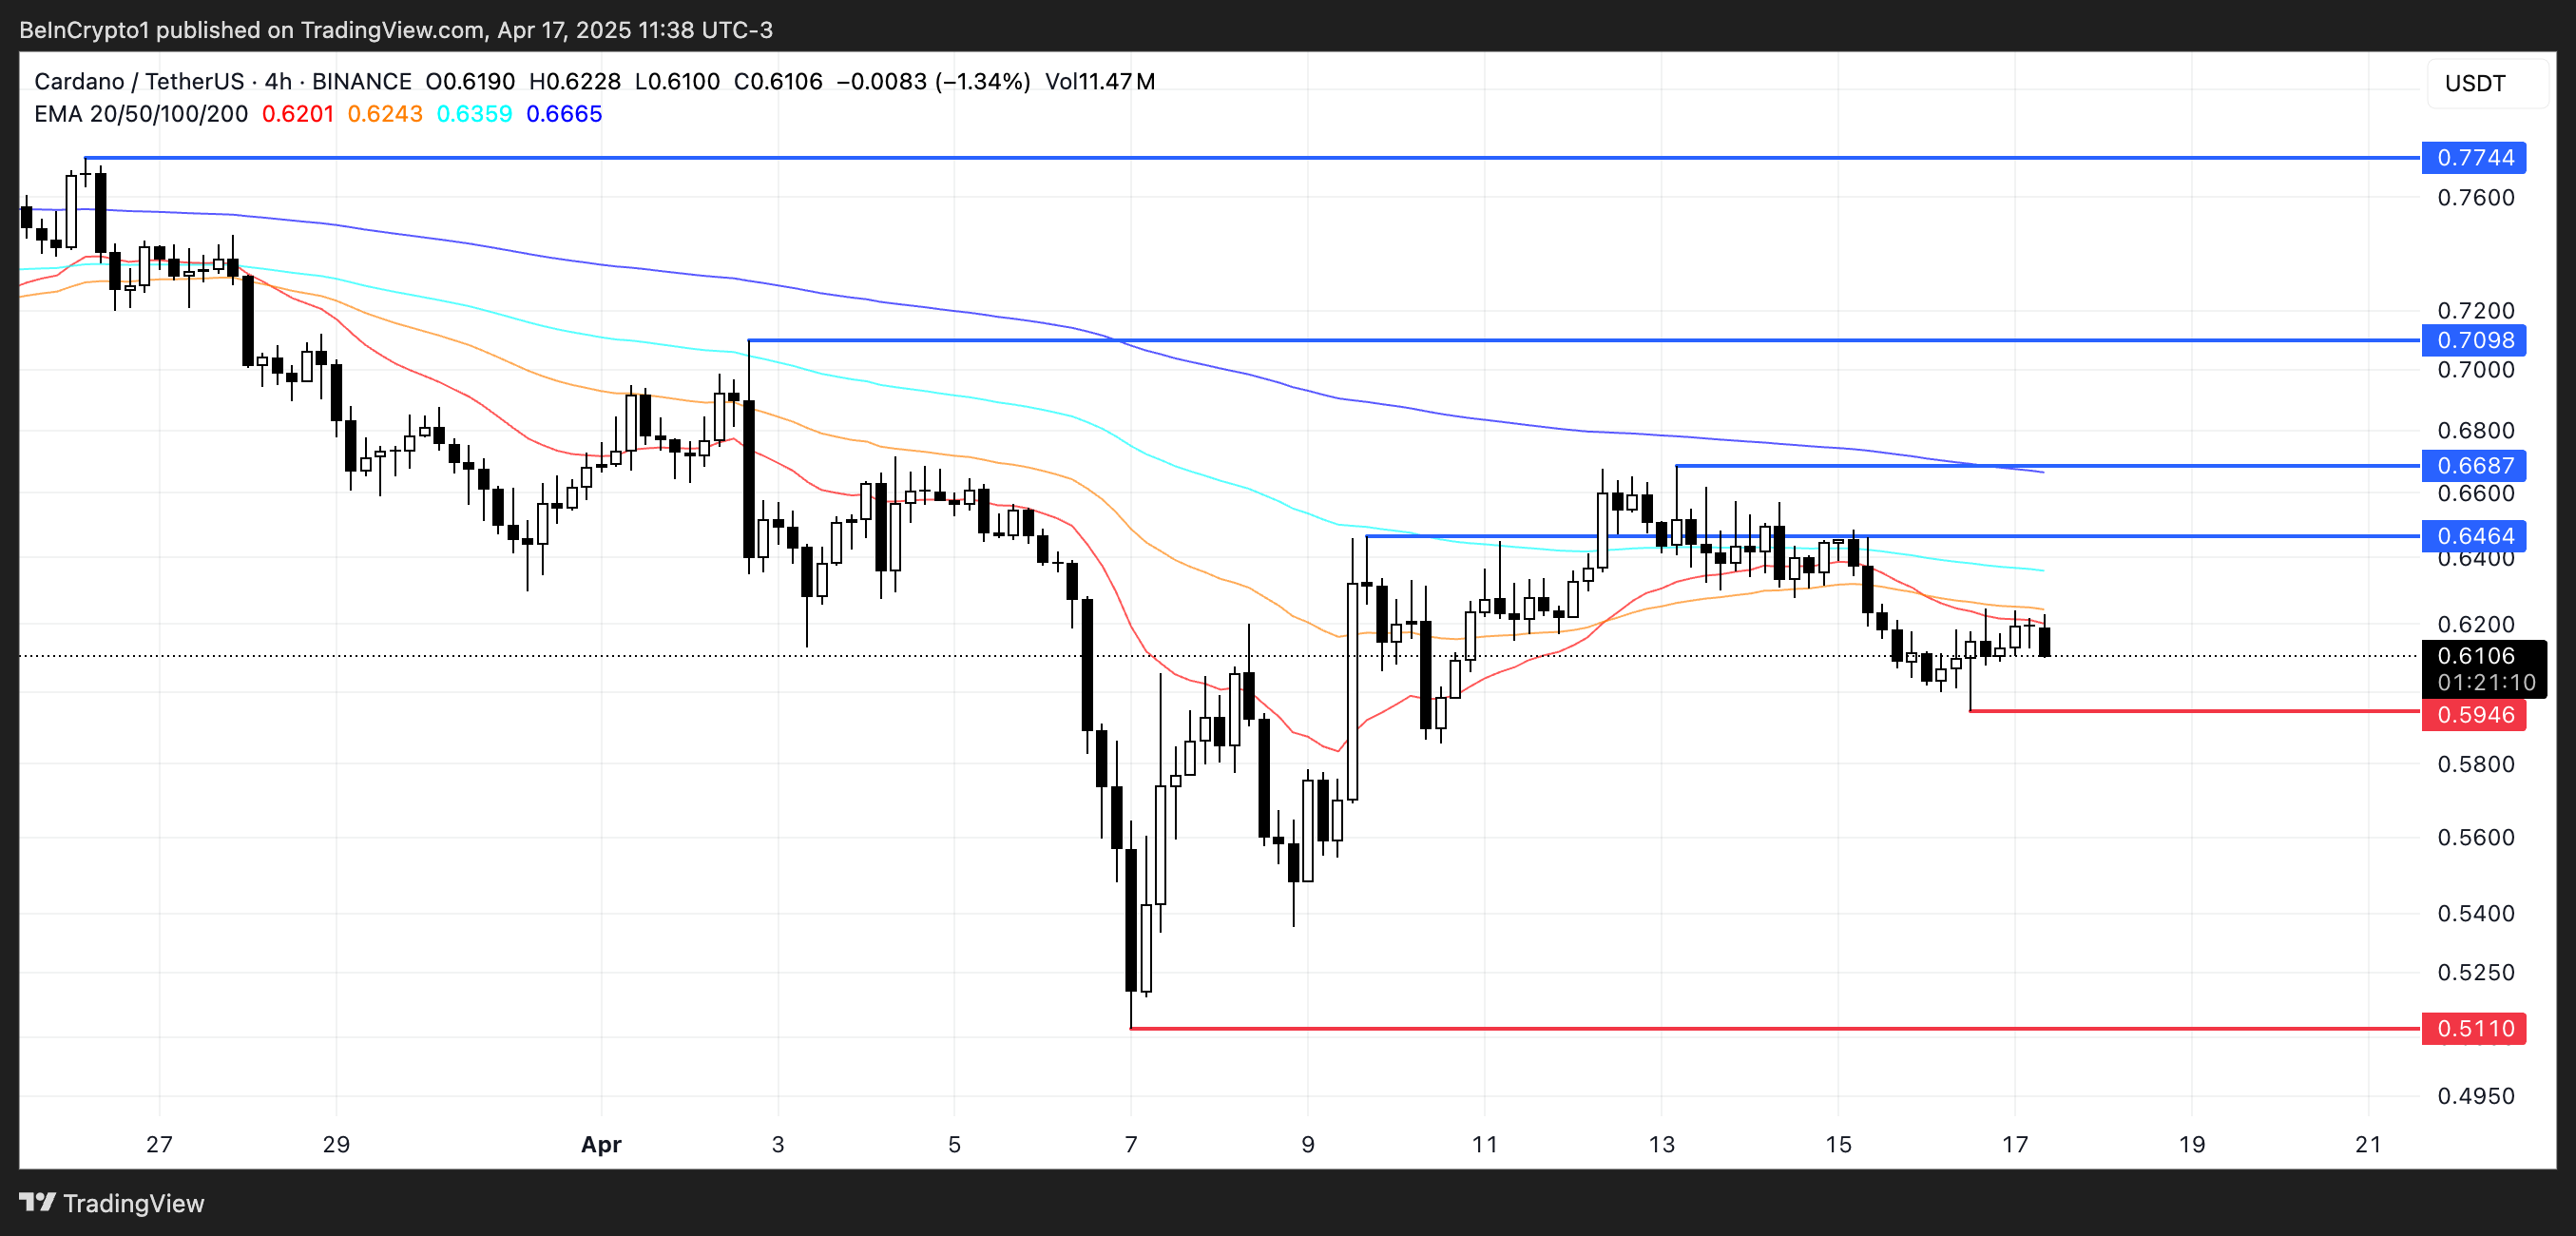
However, if ADA manages to reverse its current momentum, the first major resistance lies at $0.64. A breakout above that level could open the door to further gains, with potential targets at $0.66 and $0.70.
If the uptrend strengthens, ADA could even rally toward $0.77, marking a more decisive recovery and trend shift.
Disclaimer
In line with the Trust Project guidelines, this price analysis article is for informational purposes only and should not be considered financial or investment advice. BeInCrypto is committed to accurate, unbiased reporting, but market conditions are subject to change without notice. Always conduct your own research and consult with a professional before making any financial decisions. Please note that our Terms and Conditions, Privacy Policy, and Disclaimers have been updated.

Binance Leads One-Third of the CEX Market in Q1 2025

Crypto Ignores ECB Rate Cuts, Highlighting EU’s Fading Influence

Cardano (ADA) Price Flat as Bulls Stay on Sidelines

Ethereum Whales Offload 143,000 ETH In One Week – More Selling Ahead?

Bitcoin (BTC) Stays Flat as Whales Reduce Market Exposure
Crypto Casino Founder Charged With Fraud in New York

2.52 Million Altcoins Are Ruining Crypto’s Future

Animoca Brands Valuation Tanks 75% In Two Years, Here’s Why

Crypto exchange BingX hacked for $43 million

Are The Big Players Losing Interest?

Hong Kong’s Securities Association Tips Authorities On Crypto Self-Regulation

Coinbase cbBTC Set to go Live on Solana
2.52 Million Altcoins Are Ruining Crypto’s Future
Animoca Brands Valuation Tanks 75% In Two Years, Here’s Why
Crypto exchange BingX hacked for $43 million
Are The Big Players Losing Interest?
Hong Kong’s Securities Association Tips Authorities On Crypto Self-Regulation
Coinbase cbBTC Set to go Live on Solana
-

 Market23 hours ago
Crypto Market Lost $633 Billion in Q1 2025, CoinGecko Finds
-

 Market24 hours ago
Base Meme Coin Wipes $15 Million After Official Promotion
-

 Market22 hours ago
PEPE Price To Bounce 796% To New All-Time Highs In 2025? Here’s What The Chart Says
-

 Market19 hours ago
No Rate Cut Soon, Crypto Banking Rules to Ease
-

 Market18 hours ago
Ethereum Price Struggles to Rebound—Key Hurdles In The Way
-

 Ethereum17 hours ago
77K Ethereum Moved to Derivatives—Is Another Price Crash Looming?
-

 Market16 hours ago
Bitcoin and Global M2 Money Supply: A Misleading Connection?
-
 Altcoin15 hours ago
Crypto Whales Bag $20M In AAVE & UNI, Are DeFi Tokens Eyeing Price Rally?
