
Market
Will It Lose Dominance in 2025?

Ethereum has long been the undisputed king of smart contract platforms. However, as 2025 progresses, cracks in its foundation have begun to show.
The Ethereum Foundation (EF), a nonprofit organization tasked with stewarding the blockchain’s development, is facing one of its most turbulent moments yet.
EF’s Leadership Turmoil: Conflict of Interest and Transparency Issues
Leadership shakeups, internal conflicts, and a controversial $165 million DeFi investment have raised concerns over Ethereum’s governance and neutrality. These struggles have come at a critical moment. The crypto market is changing, and new contenders are emerging as serious challengers for Ethereum’s position as the second-largest cryptocurrency.
Vitalik Buterin recently confirmed a restructuring within the Ethereum Foundation to address long-standing governance issues. This overhaul was prompted by controversies such as the EigenLayer scandal, where two Ethereum Foundation researchers, Justin Drake, and Dankrad Feist, took highly lucrative advisory roles with EigenFoundation.
“What is a core EF contributor doing when he accepts roles on projects that have conflicted incentives with Ethereum? Where’s the credible neutrality,” eMon, a popular user on X, quipped.
EigenLayer, a restaking protocol, allows users to leverage their liquid-staked ETH on other networks. Beyond increasing capital efficiency, this raises concerns about Ethereum’s security model. When crypto trader Cobie leaked that Drake and Feist had received millions in vested EigenLayer’s EIGEN tokens, the community reacted with outrage.
Critics saw this as a clear conflict of interest, with Ethereum insiders profiting from their influence over protocol development. The backlash led the Ethereum Foundation to introduce a formal conflict of interest policy in May 2024.
Drake eventually resigned from EigenLayer, but Ethereum’s credibility had already been damaged. Many questioned whether Ethereum’s researchers and decision-makers could be trusted to act in the network’s best interest rather than their financial gain.
Ethereum Foundation’s $165 Million DeFi Investment
As the EigenLayer controversy unfolded, the Ethereum Foundation made another eyebrow-raising decision. It committed 50,000 ETH (approximately $165 million) to DeFi. The move aimed to replenish EF’s treasury, which had shrunk by 39% over the past three years. The EF allocated the funds through a 3-of-5 multi-signature wallet and deployed them into lending protocols like Aave and Lido.
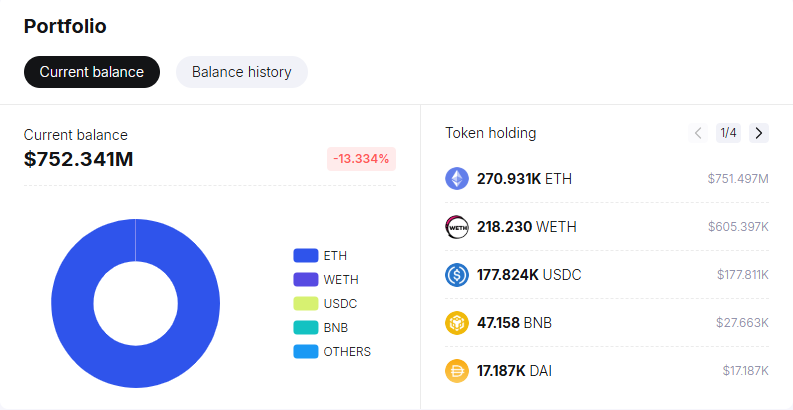
According to data on Spotonchain, the treasury held $752 million as of this writing.
The Ethereum Foundation avoided staking its ETH for years due to concerns about regulatory risks and network neutrality. However, with ETH struggling against Bitcoin and Ethereum losing ground in developer and user activity and market share, EF decided to take a more aggressive financial approach.
Some see this as a smart move to generate passive income, while others believe it signals desperation amid Ethereum’s declining dominance.
Gas Limit Debate: Scaling Solution vs. Network Risk
At the same time, Ethereum is undergoing another critical debate around increasing its gas limit. The Ethereum gas limit has surpassed 32 million, with nearly 52% of validators signaling support for an increase.
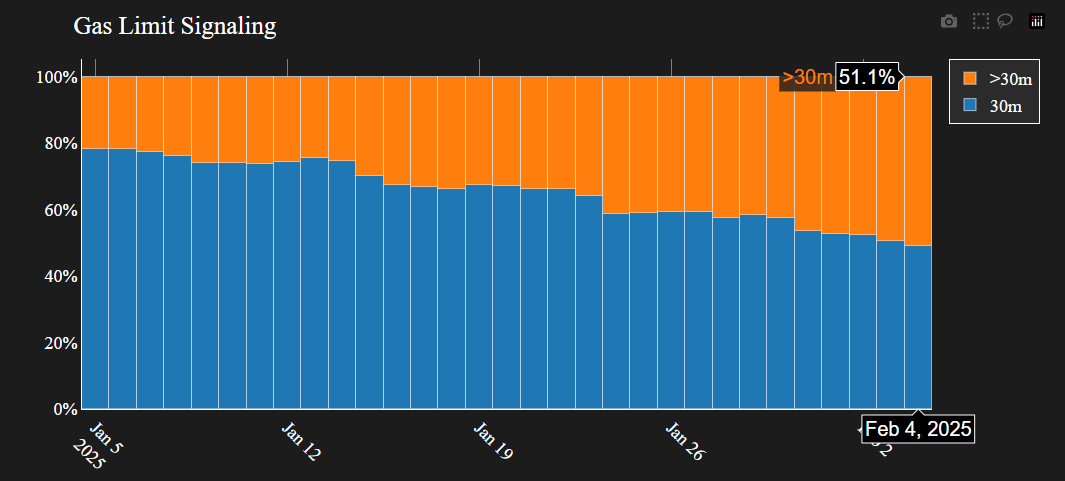
The argument is that raising the gas limit would lower transaction fees and improve network efficiency.
“This will be the first increase under proof of stake. Because PoS is so much more decentralized than obsolete tech like PoW, it took longer to coordinate. Who will be the hero to put us over the top,” posed Evan Van Ness, the former Consensys director of operations.
However, not everyone agrees. Critics warn that increasing the gas limit too aggressively could destabilize Ethereum. Specifically, they say it would make it harder for smaller validators to participate, potentially leading to further centralization.
Meanwhile, Ethereum co-founder Vitalik Buterin calls for the Pectra Fork, which promises better network usability.
“…IMO we should make the blob target also staker-voted so that it can increase in response to technology improvements without waiting for hard forks,” Buterin shared on X.
With Ethereum already grappling with restaking risks, conflicts of interest, and governance disputes, the gas limit debate adds another layer of uncertainty to the blockchain’s future.
Ethereum vs. the Competition: Possibilities of a New #2
With ETH underperforming compared to other assets, investors are looking at potential challengers. Solana, for example, has seen a resurgence, attracting developers and users with its low fees and high-speed transactions. Nevertheless, IntoTheBlock’s senior research analyst Juan Pellicer says Solana still has a long way to go before it can dethrone Ethereum.
“While Solana may continue to grow and potentially challenge Ethereum in specific niches, overcoming Ethereum’s entrenched position as the dominant platform in the immediate future is still unlikely, though the competitive landscape is dynamic and evolving,” Pellicer told BeInCrypto in an exclusive.
Meanwhile, Binance Smart Chain (BSC), Avalanche (AVAX), and even modular blockchain solutions like Celestia (TIA) are gaining traction. Against this backdrop, the question is no longer whether Ethereum will remain the dominant smart contract platform. Instead, it is whether it can maintain its position as the second-largest cryptocurrency.
If Ethereum continues to struggle with governance issues and scalability challenges while competitors offer better efficiency and user experiences, its place in the market could be at risk. Given all these developments, should investors still consider Ethereum in 2025?
Despite its ongoing issues, Ethereum remains the most decentralized and widely adopted smart contract platform. Its strong developer ecosystem, deep liquidity, and established infrastructure give it a significant edge. The recent leadership restructuring, the conflict of interest policy, and treasury management changes indicate that EF is taking steps to correct its course.
However, the risks are undeniable. Ethereum is at a crossroads, where its next moves will determine whether it can maintain its dominance or if a new market leader will dethrone it. Investors should weigh these factors carefully, balancing Ethereum’s strong fundamentals with the uncertainty surrounding its governance and future development.
Nevertheless, Ethereum is changing, and the community must decide whether these changes are for the better or signal the beginning of its decline.
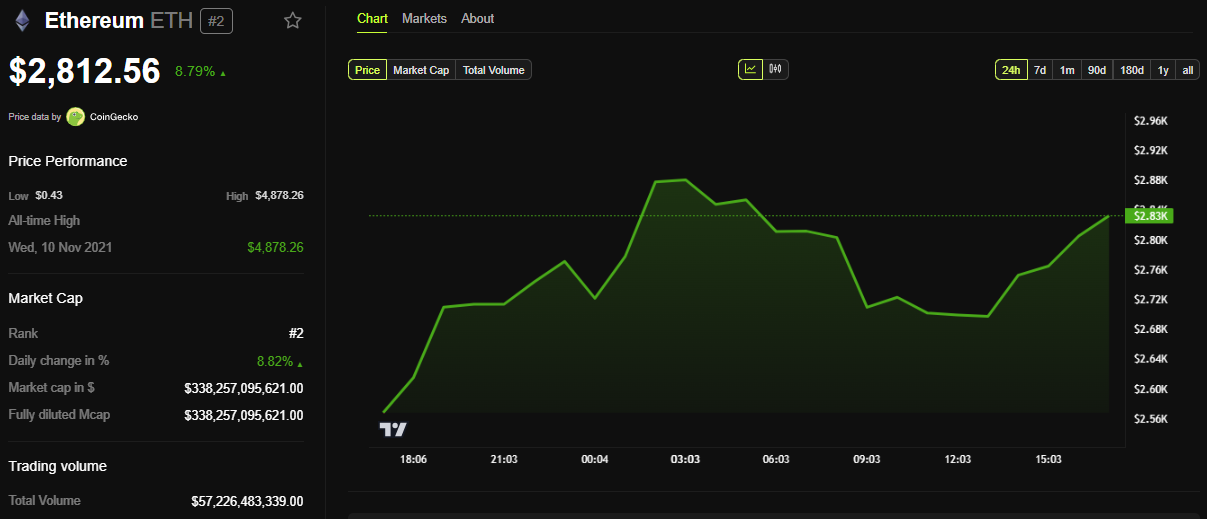
BeInCrypto data shows ETH was trading for $2,812, up by almost 9% since Tuesday’s session opened.
Disclaimer
In adherence to the Trust Project guidelines, BeInCrypto is committed to unbiased, transparent reporting. This news article aims to provide accurate, timely information. However, readers are advised to verify facts independently and consult with a professional before making any decisions based on this content. Please note that our Terms and Conditions, Privacy Policy, and Disclaimers have been updated.


Ripple’s recently acquired Hidden Road has secured a broker-dealer license from the Financial Industry Regulatory Authority (FINRA). This marks a significant milestone in expanding its prime brokerage services for institutional investors.
Market watchers see it as a deliberate strategy by Ripple to build infrastructure and position itself for future growth. That being said, traders are expecting that XRP’s value will rise later.
Ripple Expands Institutional Presence with Hidden Road’s FINRA License
According to the latest press release, Hidden Road Partners CIV US LLC was granted approval. The license now enables the firm to provide a broader suite of regulatory-compliant services, including clearing, financing, and prime brokerage for fixed-income assets to institutions.
Noel Kimmel, President of Hidden Road, highlighted that the license was a pivotal development for the company. According to him, it enhances Hidden Road’s ability to operate in traditional financial (TradFi) markets.
“As a FINRA member, we will be able to bring our best-in-class, technology-driven fixed income service offering to an expanded universe of institutional clients. Our business has tremendous momentum, and we look forward to continuing to provide superior execution and support to our clients amidst today’s exceptionally dynamic market environment,” Kimmel said.
The FINRA approval follows Ripple’s $1.25 billion acquisition of Hidden Road. Announced on April 8, 2025, this was one of the largest deals in the digital assets sector.
The move positions Ripple as the first cryptocurrency company to own a global, multi-asset prime broker. Experts believe the acquisition and subsequent license are part of a broader strategy Ripple is employing.
“Hidden Road just secured a broker-dealer license right after Ripple’s acquisition. This isn’t a coincidence, it’s a statement. XRP is not playing checkers. It’s playing regulatory chess,” an analyst wrote on X (formerly Twitter).
Is Ripple Behind XRP’s Low Price? Analyst Thinks So
In fact, analysts also claim that XRP’s neutral reaction to recent milestones isn’t a sign of weakness but rather a strategic move. In a recent analysis, crypto analyst Levi argued that the current price of XRP, hovering around $2, is not coincidental, but rather a result of Ripple’s deliberate approach.
He suggested that the low price is designed to allow Ripple to operate under the radar while making key strategic moves, such as the Hidden Road acquisition.
“Hidden Road isn’t a flex. It’s infrastructure. It’s the final puzzle piece — giving Ripple a fully integrated, lightning-fast, global value settlement system,” he stated.
The analyst emphasized that while the public focused on Ripple’s legal battles with the SEC, the company quietly built its global value settlement system behind the scenes.
“XRP at $2 isn’t undervalued — it’s deliberately suppressed. When the switch flips, the revaluation won’t be gradual — it’ll be instant,” Levi noted.
In his view, those who have invested early will be positioned to benefit as the market shifts. Meanwhile, XRP, after hitting an all-time high earlier this year, has continued to decline.

At press time, the altcoin was trading at $2.0. According to BeInCrypto data, this represented a decline of 1.0% over the past day.
Disclaimer
In adherence to the Trust Project guidelines, BeInCrypto is committed to unbiased, transparent reporting. This news article aims to provide accurate, timely information. However, readers are advised to verify facts independently and consult with a professional before making any decisions based on this content. Please note that our Terms and Conditions, Privacy Policy, and Disclaimers have been updated.

Aayush Jindal, a luminary in the world of financial markets, whose expertise spans over 15 illustrious years in the realms of Forex and cryptocurrency trading. Renowned for his unparalleled proficiency in providing technical analysis, Aayush is a trusted advisor and senior market expert to investors worldwide, guiding them through the intricate landscapes of modern finance with his keen insights and astute chart analysis.
From a young age, Aayush exhibited a natural aptitude for deciphering complex systems and unraveling patterns. Fueled by an insatiable curiosity for understanding market dynamics, he embarked on a journey that would lead him to become one of the foremost authorities in the fields of Forex and crypto trading. With a meticulous eye for detail and an unwavering commitment to excellence, Aayush honed his craft over the years, mastering the art of technical analysis and chart interpretation.
As a software engineer, Aayush harnesses the power of technology to optimize trading strategies and develop innovative solutions for navigating the volatile waters of financial markets. His background in software engineering has equipped him with a unique skill set, enabling him to leverage cutting-edge tools and algorithms to gain a competitive edge in an ever-evolving landscape.
In addition to his roles in finance and technology, Aayush serves as the director of a prestigious IT company, where he spearheads initiatives aimed at driving digital innovation and transformation. Under his visionary leadership, the company has flourished, cementing its position as a leader in the tech industry and paving the way for groundbreaking advancements in software development and IT solutions.
Despite his demanding professional commitments, Aayush is a firm believer in the importance of work-life balance. An avid traveler and adventurer, he finds solace in exploring new destinations, immersing himself in different cultures, and forging lasting memories along the way. Whether he’s trekking through the Himalayas, diving in the azure waters of the Maldives, or experiencing the vibrant energy of bustling metropolises, Aayush embraces every opportunity to broaden his horizons and create unforgettable experiences.
Aayush’s journey to success is marked by a relentless pursuit of excellence and a steadfast commitment to continuous learning and growth. His academic achievements are a testament to his dedication and passion for excellence, having completed his software engineering with honors and excelling in every department.
At his core, Aayush is driven by a profound passion for analyzing markets and uncovering profitable opportunities amidst volatility. Whether he’s poring over price charts, identifying key support and resistance levels, or providing insightful analysis to his clients and followers, Aayush’s unwavering dedication to his craft sets him apart as a true industry leader and a beacon of inspiration to aspiring traders around the globe.
In a world where uncertainty reigns supreme, Aayush Jindal stands as a guiding light, illuminating the path to financial success with his unparalleled expertise, unwavering integrity, and boundless enthusiasm for the markets.

Reason to trust
![]()
Strict editorial policy that focuses on accuracy, relevance, and impartiality
Created by industry experts and meticulously reviewed
The highest standards in reporting and publishing
Strict editorial policy that focuses on accuracy, relevance, and impartiality
Morbi pretium leo et nisl aliquam mollis. Quisque arcu lorem, ultricies quis pellentesque nec, ullamcorper eu odio.
Ethereum price started a fresh decline below the $1,620 zone. ETH is now consolidating and might attempt to recover above the $1,620 resistance.
- Ethereum started a fresh decline below the $1,620 and $1,600 levels.
- The price is trading below $1,620 and the 100-hourly Simple Moving Average.
- There was a break above a connecting bearish trend line with resistance at $1,590 on the hourly chart of ETH/USD (data feed via Kraken).
- The pair could start a fresh increase if it clears the $1,615 resistance zone.
Ethereum Price Faces Hurdles
Ethereum price struggled to continue higher above $1,690 and started a fresh decline, like Bitcoin. ETH declined below the $1,600 and $1,580 support levels. It even spiked below $1,550.
A low was formed at $1,538 and the price is now attempting a recovery wave. There was a move above the $1,580 level. The price climbed above the 23.6% Fib retracement level of the downward move from the $1,690 swing high to the $1,538 low.
Besides, there was a break above a connecting bearish trend line with resistance at $1,590 on the hourly chart of ETH/USD. Ethereum price is now trading below $1,620 and the 100-hourly Simple Moving Average.
On the upside, the price seems to be facing hurdles near the $1,600 level. The next key resistance is near the $1,615 level or the 50% Fib retracement level of the downward move from the $1,690 swing high to the $1,538 low. The first major resistance is near the $1,655 level.

A clear move above the $1,655 resistance might send the price toward the $1,700 resistance. An upside break above the $1,700 resistance might call for more gains in the coming sessions. In the stated case, Ether could rise toward the $1,750 resistance zone or even $1,800 in the near term.
Another Drop In ETH?
If Ethereum fails to clear the $1,615 resistance, it could start another decline. Initial support on the downside is near the $1,5750 level. The first major support sits near the $1,540 zone.
A clear move below the $1,540 support might push the price toward the $1,480 support. Any more losses might send the price toward the $1,420 support level in the near term. The next key support sits at $1,400.
Technical Indicators
Hourly MACD – The MACD for ETH/USD is losing momentum in the bearish zone.
Hourly RSI – The RSI for ETH/USD is now below the 50 zone.
Major Support Level – $1,540
Major Resistance Level – $1,655

Quantum Researchers Offer 1 Bitcoin To Break ‘Toy Version’

Shiba Inu Follows Crypto Market Trend With “Shib Is For Everyone” Post, What’s Happening?

Is XRP’s Low Price Part of Ripple’s Long-Term Growth Strategy?

XRP Price Weakens—Further Losses on The Table?

Expert Predicts Pi Network Price Volatility After Shady Activity On Banxa

Ethereum Price Fights for Momentum—Traders Watch Key Resistance

2.52 Million Altcoins Are Ruining Crypto’s Future

Animoca Brands Valuation Tanks 75% In Two Years, Here’s Why

Crypto exchange BingX hacked for $43 million

Are The Big Players Losing Interest?

Hong Kong’s Securities Association Tips Authorities On Crypto Self-Regulation

Coinbase cbBTC Set to go Live on Solana
2.52 Million Altcoins Are Ruining Crypto’s Future
Animoca Brands Valuation Tanks 75% In Two Years, Here’s Why
Crypto exchange BingX hacked for $43 million
Are The Big Players Losing Interest?
Hong Kong’s Securities Association Tips Authorities On Crypto Self-Regulation
Coinbase cbBTC Set to go Live on Solana
-
 Altcoin21 hours ago
How Rising Solana Network Inflows Could Drive SOL Price to $150?
-
 Bitcoin21 hours ago
Gary Gensler Explains Why Bitcoin Will Outlast Altcoins
-

 Market20 hours ago
Bitcoin Whales Withdraw $280 Million: Bullish Signal?
-

 Altcoin13 hours ago
CZ Honors Nearly $1 Billion Token Burn Promise
-
 Market16 hours ago
Bitcoin Price Poised for $90,000 Surge
-
 Altcoin23 hours ago
Crypto Whales Bag $20M In AAVE & UNI, Are DeFi Tokens Eyeing Price Rally?
-
 Market21 hours ago
XRP’s $2.00 Pivot Point—A Launchpad or Breakdown Zone?
-

 Market13 hours ago
Over $700 Million In XRP Moved In April, What Are Crypto Whales Up To?
