
Market
Will ETH Outflow Push Prices Higher?

Ethereum (ETH) price has climbed more than 7% in the last seven days. Despite the gains, whale activity remains cautious, reflecting some hesitation among large holders.
On the technical side, EMA lines are indicating a bullish setup, suggesting that momentum could continue building. If the uptrend sustains, ETH could see further gains, though key support levels may come into play if the trend weakens.
ETH Net Transfer Volume Reached Its Biggest Value Since May
ETH’s net transfer to exchanges turned positive on October 29, with 35,000 ETH moved to exchanges. This typically indicates bearish sentiment, as holders transferring assets to exchanges might be preparing to sell.
Increased supply on exchanges often correlates with potential selling pressure, which can weigh on the price in the short term.
Read more: How to Invest in Ethereum ETFs?
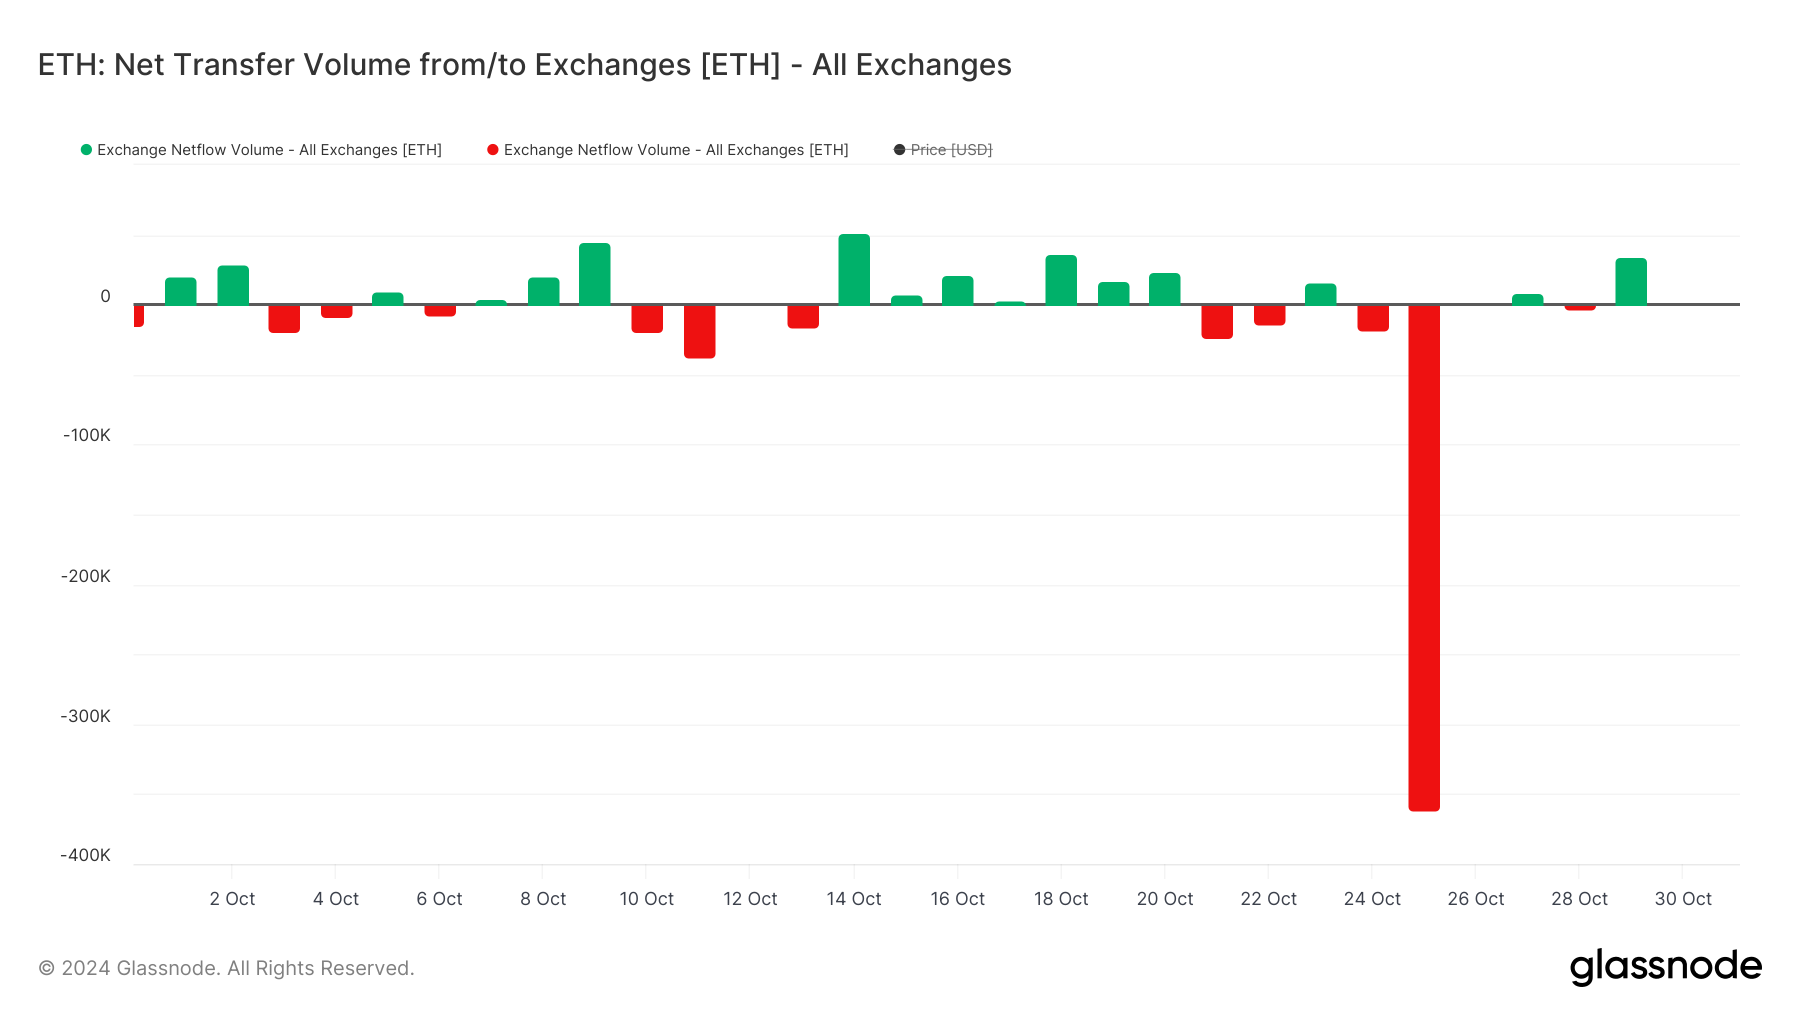
However, the broader context tells a different story. On October 25, more than 361,000 ETH was withdrawn from exchanges, marking the largest outflow since May 30.
Such a significant withdrawal suggests that many holders are opting for long-term storage, reflecting a bullish outlook.
Ethereum Whales Are Still Hesitant
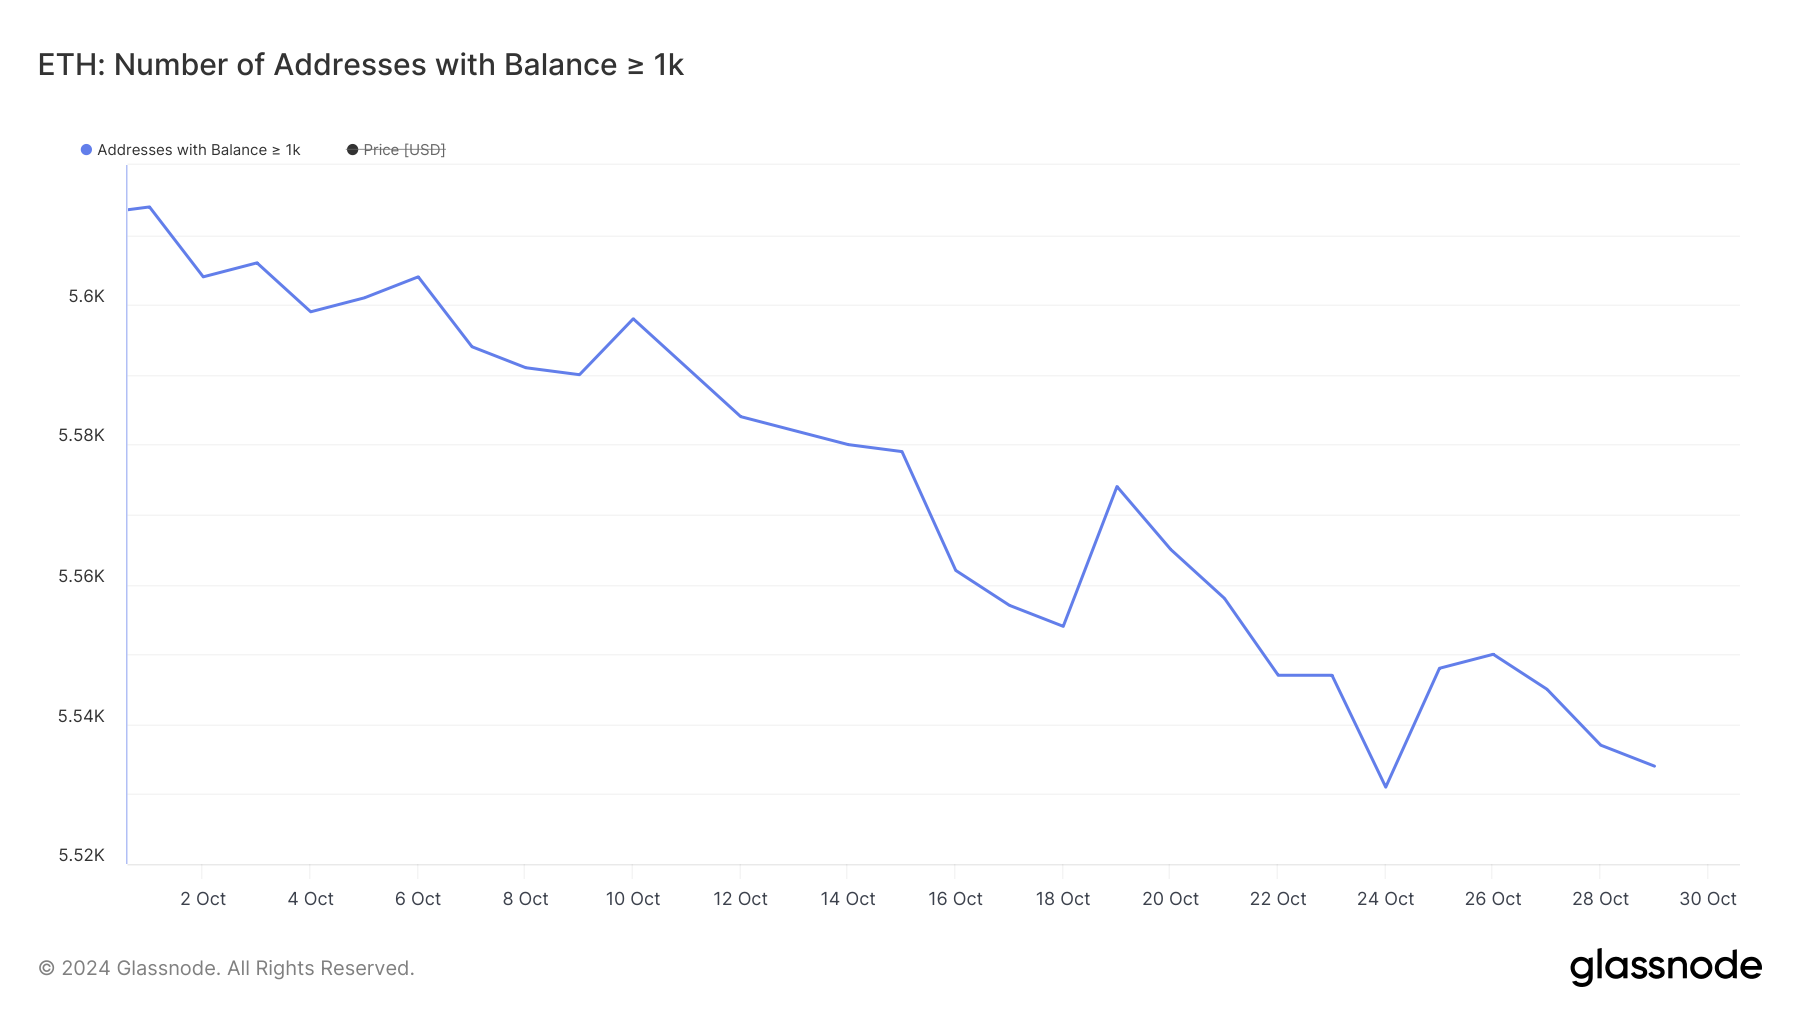
Despite ETH being up 7.54% in the last week, whale activity suggests that large holders are still uncertain. The number of addresses holding at least 1,000 ETH has been on a decline since the beginning of October, dropping from 5,614 on October 1 to 5,534 by October 30.
Although the number of whales briefly increased on October 25, coinciding with a major withdrawal of ETH from exchanges, the count has since started decreasing again.
Tracking whale activity is crucial because these large holders can significantly impact the market with their trades. A decreasing number of wallets holding over 1,000 ETH suggests a lack of confidence among major investors, potentially leading to reduced buying support.
This trend might indicate a bearish outlook for ETH, as fewer whales could mean reduced potential for large-scale accumulation, which is often needed to sustain or push prices higher.
ETH Price Prediction: Back to $3,000 Soon?
Although whales seem cautious, the EMA lines are indicating a bullish setup for ETH price. Recently, short-term EMA lines crossed above long-term ones, forming a golden cross — a technical signal that often suggests the potential for a strong upward price movement.
Read more: Ethereum (ETH) Price Prediction 2024/2025/2030
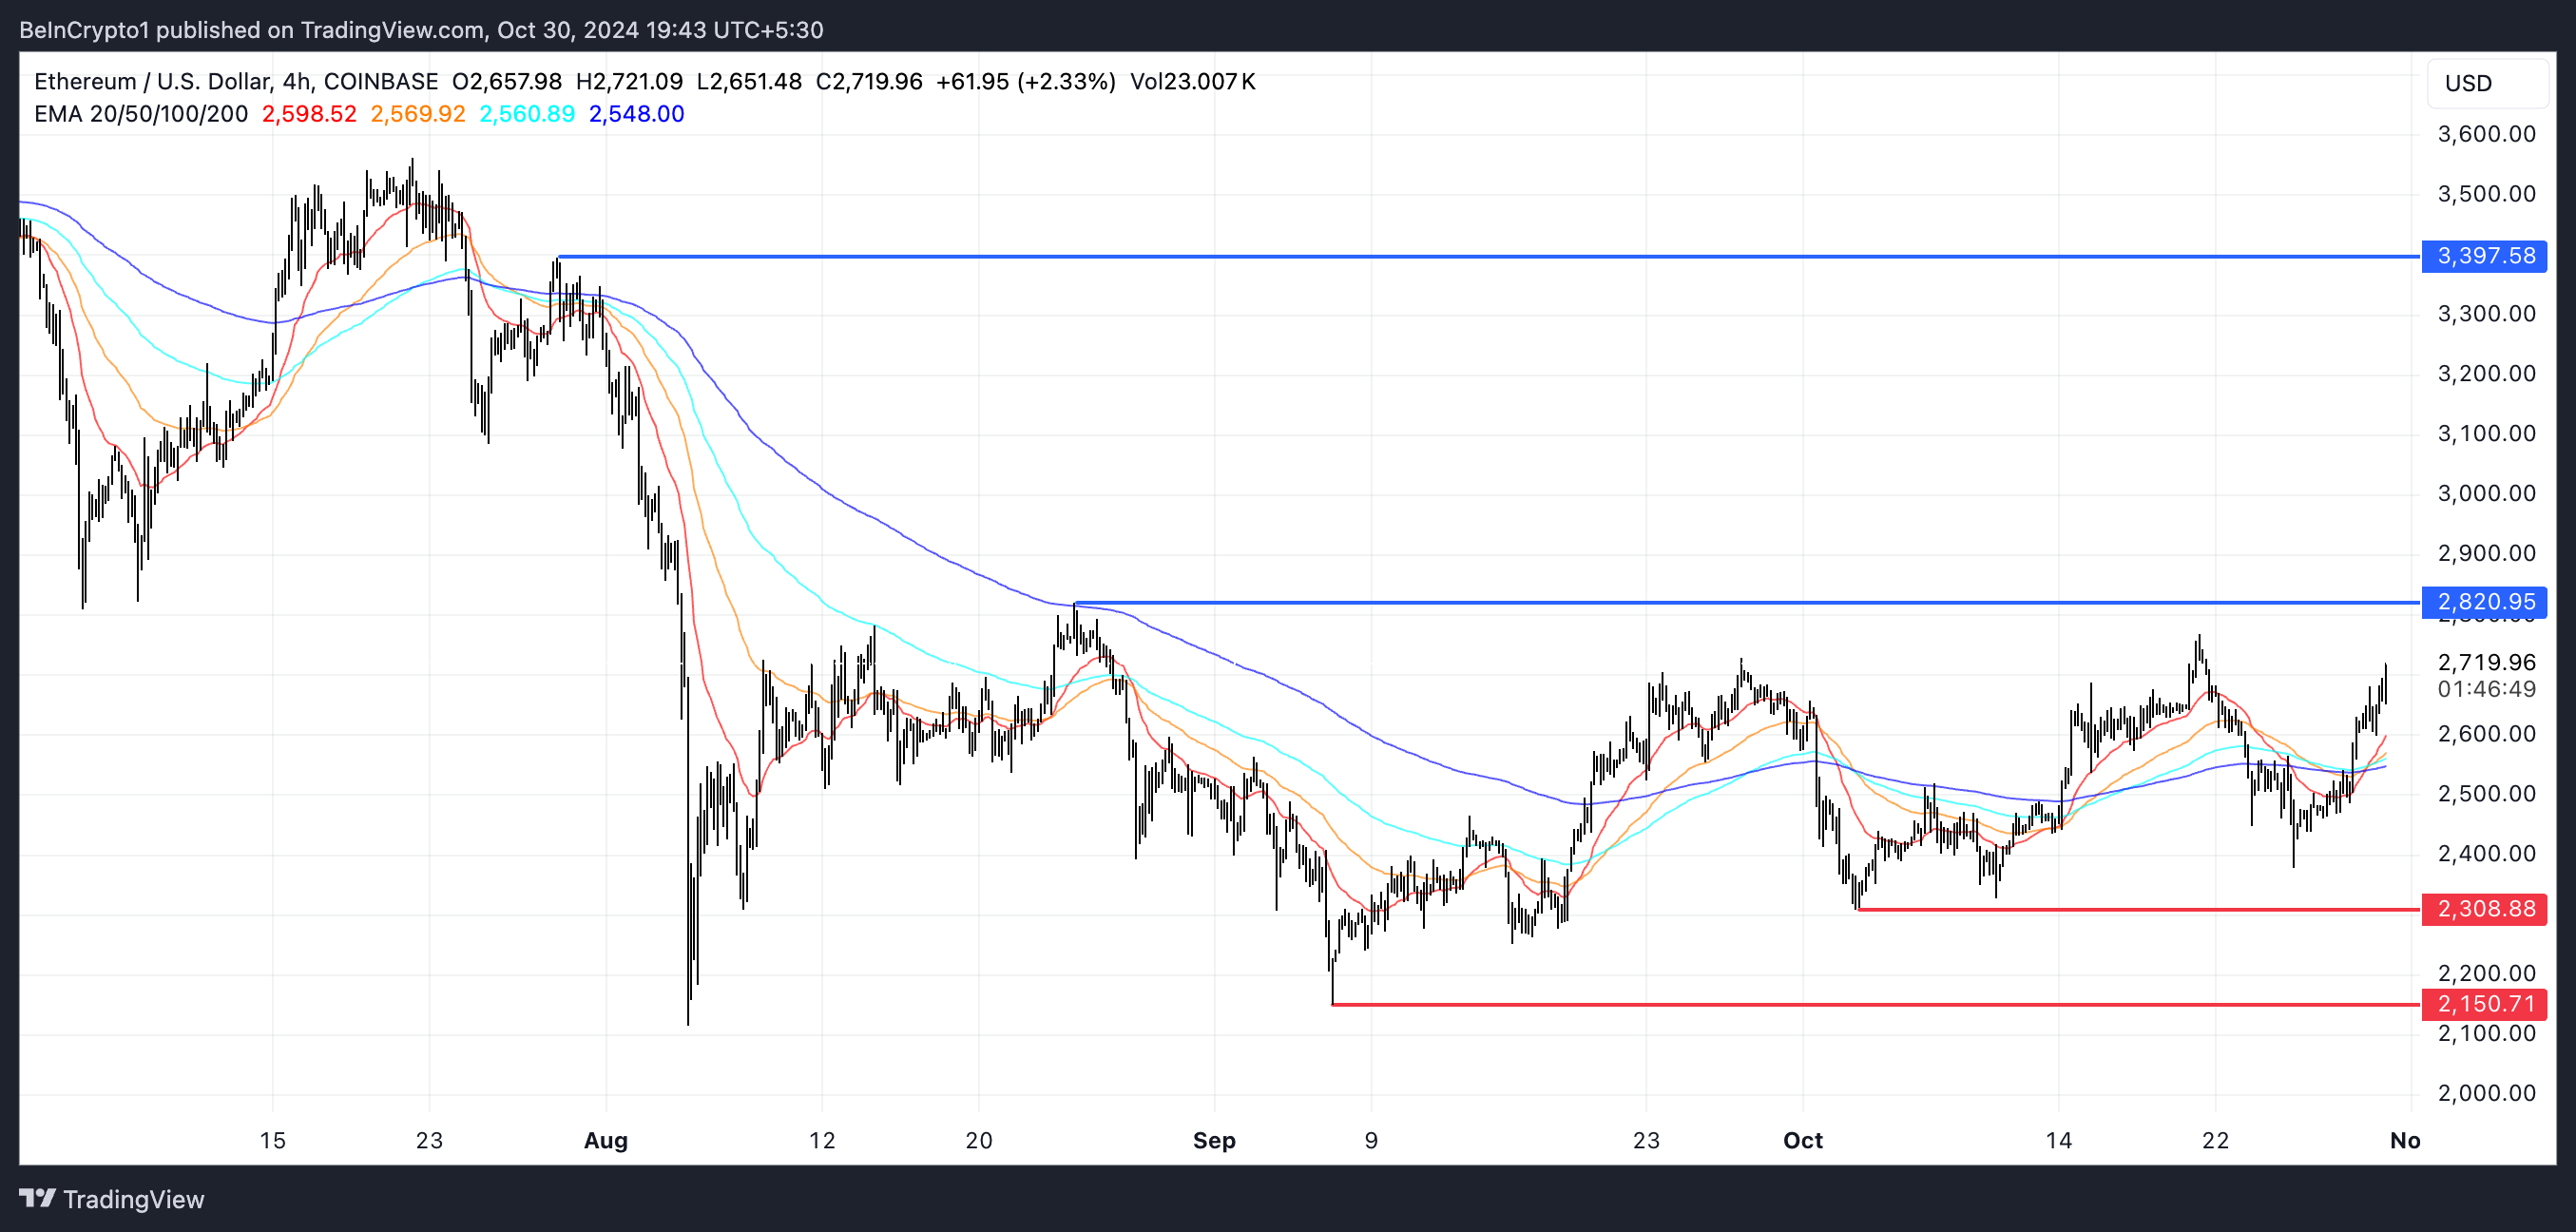
If the uptrend continues to gain strength, ETH could rise to test resistance at $2,820. If that level is broken, it could push further toward the $3,400 resistance, indicating a potential 25% price increase.
However, if the uptrend falters and a downtrend forms, ETH might test support levels around $2,308 and $2,150, implying a possible 20% correction.
Disclaimer
In line with the Trust Project guidelines, this price analysis article is for informational purposes only and should not be considered financial or investment advice. BeInCrypto is committed to accurate, unbiased reporting, but market conditions are subject to change without notice. Always conduct your own research and consult with a professional before making any financial decisions. Please note that our Terms and Conditions, Privacy Policy, and Disclaimers have been updated.


The European Central Bank (ECB) cut interest rates by another 25 basis points today, but the crypto market has hardly noticed. This highlights the European market’s declining influence over the crypto sector compared to the US.
Meanwhile, the crypto community is praying for rate cuts in the US, and false tariff rumors caused a massive pump. These policies still matter, but Europe is losing its macro influence.
The ECB Cuts Rates To Crypto Ambivalence
Global recession fears are circulating throughout the crypto market, and regulation plays a key role in them. US investors have been desperate for a rate cut in the hopes that it could provide a bullish narrative.
None has yet materialized. However, the ECB cut interest rates today for the sixth consecutive time, yet the crypto market barely reacted.
“The outlook for growth has deteriorated owing to rising trade tensions. Increased uncertainty is likely to reduce confidence among households and firms, and the adverse and volatile market response to the trade tensions is likely to have a tightening impact on financing conditions,” the ECB said in a public statement.
According to price data, the total crypto market cap has decreased by 0.2% since the ECB announced these rate cuts. Of the top 10 largest assets, all of them posted gains today except one.
Does this mean that macroeconomic factors are losing influence on crypto markets? That notion is demonstrably untrue. Less than two weeks ago, crypto had a huge rally after a false rumor that Trump would pause tariffs.
These gains came back when the pause actually happened. So, macro influence is still very strong in the current markets; it’s specifically that the ECB and Europe are losing influence.
The European Union isn’t the only economic bloc that’s losing its power in the space. Yesterday, the British government announced that inflation was lower than expected, potentially enabling another rate cut.
This, too, had a negligible impact on crypto. Macroeconomic concerns still impact the crypto market, but its strongest links are to the US and Asia.
A clear sign of this change in crypto happened months before the ECB cuts. Tether was forced to leave the EU due to MiCA regulations, but its business was minimally impacted.
It’s still the world’s largest stablecoin despite losing out on the entire European market. In fact, since then, it has taken steps to better integrate with US regulations.
Meanwhile, many large crypto businesses are reorienting towards Asia and the US and away from Europe. Earlier this year, a16z shut down its London office to focus on the US.
Tether relocated to El Salvador, giving it close proximity to the US and easier access to the Latin American market. This growth area is apparently more fruitful than trying again in Europe.
The ECB’s rate cuts barely impacted the crypto market, but that doesn’t mean that the industry will ignore the whole continent. Moving forward, however, EU operations will matter less and less to the largest companies.
This mirrors broader trends, as international capital is refocusing away from Europe. It’s only natural that crypto is part of that pattern.
Disclaimer
In adherence to the Trust Project guidelines, BeInCrypto is committed to unbiased, transparent reporting. This news article aims to provide accurate, timely information. However, readers are advised to verify facts independently and consult with a professional before making any decisions based on this content. Please note that our Terms and Conditions, Privacy Policy, and Disclaimers have been updated.

Cardano (ADA) has been trading below the $0.70 mark since March 29, struggling to regain bullish momentum. Despite brief signs of strength, recent indicators now point to weakening trend conditions.
Both the BBTrend and ADX show fading buying pressure, while EMA alignment remains bearish. With price stuck between key support and resistance levels, ADA’s next move could define its short-term direction.
Cardano BBTrend Turns Negative, Signaling Momentum Reversal
Cardano’s BBTrend has flipped negative, currently sitting at -0.78 after spending the last five days in positive territory. The indicator reached a peak of 9.76 on April 14, signaling strong bullish momentum at the time.
BBTrend, short for Bollinger Band Trend, measures the strength and direction of a price move relative to its Bollinger Bands.
Positive values typically indicate bullish trends, while negative values point to bearish conditions or weakening momentum.

The shift to -0.78 suggests that Cardano’s recent uptrend has lost strength and may be reversing. A negative BBTrend reading means the price is now moving closer to the lower band, often a sign of rising selling pressure.
While it doesn’t confirm a strong downtrend yet, this reversal could indicate the beginning of a broader consolidation or bearish phase unless momentum quickly recovers.
Traders may want to watch closely for follow-through or a bounce to assess ADA’s short-term direction.
Cardano Momentum Fades as ADX Crashes and Selling Pressure Rises
Cardano’s DMI chart shows a sharp drop in trend strength, with its ADX falling to 15.12 from 28.34 just two days ago.
The ADX (Average Directional Index) measures trend intensity—readings above 25 suggest a strong trend, while values below 20 indicate a weak or consolidating market.
The steep decline in the ADX signals that the momentum behind Cardano’s recent move is quickly fading.

At the same time, the +DI (bullish directional indicator) has dropped from 22.61 to 17.39, showing weakening buying pressure. Meanwhile, the -DI (bearish indicator) has risen from 10.5 to 14.95, pointing to a gradual increase in selling strength.
With both the ADX and +DI falling, and -DI climbing, the setup hints at a potential shift in favor of the bears.
Unless bullish momentum returns quickly, Cardano could enter a period of sideways movement or even a short-term downtrend.
Bearish Structure Still Dominates Cardano
Cardano’s EMA lines remain bearish, with short-term averages still positioned below the long-term ones—indicating that downward momentum is intact.
Cardano price is holding above a key support zone near $0.594, but if this level fails, it could trigger a deeper drop toward $0.511. This would confirm a continuation of the downtrend and reflect growing selling pressure.
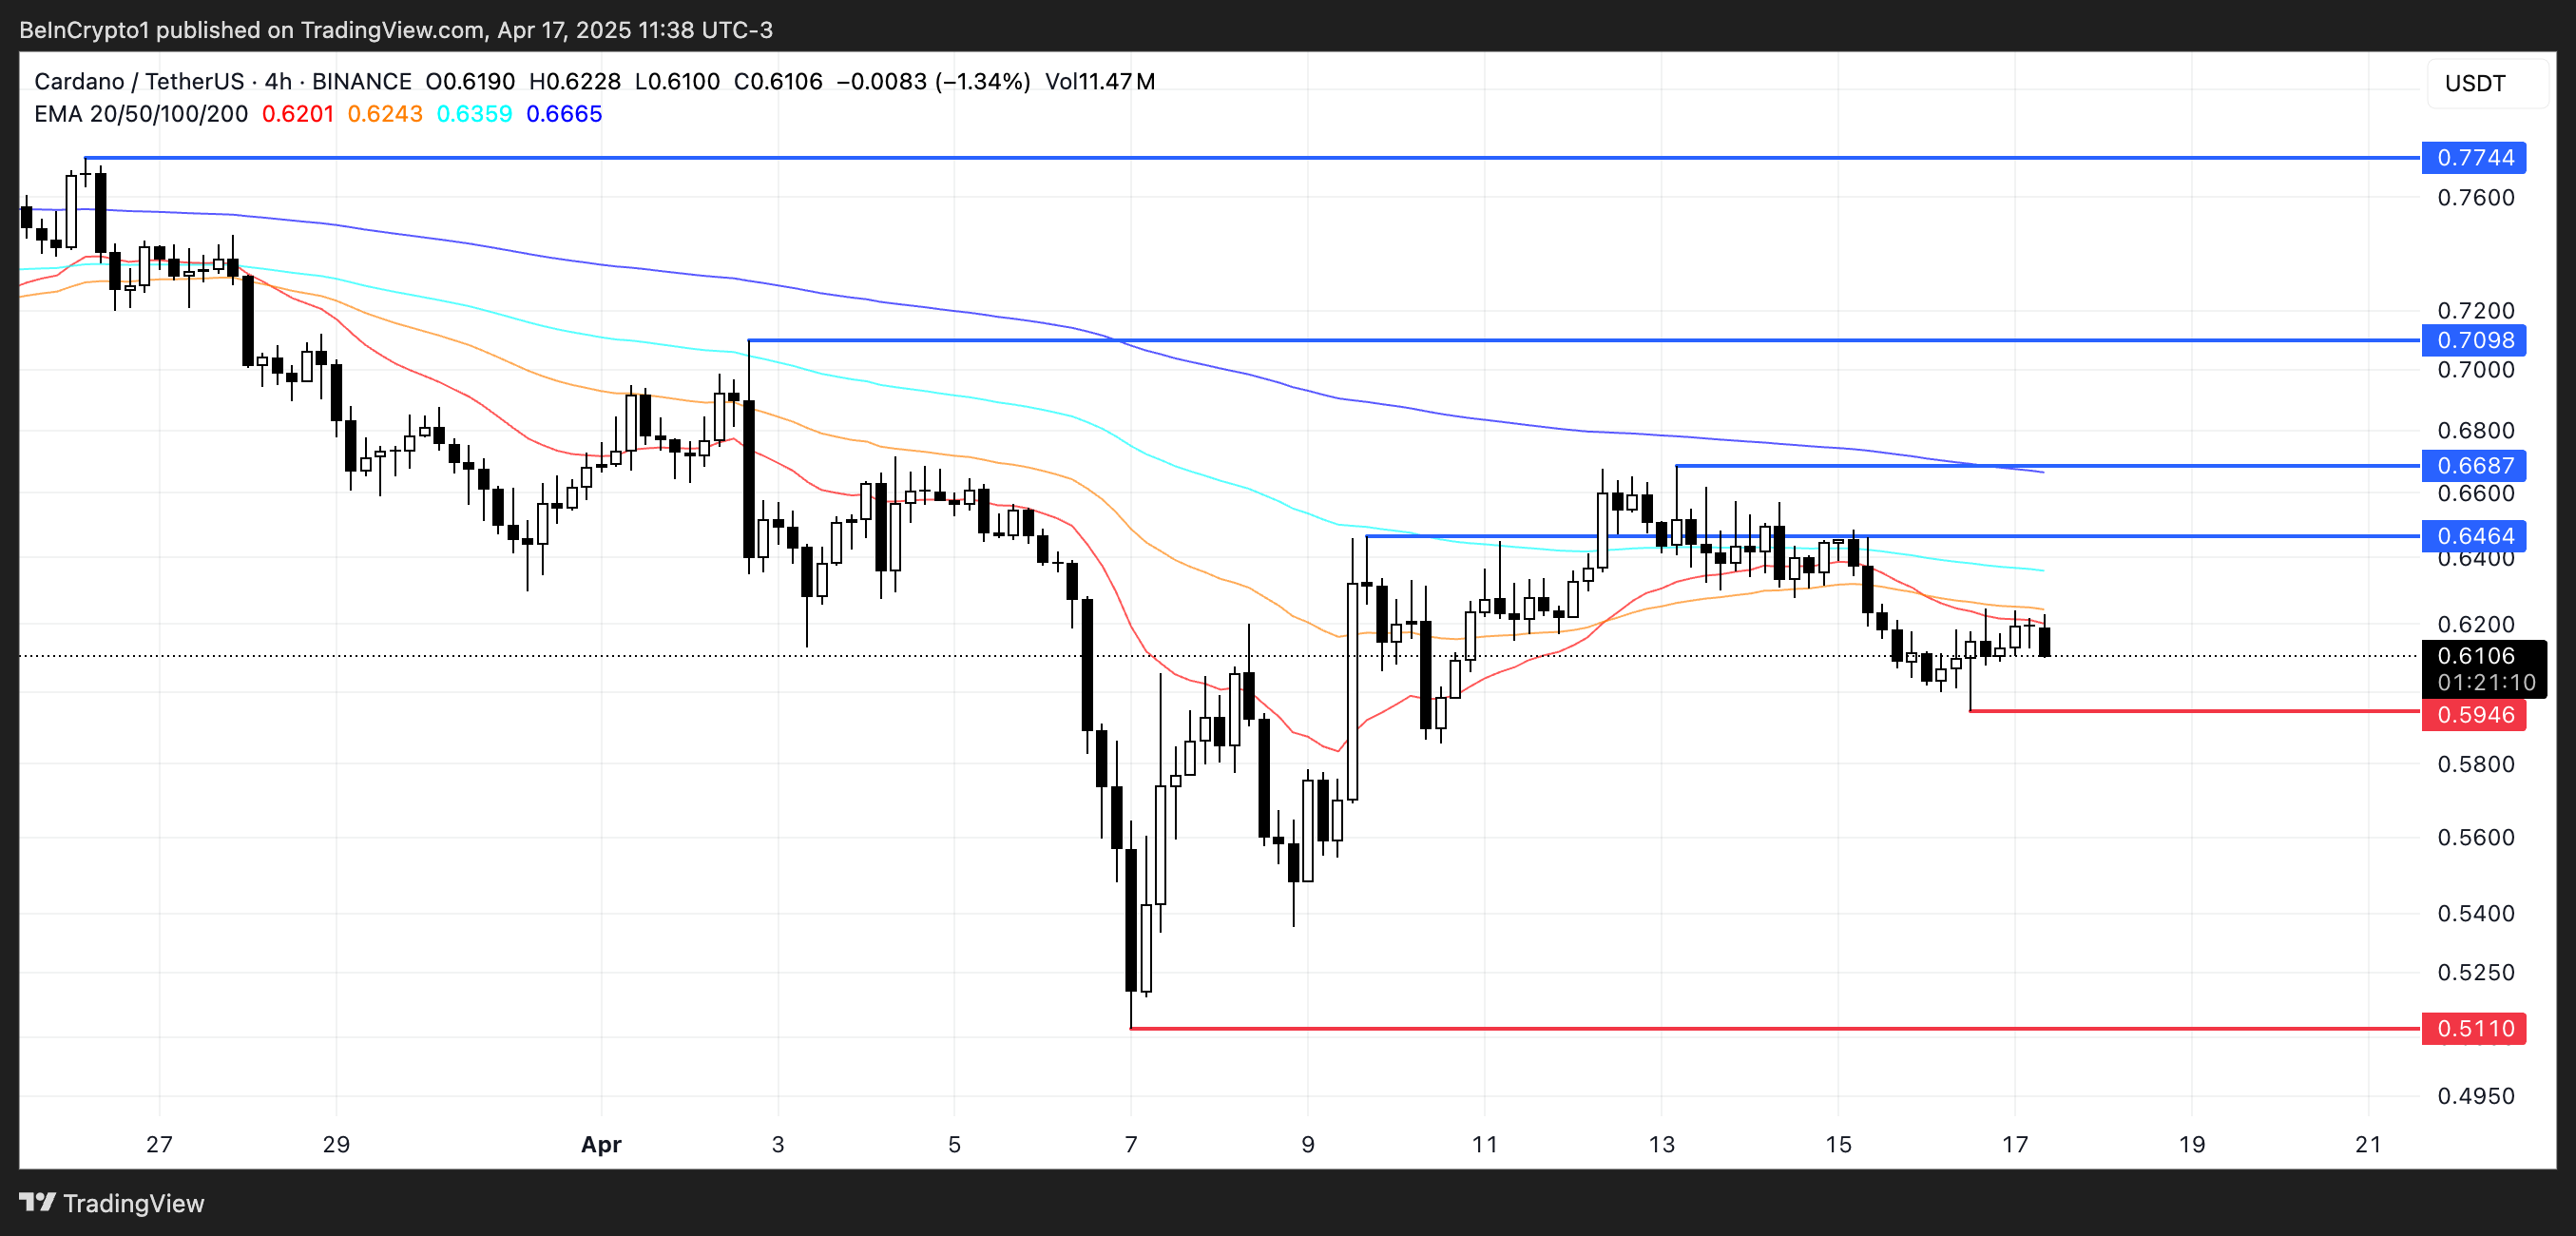
However, if ADA manages to reverse its current momentum, the first major resistance lies at $0.64. A breakout above that level could open the door to further gains, with potential targets at $0.66 and $0.70.
If the uptrend strengthens, ADA could even rally toward $0.77, marking a more decisive recovery and trend shift.
Disclaimer
In line with the Trust Project guidelines, this price analysis article is for informational purposes only and should not be considered financial or investment advice. BeInCrypto is committed to accurate, unbiased reporting, but market conditions are subject to change without notice. Always conduct your own research and consult with a professional before making any financial decisions. Please note that our Terms and Conditions, Privacy Policy, and Disclaimers have been updated.
Bitcoin (BTC) has been trading in a tight range between $83,000 and $86,000 over the past five days, showing signs of indecision in both price action and momentum indicators.
While the number of whale wallets has started to decline, on-chain data still reflects elevated interest from large holders. Technically, BTC remains in a consolidation phase, with weak EMA signals and mixed Ichimoku readings.
Bitcoin Whales Pull Back: Early Sign of Fading Confidence?
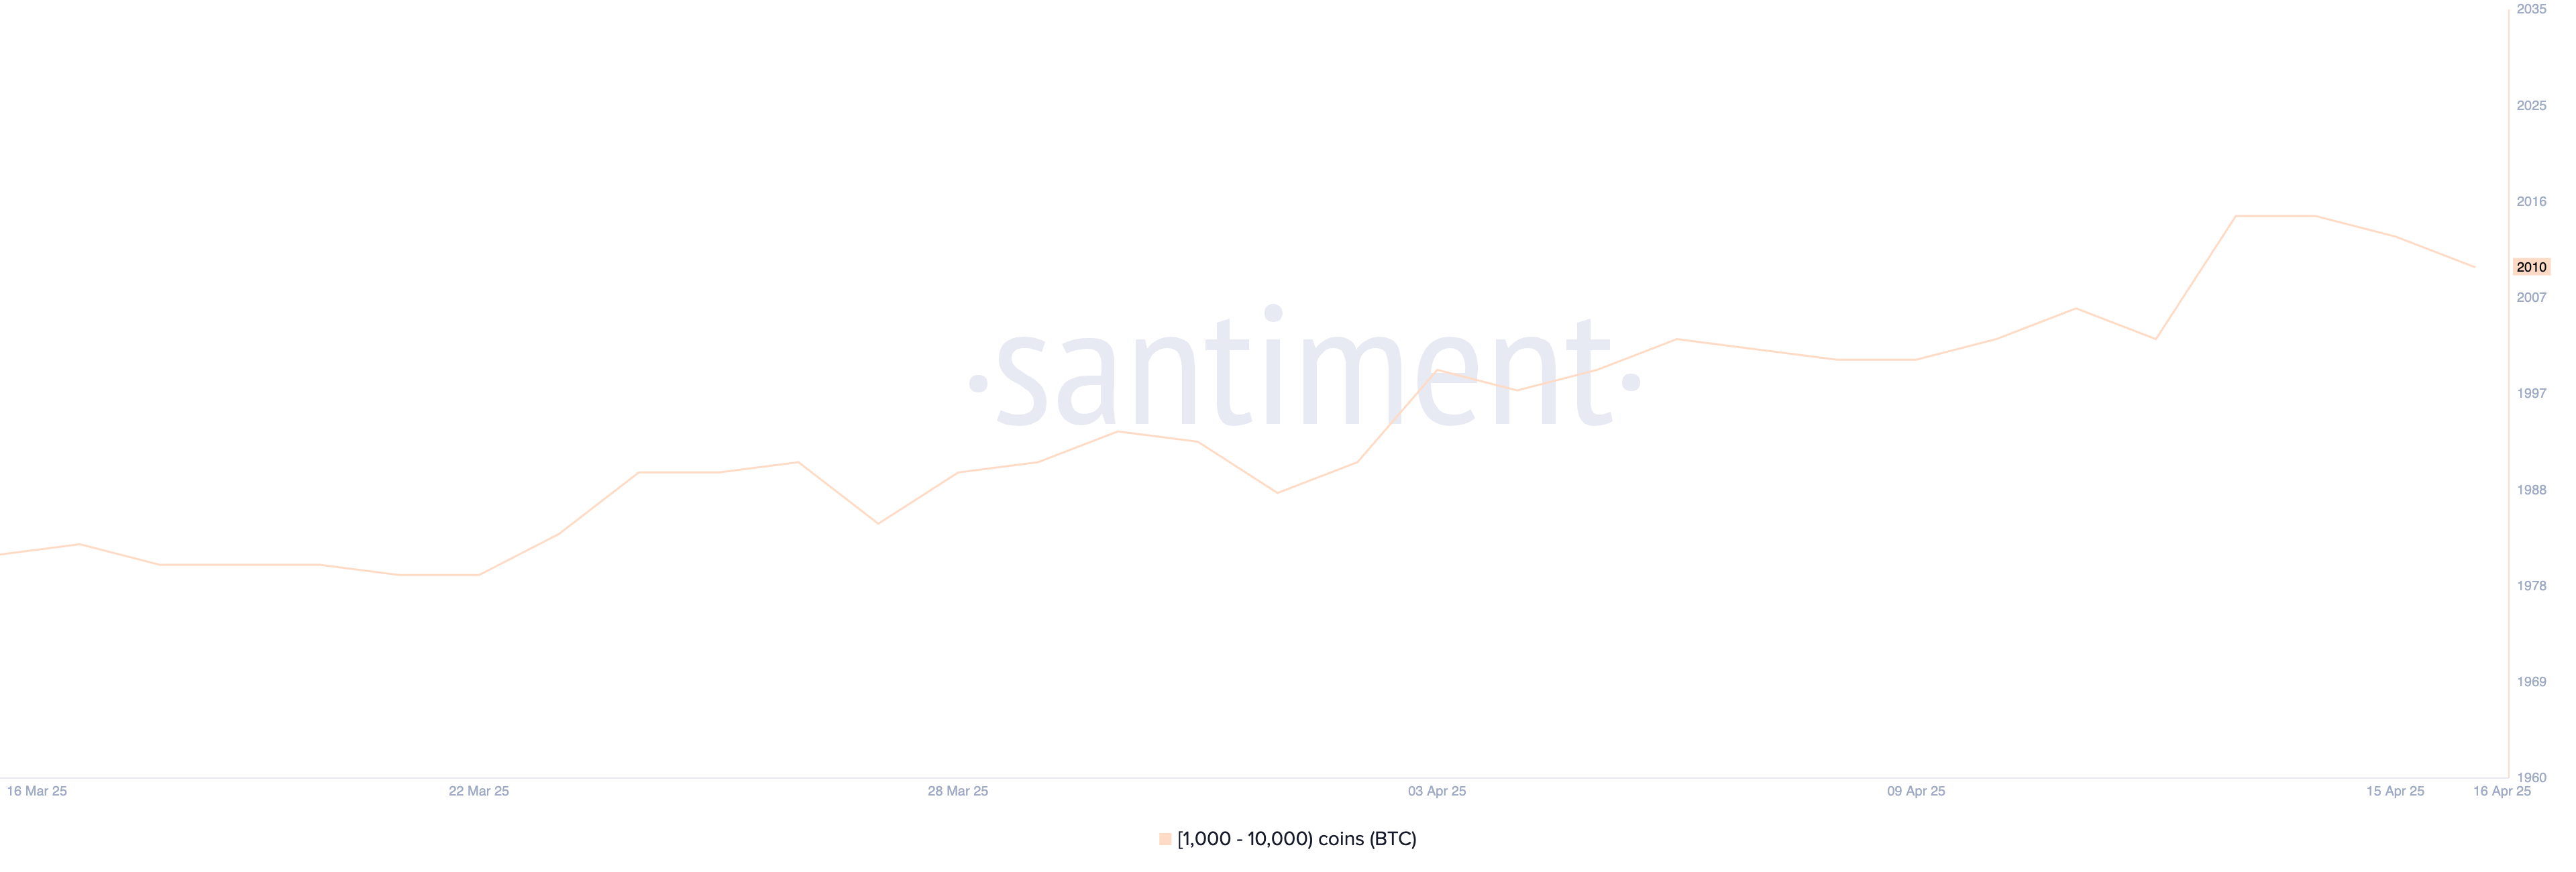
The number of Bitcoin whales—wallets holding between 1,000 and 10,000 BTC—has declined slightly in recent days, dropping from 2,015 on April 14 to 2,010 by April 16.
This pullback comes just after the metric hit its highest level since May 2024, suggesting a potential shift in sentiment among large holders.
While the drop may seem small, movements in whale behavior often precede broader market trends, making even slight changes worth watching.
Whale activity is a key on-chain signal because these large holders can significantly influence market liquidity and price direction.
An increase in whale wallets often reflects accumulation and long-term confidence, while a decline may suggest strategic profit-taking or risk-off behavior.
The recent dip from the local peak could indicate that some whales are trimming exposure as market uncertainty rises. If the number continues to fall, it may signal weakening institutional conviction, potentially putting short-term pressure on Bitcoin’s price.
Bitcoin Stalls Near Ichimoku Pivot as Momentum Fades
The Ichimoku Cloud chart for Bitcoin shows a period of consolidation, with the price currently trading near the flat Tenkan-sen (blue line) and Kijun-sen (red line).
This alignment suggests a lack of short-term momentum, as both lines are moving sideways, indicating equilibrium between buyers and sellers.
The Kumo (cloud) ahead is bullish, with the Senkou Span A (green cloud boundary) above the Senkou Span B (red cloud boundary), but the distance between them is relatively narrow.
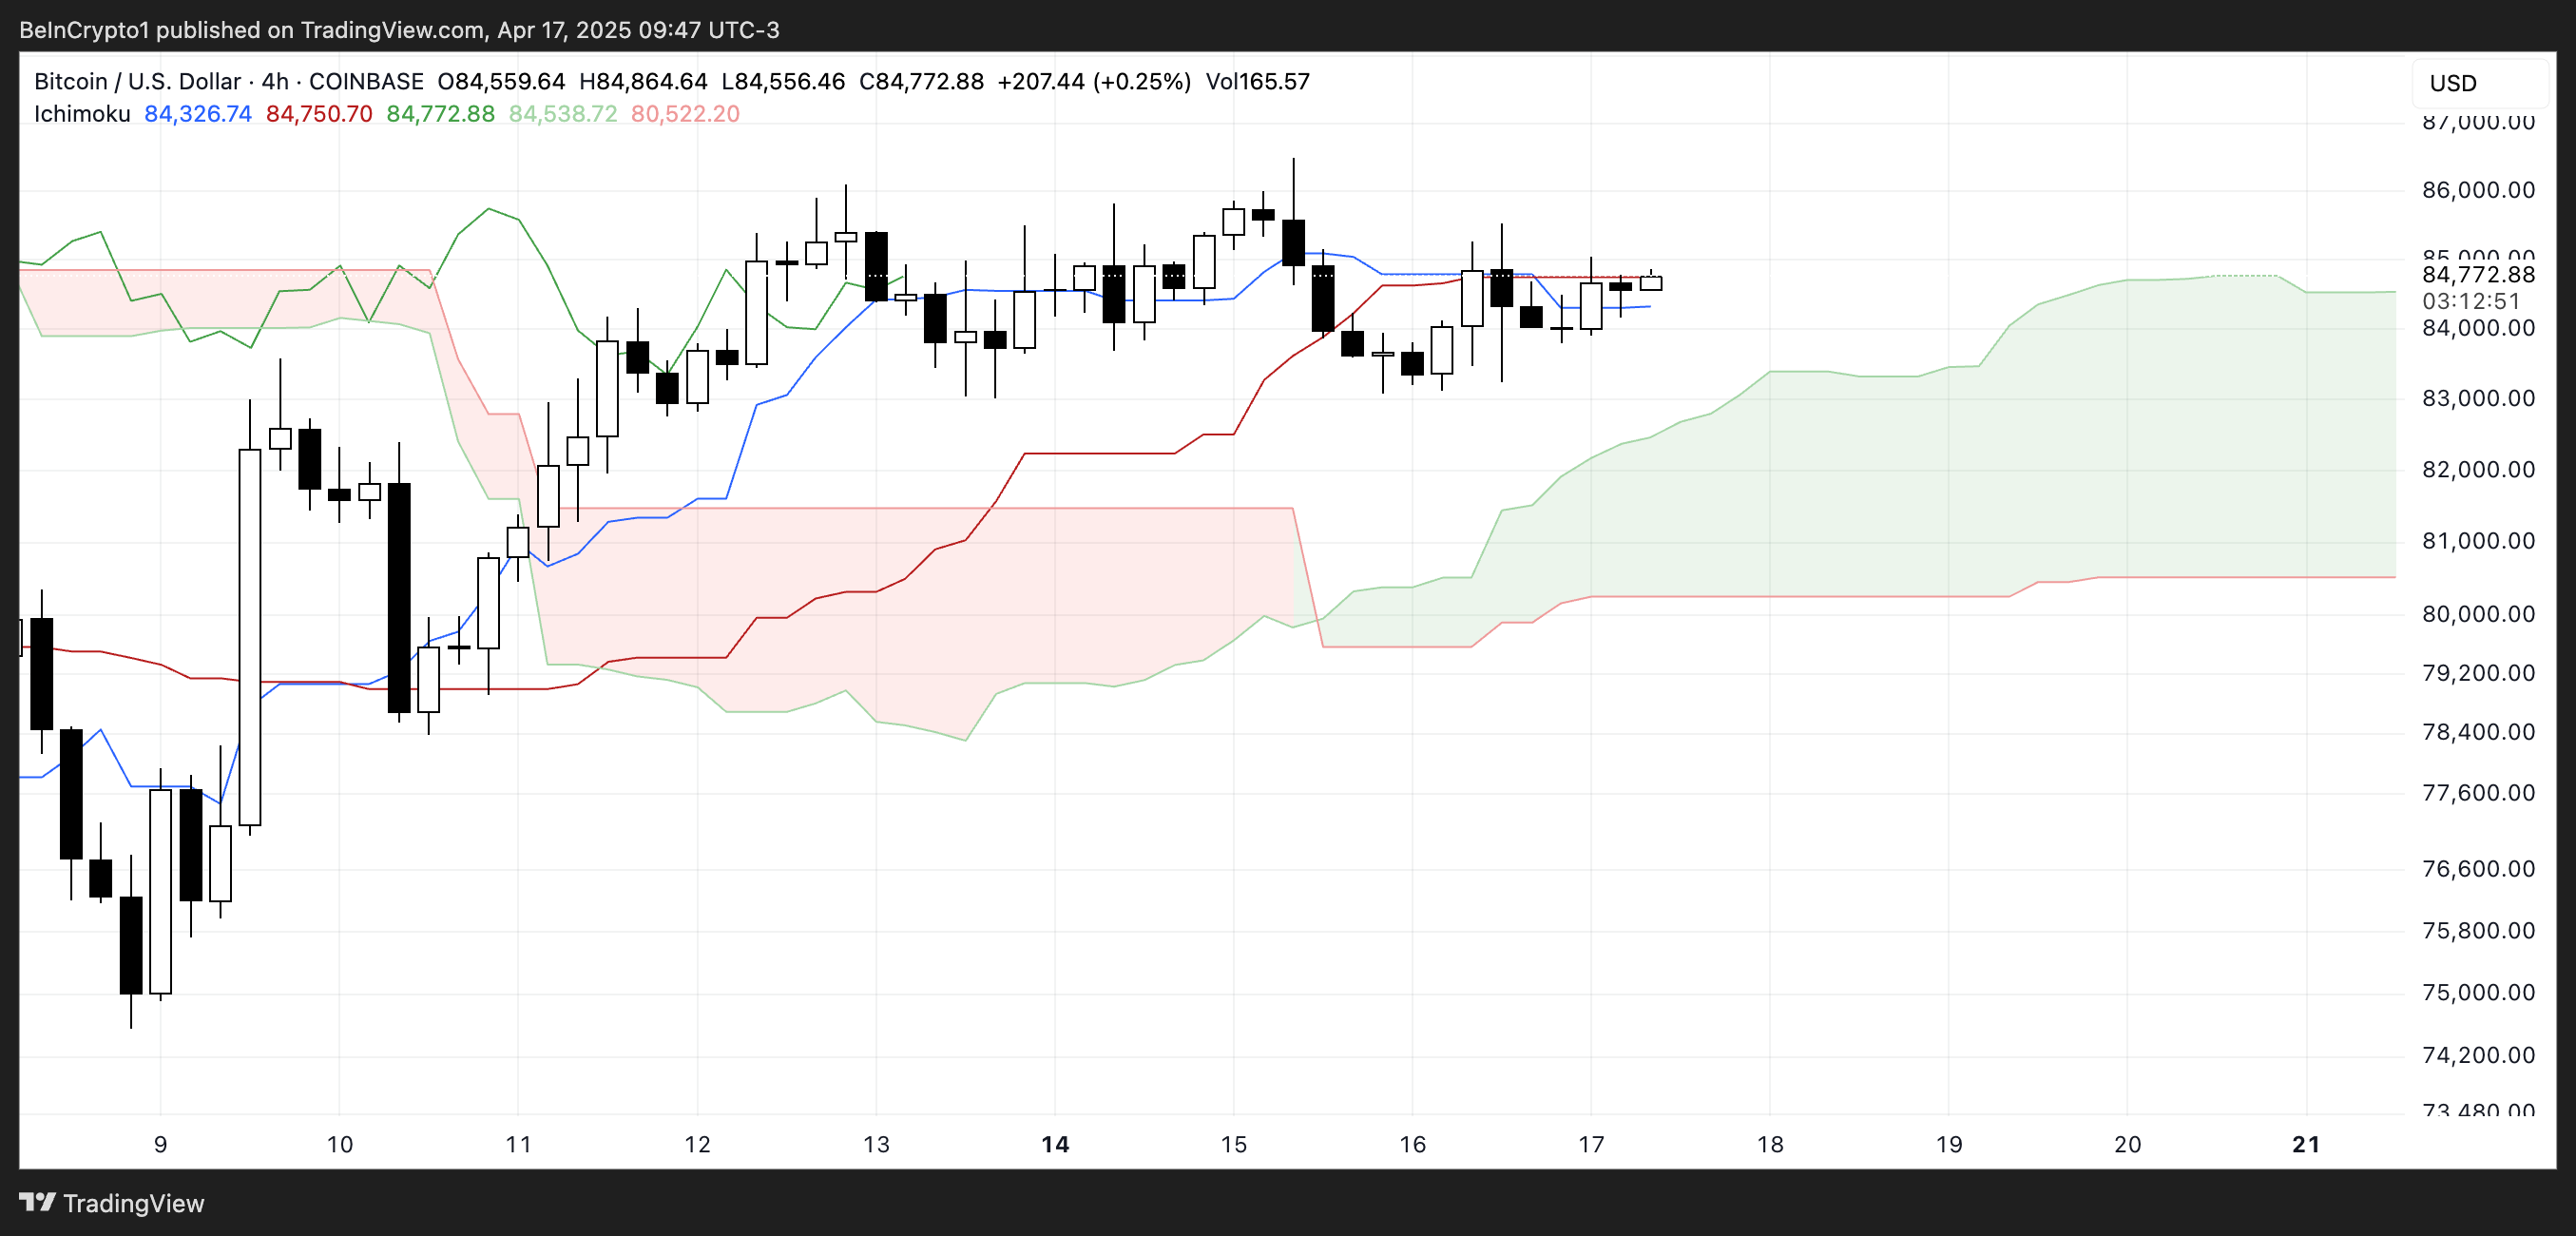
This hints at weak bullish momentum for now. The price is sitting just above the cloud, which is a positive sign, but without a clear breakout above the Tenkan-sen and recent highs, the trend remains indecisive.
Chikou Span (lagging line) is overlapping with recent candles, reinforcing the sideways movement.
Overall, Bitcoin is hovering in a neutral-to-slightly-bullish zone, but it needs a stronger push to confirm a clear trend direction.
Bitcoin Struggles for Direction as Key Levels Loom
Bitcoin’s EMA lines are currently flat, indicating a weak and uncertain trend. The price action shows hesitation, with bulls and bears lacking conviction.
If the support level at $83,583 is tested and fails to hold, the market could enter a sharper correction, targeting the next support at $81,177.
A break below that could push Bitcoin price under the psychological $80,000 level once again, with $79,890 as the next possible downside target.
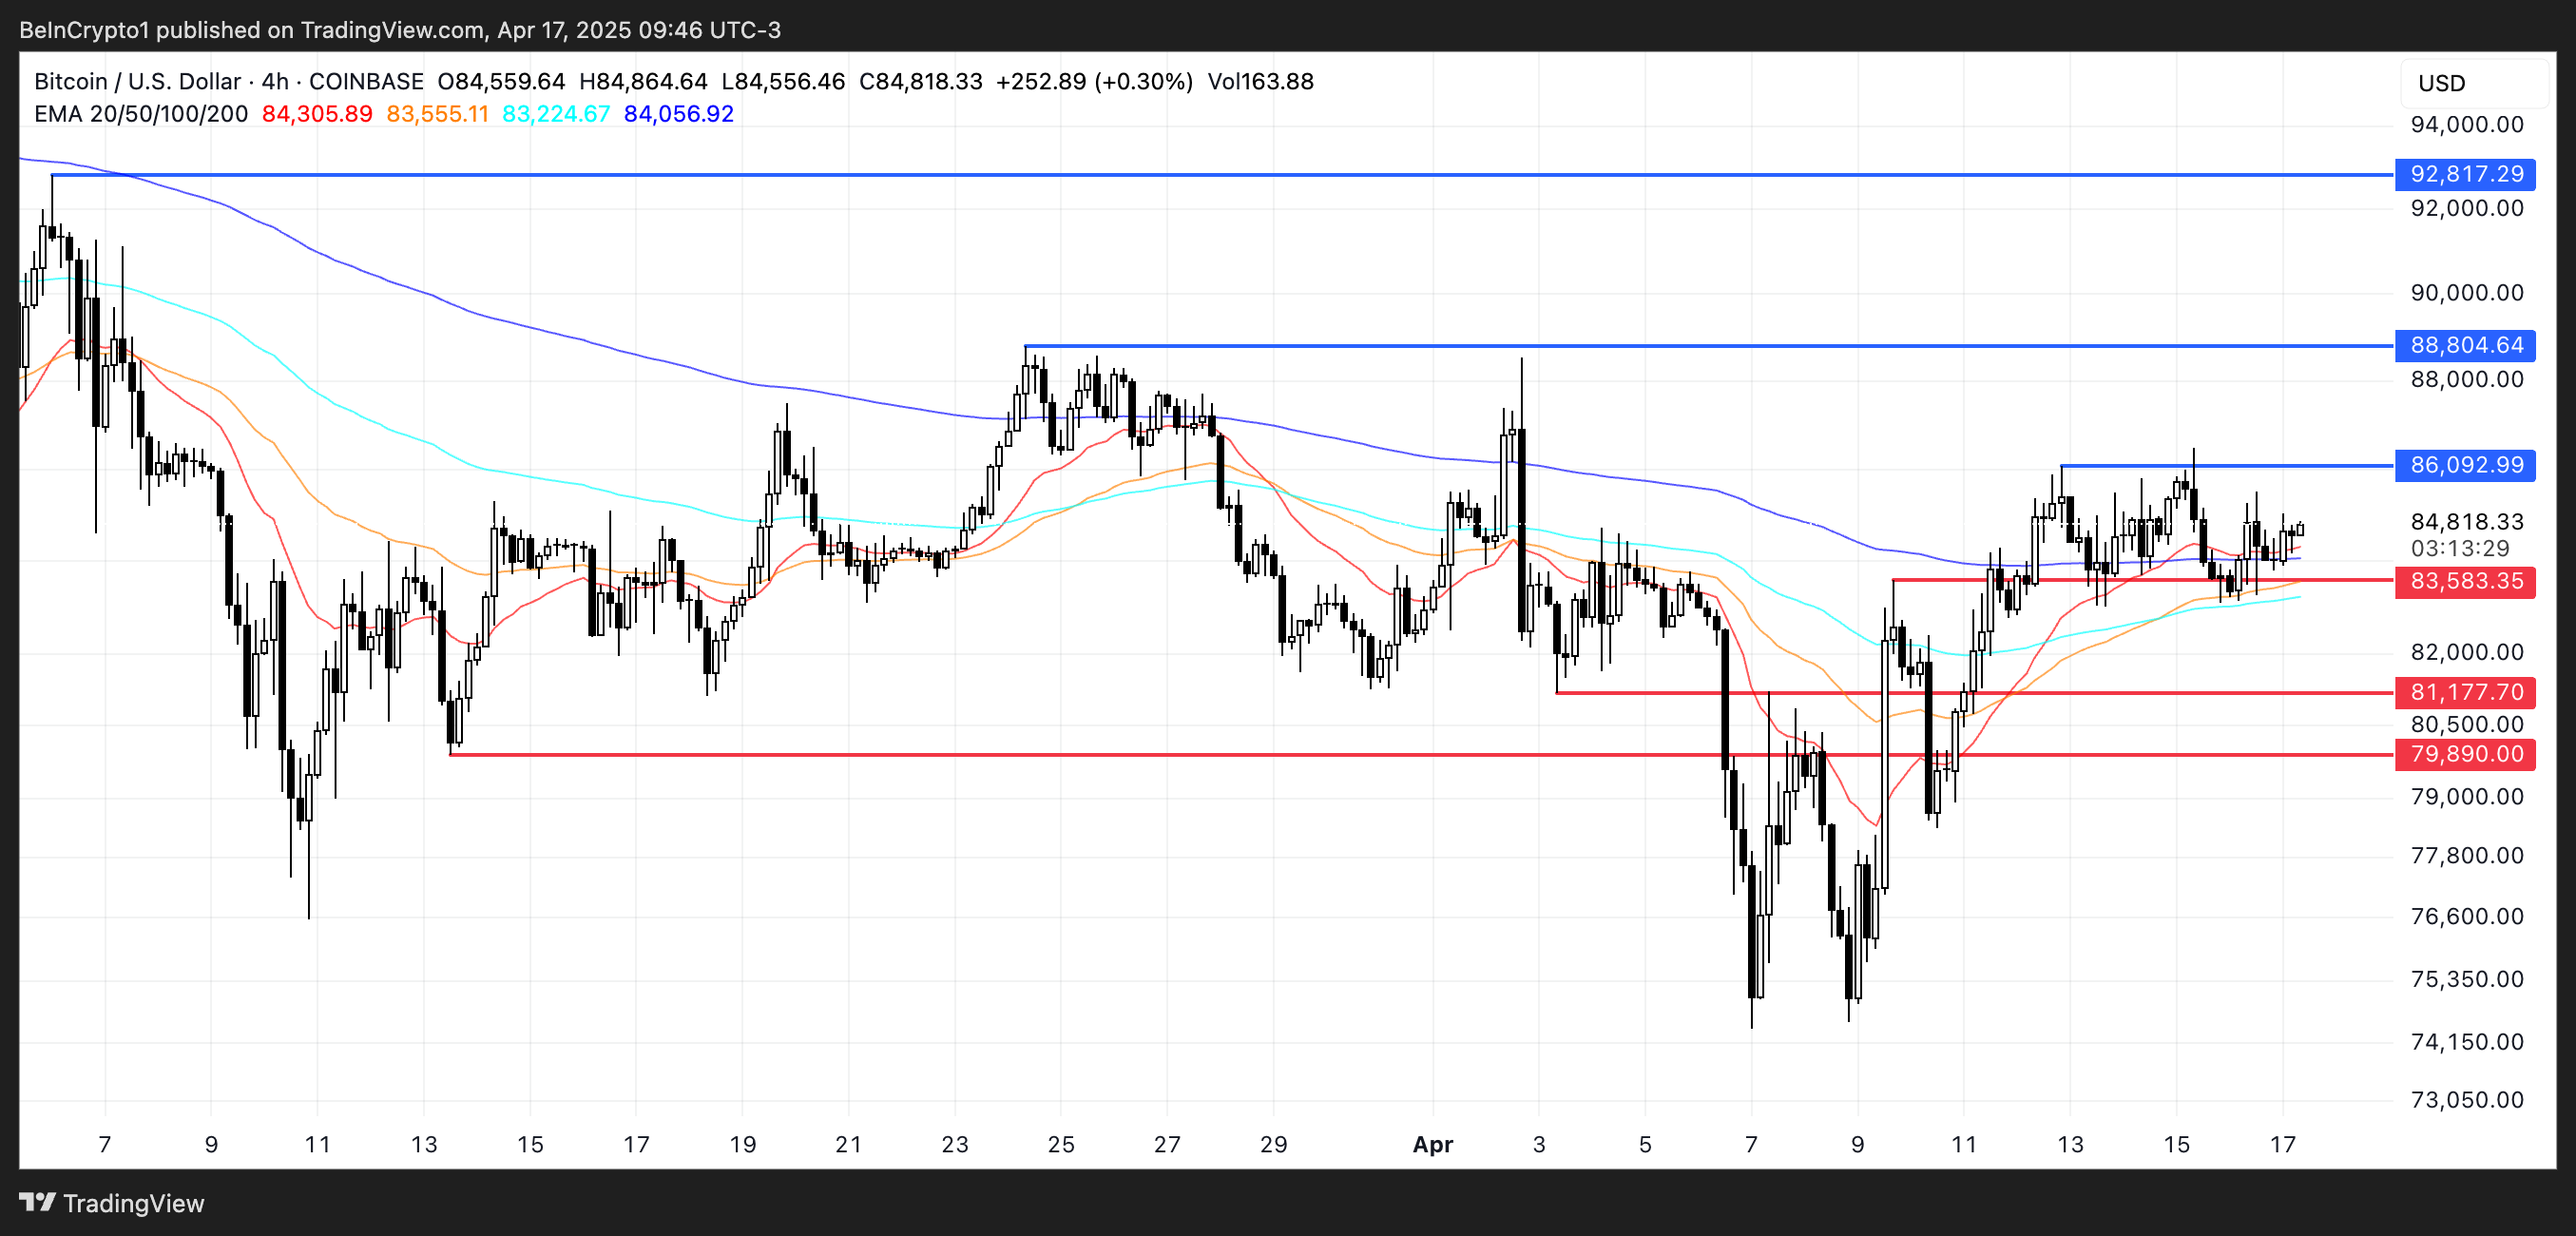
However, if bulls manage to regain control, Bitcoin could shift toward recovery. The first key resistance lies at $86,092—breaking this level would suggest renewed upward momentum.
From there, the next upside targets would be $88,804 and, if the trend strengthens further, $92,817.
Reaching this level would mean breaking above the $90,000 mark for the first time since March 7, potentially sparking renewed interest from both retail and institutional investors.
Disclaimer
In line with the Trust Project guidelines, this price analysis article is for informational purposes only and should not be considered financial or investment advice. BeInCrypto is committed to accurate, unbiased reporting, but market conditions are subject to change without notice. Always conduct your own research and consult with a professional before making any financial decisions. Please note that our Terms and Conditions, Privacy Policy, and Disclaimers have been updated.

Crypto Ignores ECB Rate Cuts, Highlighting EU’s Fading Influence

Cardano (ADA) Price Flat as Bulls Stay on Sidelines

Ethereum Whales Offload 143,000 ETH In One Week – More Selling Ahead?

Bitcoin (BTC) Stays Flat as Whales Reduce Market Exposure
Crypto Casino Founder Charged With Fraud in New York

CZ Honors Nearly $1 Billion Token Burn Promise

2.52 Million Altcoins Are Ruining Crypto’s Future

Animoca Brands Valuation Tanks 75% In Two Years, Here’s Why

Crypto exchange BingX hacked for $43 million

Are The Big Players Losing Interest?

Hong Kong’s Securities Association Tips Authorities On Crypto Self-Regulation

Coinbase cbBTC Set to go Live on Solana
2.52 Million Altcoins Are Ruining Crypto’s Future
Animoca Brands Valuation Tanks 75% In Two Years, Here’s Why
Crypto exchange BingX hacked for $43 million
Are The Big Players Losing Interest?
Hong Kong’s Securities Association Tips Authorities On Crypto Self-Regulation
Coinbase cbBTC Set to go Live on Solana
-

 Market22 hours ago
Crypto Market Lost $633 Billion in Q1 2025, CoinGecko Finds
-

 Bitcoin23 hours ago
ETF Issuers Bring Stability to Bitcoin Despite Tariff Chaos
-

 Market23 hours ago
Base Meme Coin Wipes $15 Million After Official Promotion
-

 Market21 hours ago
PEPE Price To Bounce 796% To New All-Time Highs In 2025? Here’s What The Chart Says
-

 Market24 hours ago
Here’s What Happens If The XRP Price Closes Out This Week Above $2.25
-

 Market16 hours ago
Bitcoin and Global M2 Money Supply: A Misleading Connection?
-

 Market18 hours ago
No Rate Cut Soon, Crypto Banking Rules to Ease
-

 Market17 hours ago
Ethereum Price Struggles to Rebound—Key Hurdles In The Way
