
Market
Will BONK See a Multi-Month Low Due to Investors’ Skepticism?

BONK price will likely witness a bearish outcome as the meme coin craze is seemingly ending.
The enthusiasm among meme coin holders is declining rapidly, which is visible in their actions.
BONK Investors Pull Back
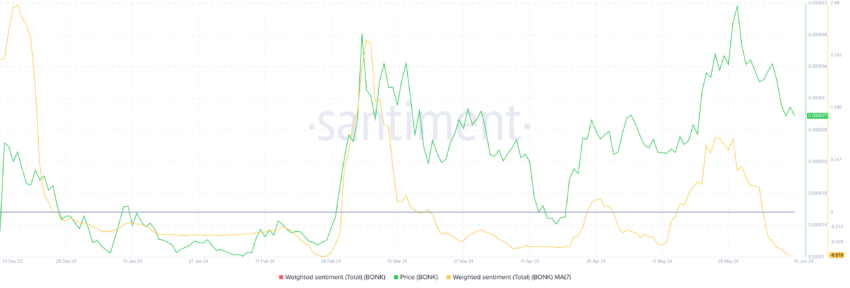
BONK’s price enjoyed its holders’ optimism, but as the macro conditions turn unfavorable for the crypto market, this optimism seems to be fading away. This is clearly evident in the weighted sentiment of all BONK investors.
This metric combines and analyses all the mentions and expressions pertaining to a topic. The data helps to provide a more nuanced view of public opinion or investor sentiment. Upticks suggest bullishness, while downticks hint at bearishness.
In the case of BONK, the investors’ sentiment, which turned bearish at the beginning of the month, is intensifying.
The impact of this intensifying skepticism is visible in the meme coin’s funding rate. The funding rate is a periodic payment exchanged between traders in a futures contract to keep the contract price aligned with the spot price.
It reflects the difference between perpetual futures prices and spot prices, where a positive rate indicates a bullish market, and a negative rate indicates a bearish market. Generally, positive rates suggest the dominance of long contracts over short ones and vice versa.
BONK, while maintaining a positive funding rate, is noting a decline. This shows that traders are liquidating and pulling out long contracts.
Read More: How to Buy Solana Meme Coins: A Step-By-Step Guide
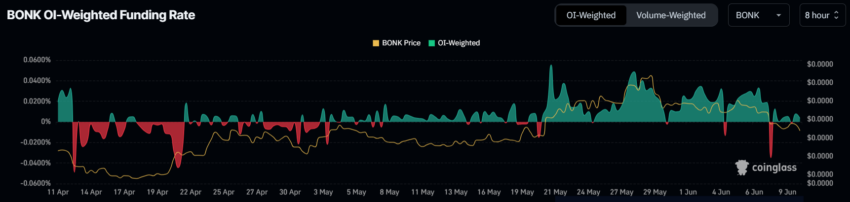
As the price drops further, it won’t be surprising to see the funding rate become negative.
BONK Price Prediction: Keeping Above a Key Support
BONK price is holding above the critical support of $0.00002748, a level that has been tested as support and resistance. The chances of a decline below this line are significant, and the meme coin could thus fall to $0.00002153.
The aforementioned conditions do hint at a further decline, although $0.00002000 will act as a support floor. This will potentially prevent BONK from falling any lower.
Read More: Bonk Airdrop Eligibility: Who Can Claim and How?
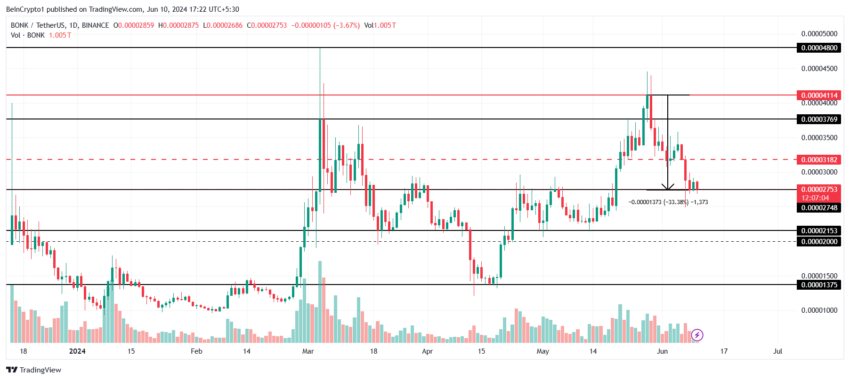
But if the broader market conditions improve, BONK could capitalize on it and bounce back. Should the breakdown fail or the meme coin recover mid-way, a recovery to $0.00003000 is on the cards. Breaching the same would invalidate the bearish thesis.
Disclaimer
In line with the Trust Project guidelines, this price analysis article is for informational purposes only and should not be considered financial or investment advice. BeInCrypto is committed to accurate, unbiased reporting, but market conditions are subject to change without notice. Always conduct your own research and consult with a professional before making any financial decisions. Please note that our Terms and Conditions, Privacy Policy, and Disclaimers have been updated.


Reason to trust
![]()
Strict editorial policy that focuses on accuracy, relevance, and impartiality
Created by industry experts and meticulously reviewed
The highest standards in reporting and publishing
Strict editorial policy that focuses on accuracy, relevance, and impartiality
Morbi pretium leo et nisl aliquam mollis. Quisque arcu lorem, ultricies quis pellentesque nec, ullamcorper eu odio.
Ethereum price started another decline and traded below the $1,850 level. ETH is now consolidating and facing key hurdles near the $1,850 level.
- Ethereum struggled to continue higher above the $1,980 resistance level.
- The price is trading below $1,860 and the 100-hourly Simple Moving Average.
- There was a break above a connecting bearish trend line with resistance at $1,810 on the hourly chart of ETH/USD (data feed via Kraken).
- The pair must clear the $1,850 and $1,880 resistance levels to start a decent increase.
Ethereum Price Attempts Recovery
Ethereum price failed to continue higher above $2,050 and started another decline, like Bitcoin. ETH declined below the $1,880 and $1,850 support levels.
It tested the $1,765 zone. A low was formed at $1,767 and the price recently started a short-term recovery wave. The price climbed above the $1,800 resistance. There was a move above the 23.6% Fib retracement level of the downward move from the $2,033 swing high to the $1,767 low.
There was also a break above a connecting bearish trend line with resistance at $1,810 on the hourly chart of ETH/USD. Ethereum price is now trading below $1,860 and the 100-hourly Simple Moving Average.
On the upside, the price seems to be facing hurdles near the $1,850 level. The next key resistance is near the $1,860 level. The first major resistance is near the $1,900 level and the 50% Fib retracement level of the downward move from the $2,033 swing high to the $1,767 low.

A clear move above the $1,900 resistance might send the price toward the $2,000 resistance. An upside break above the $2,000 resistance might call for more gains in the coming sessions. In the stated case, Ether could rise toward the $2,050 resistance zone or even $2,120 in the near term.
Another Decline In ETH?
If Ethereum fails to clear the $1,850 resistance, it could start another decline. Initial support on the downside is near the $1,800 level. The first major support sits near the $1,780 zone.
A clear move below the $1,780 support might push the price toward the $1,765 support. Any more losses might send the price toward the $1,710 support level in the near term. The next key support sits at $1,665.
Technical Indicators
Hourly MACD – The MACD for ETH/USD is losing momentum in the bearish zone.
Hourly RSI – The RSI for ETH/USD is now above the 50 zone.
Major Support Level – $1,800
Major Resistance Level – $1,850

Made in USA coins continue to try a rebound, with Solana (SOL), RENDER, and Jupiter (JUP) standing out as key names to watch in April. Despite recent price corrections, each of these tokens plays a major role in high-growth areas like DeFi, AI, and blockchain infrastructure.
Solana has seen its price dip, but ecosystem activity remains strong; RENDER is riding the wave of AI demand despite market turbulence; and Jupiter is showing solid usage metrics even as its token struggles. Here’s a closer look at the technical and fundamental setups for each of these standout U.S.-based projects.
Solana (SOL)
Solana has faced a notable price correction over the past week, with its value dropping nearly 13%. If this bearish momentum continues, the token could be on track to retest the critical support level at $120.
A breakdown below that could see SOL sliding further toward the $112 mark.
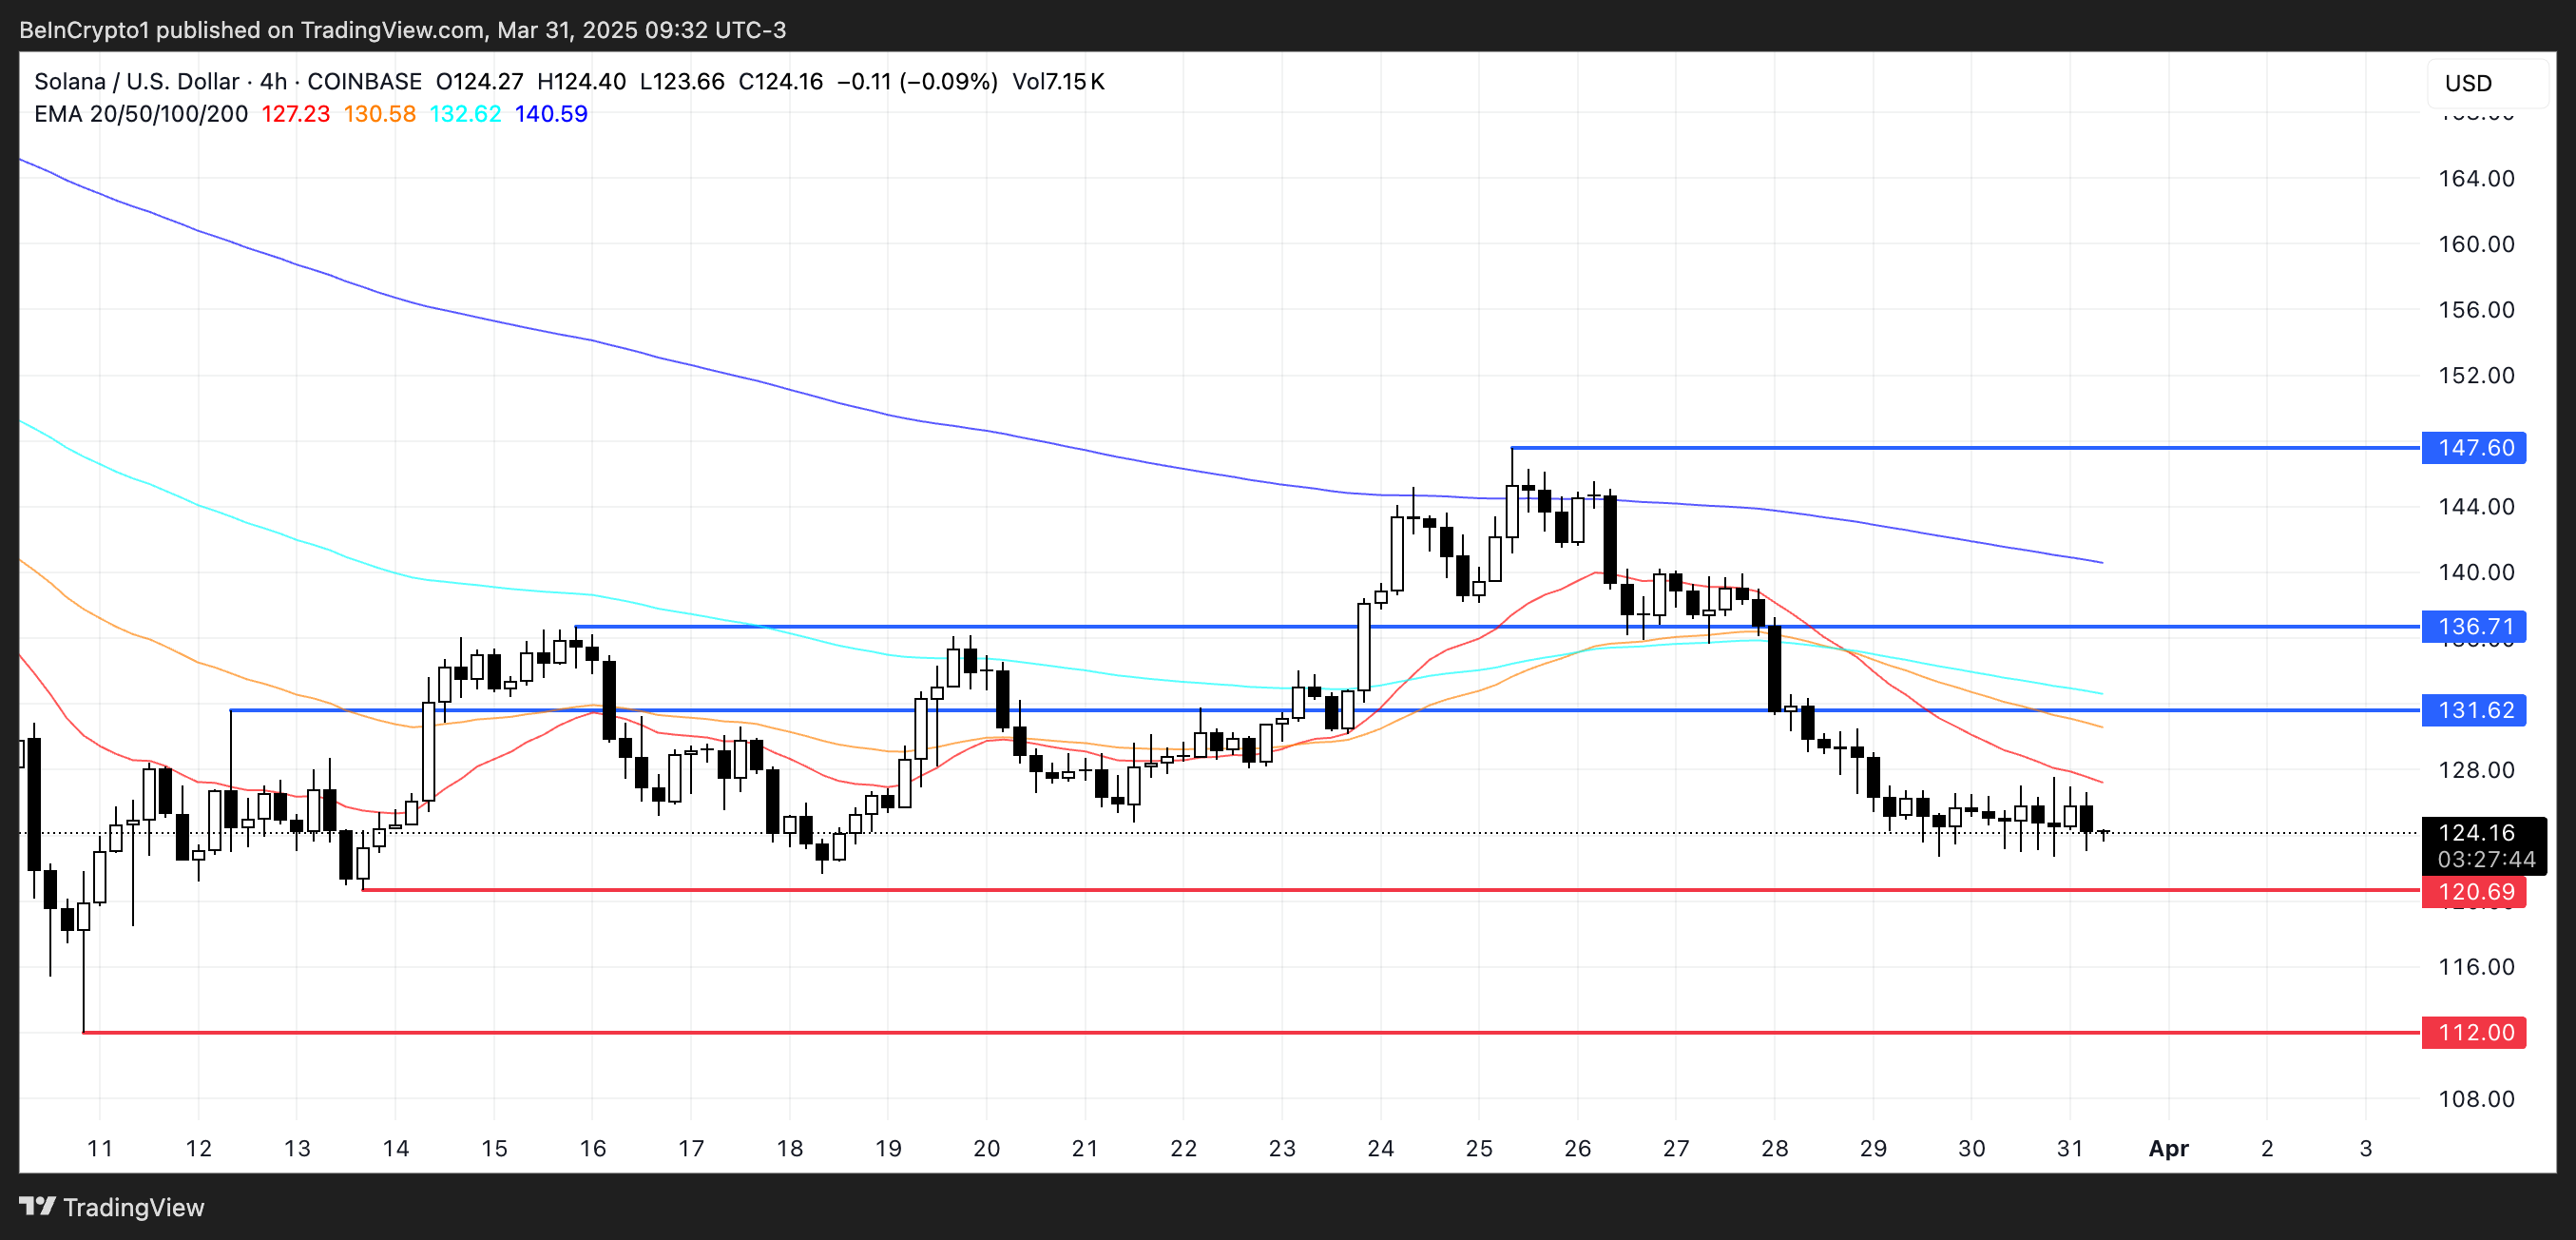
Despite the recent downturn, Solana remains one of the most relevant Made in USA coins and continues to show impressive usage metrics. PumpFun, for example, generated nearly $9 million in revenue over the past 24 hours, second only to Tether.
After a short period when BNB led the DEX volume race, Solana seems to be regaining traction—its decentralized exchange volume has surged by 128% in just seven days, reaching $18 billion and surpassing both Ethereum and BNB.
If this recovery in momentum persists, SOL could target a move toward the $131 resistance level. A successful breakout there could open the door to further gains toward $136 and potentially $147.
RENDER
RENDER, one of the most prominent U.S.-based cryptocurrencies with a focus on artificial intelligence, has seen its price decline nearly 11% over the past seven days.
This drop reflects the broader correction that has impacted many AI-related tokens in recent months.
However, new developments in the AI infrastructure space may provide a catalyst for a potential rebound, especially as the limitations of centralized systems become clear.
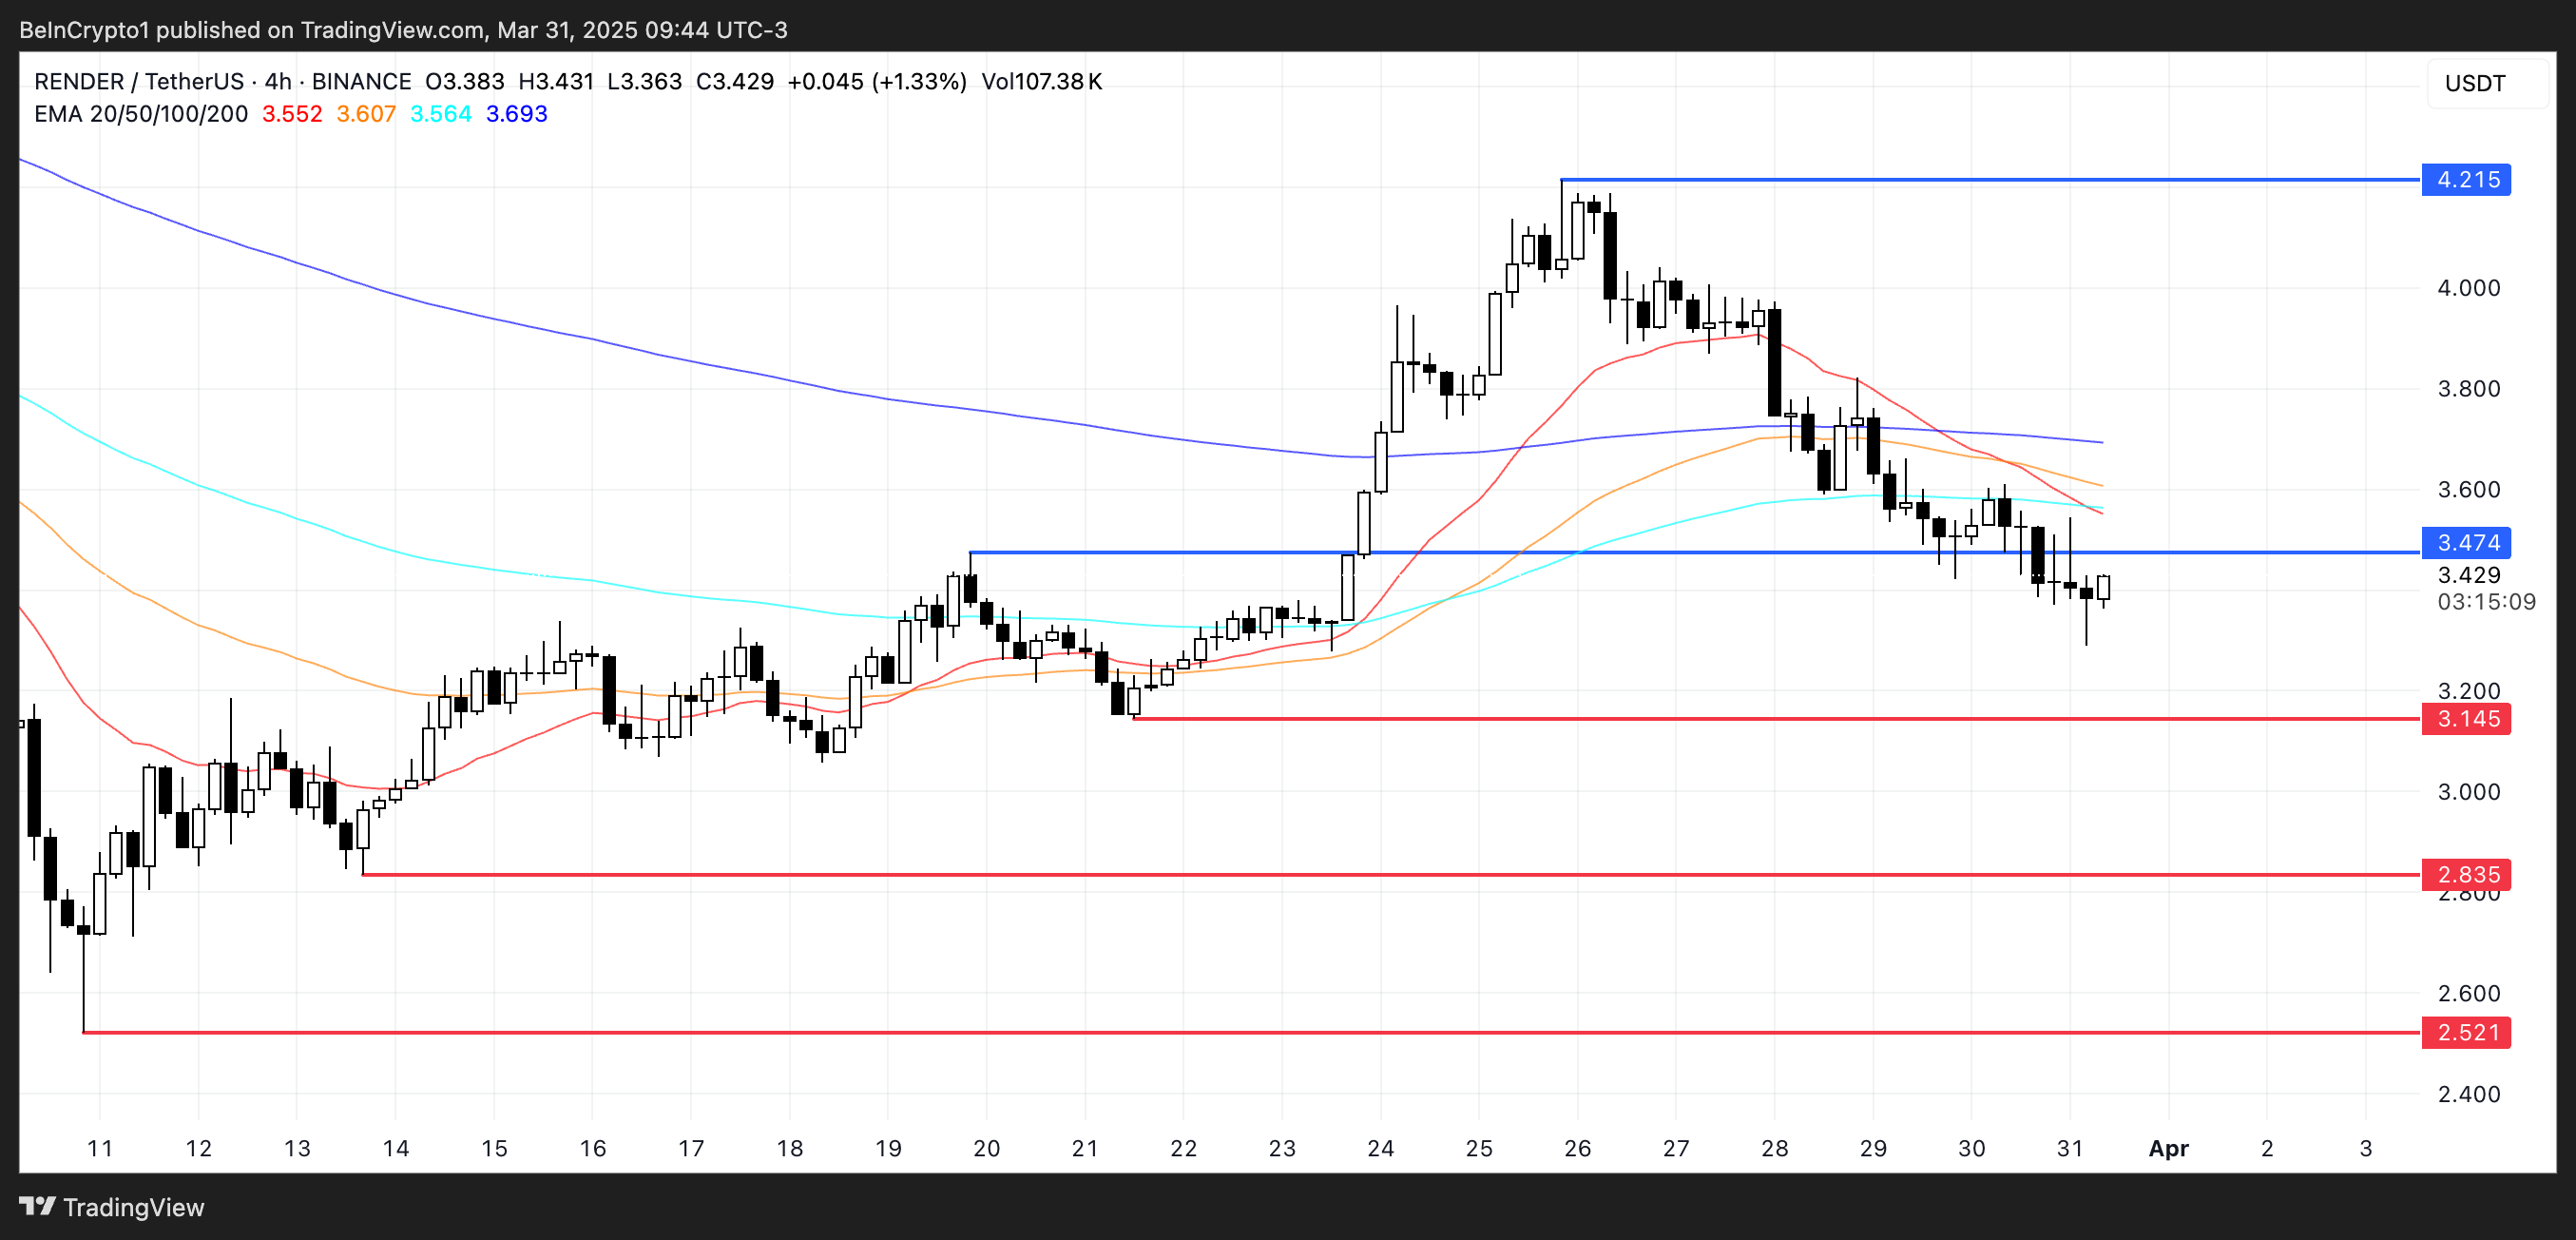
If bullish momentum returns to the AI sector, RENDER could look to challenge the resistance at $3.47, and a successful breakout might open the door for a rally toward $4.21.
However, if the current correction deepens, the token could fall to test the $3.14 support level. A breakdown there may trigger further losses, potentially dragging RENDER down to $2.83 or even $2.52—its lowest level in recent weeks.
Jupiter (JUP)
Despite Solana’s recent struggles, Jupiter—its leading DEX aggregator—is demonstrating impressive strength in terms of activity.
In the last 24 hours, Jupiter ranked as the fourth-highest protocol in crypto by fee generation, collecting nearly $2.5 million.
Only Tether, PumpFun, and Circle managed to outperform it, highlighting the platform’s growing relevance within the Solana ecosystem even during periods of broader market weakness.
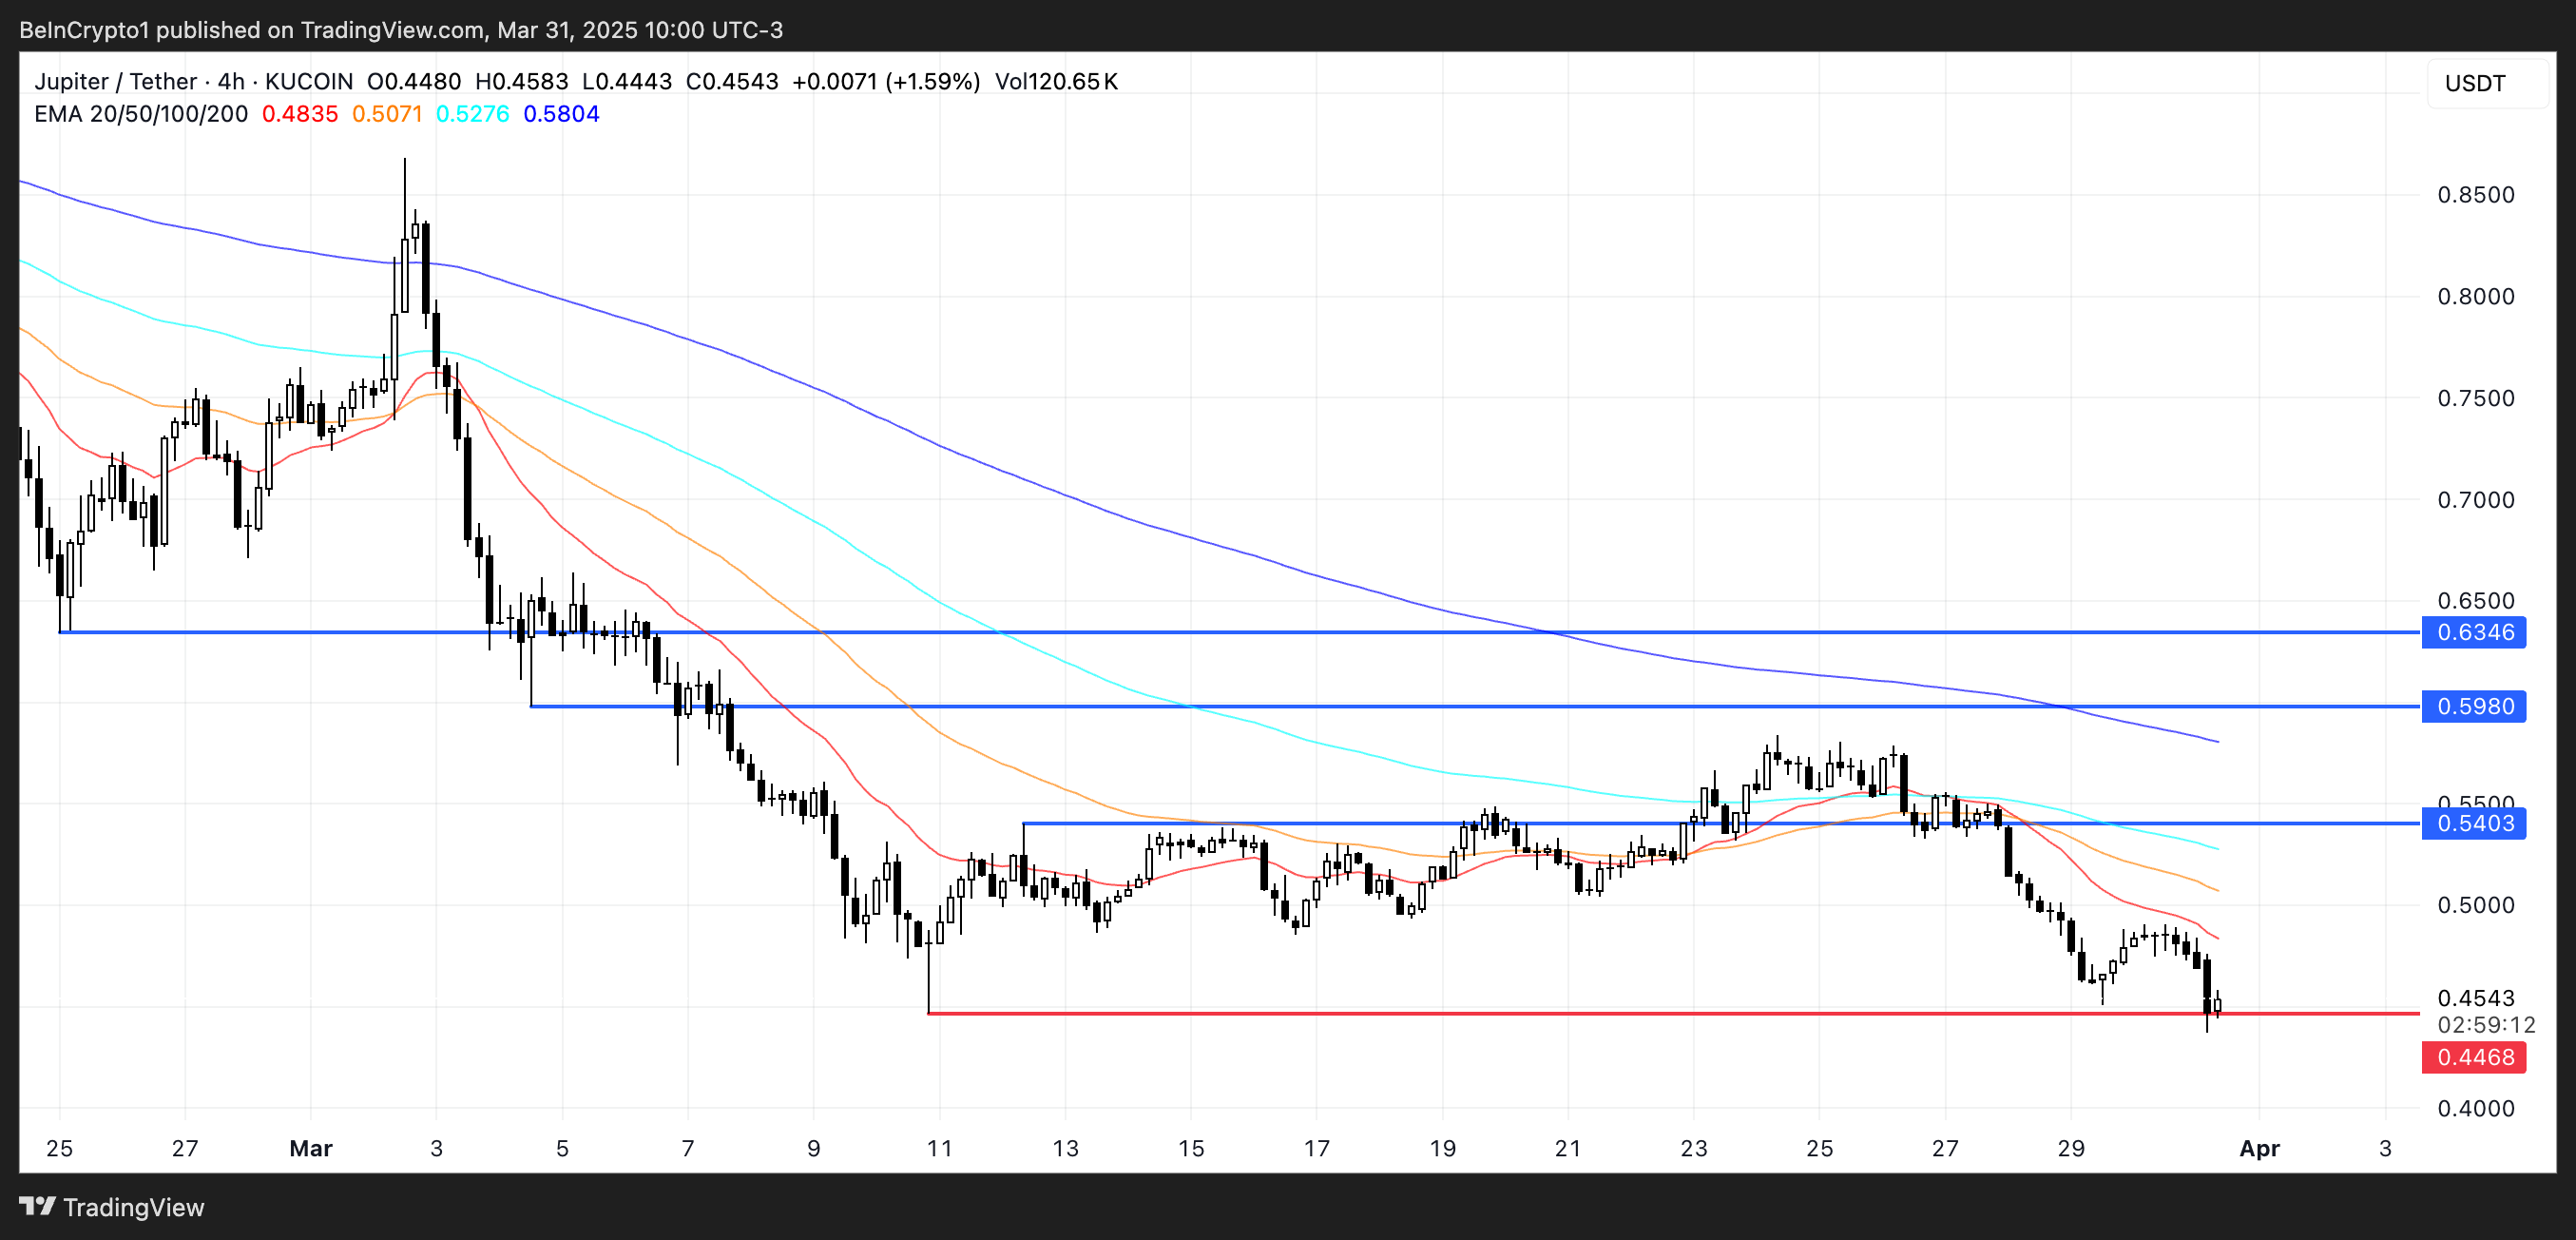
However, JUP, Jupiter’s native token, hasn’t mirrored this positive momentum. Its price has dropped over 21% in the past week, being one of the worst performers among the biggest Made in USA coins. It has remained below the $0.65 mark for three consecutive weeks.
With JUP now hovering dangerously close to a key support at $0.44, a breakdown could see the token dip below $0.40 for the first time ever.
Still, if market sentiment shifts and momentum returns, JUP could begin climbing again—first testing resistance at $0.54, then potentially moving toward $0.598 and even $0.63 if bullish pressure intensifies.
Disclaimer
In line with the Trust Project guidelines, this price analysis article is for informational purposes only and should not be considered financial or investment advice. BeInCrypto is committed to accurate, unbiased reporting, but market conditions are subject to change without notice. Always conduct your own research and consult with a professional before making any financial decisions. Please note that our Terms and Conditions, Privacy Policy, and Disclaimers have been updated.

Cardano (ADA) is facing mounting pressure as its price corrects by 10% over the past seven days, continuing a broader downtrend that has kept it trading below the $1 mark for nearly a month. With technical indicators flashing warning signs and large holders exiting their positions, concerns around ADA’s short-term stability are growing.
The recent rejection at higher resistance levels and a strong directional trend signal suggest that bearish momentum is far from over. As the $0.64 support level is tested once again, ADA’s next move could determine whether a rebound is possible—or if further downside is ahead.
Cardano ADX Shows The Downtrend Is Very Strong
Cardano’s Average Directional Index (ADX) is currently at 40.19, rising sharply from 15.83 just four days ago. This steep increase suggests a rapid strengthening in the trend’s momentum.
Given that ADA is currently in a downtrend, the rising ADX indicates that bearish momentum is intensifying and the current downward move is gaining traction.
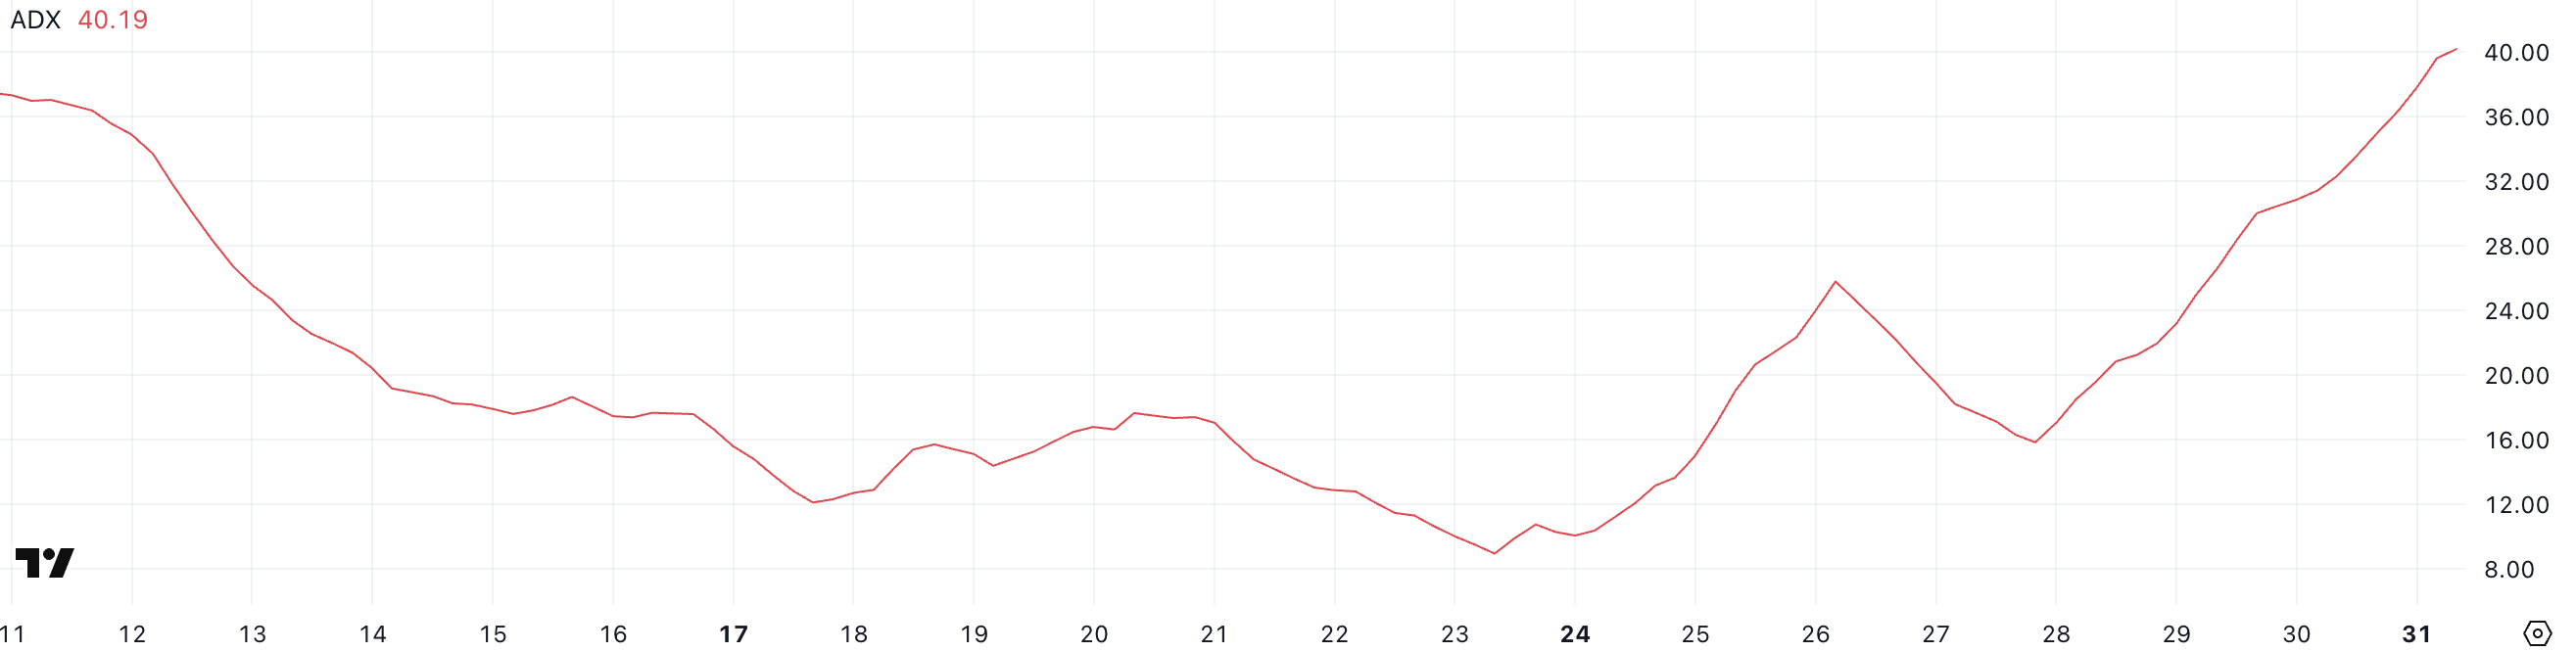
The ADX is a trend strength indicator that measures how strong a trend is, regardless of its direction. It ranges from 0 to 100, with readings below 20 typically indicating a weak or non-existent trend, while values above 25 suggest a strong trend is in place.
Cardano’s ADX climbing above 40 confirms that the current downtrend is active and becoming stronger. If this trend continues, it may point to further downside pressure unless a shift in momentum begins to build from the bulls.
ADA Whales Dropped To Their Lowest Level Since February 2023
The number of Cardano whales—wallets holding between 1 million and 10 million ADA—has dropped to 2,406, down from 2,421 just four days ago.
This decline brings the whale count to its lowest level since February 2023, marking a potentially meaningful shift in large-holder behavior. These movements are worth paying attention to, as changes in whale holdings often precede broader market trends.
Tracking whales is important because these large holders can significantly influence price action through their buying or selling decisions. A decline in whale numbers can signal reduced confidence or capital rotation into other assets.
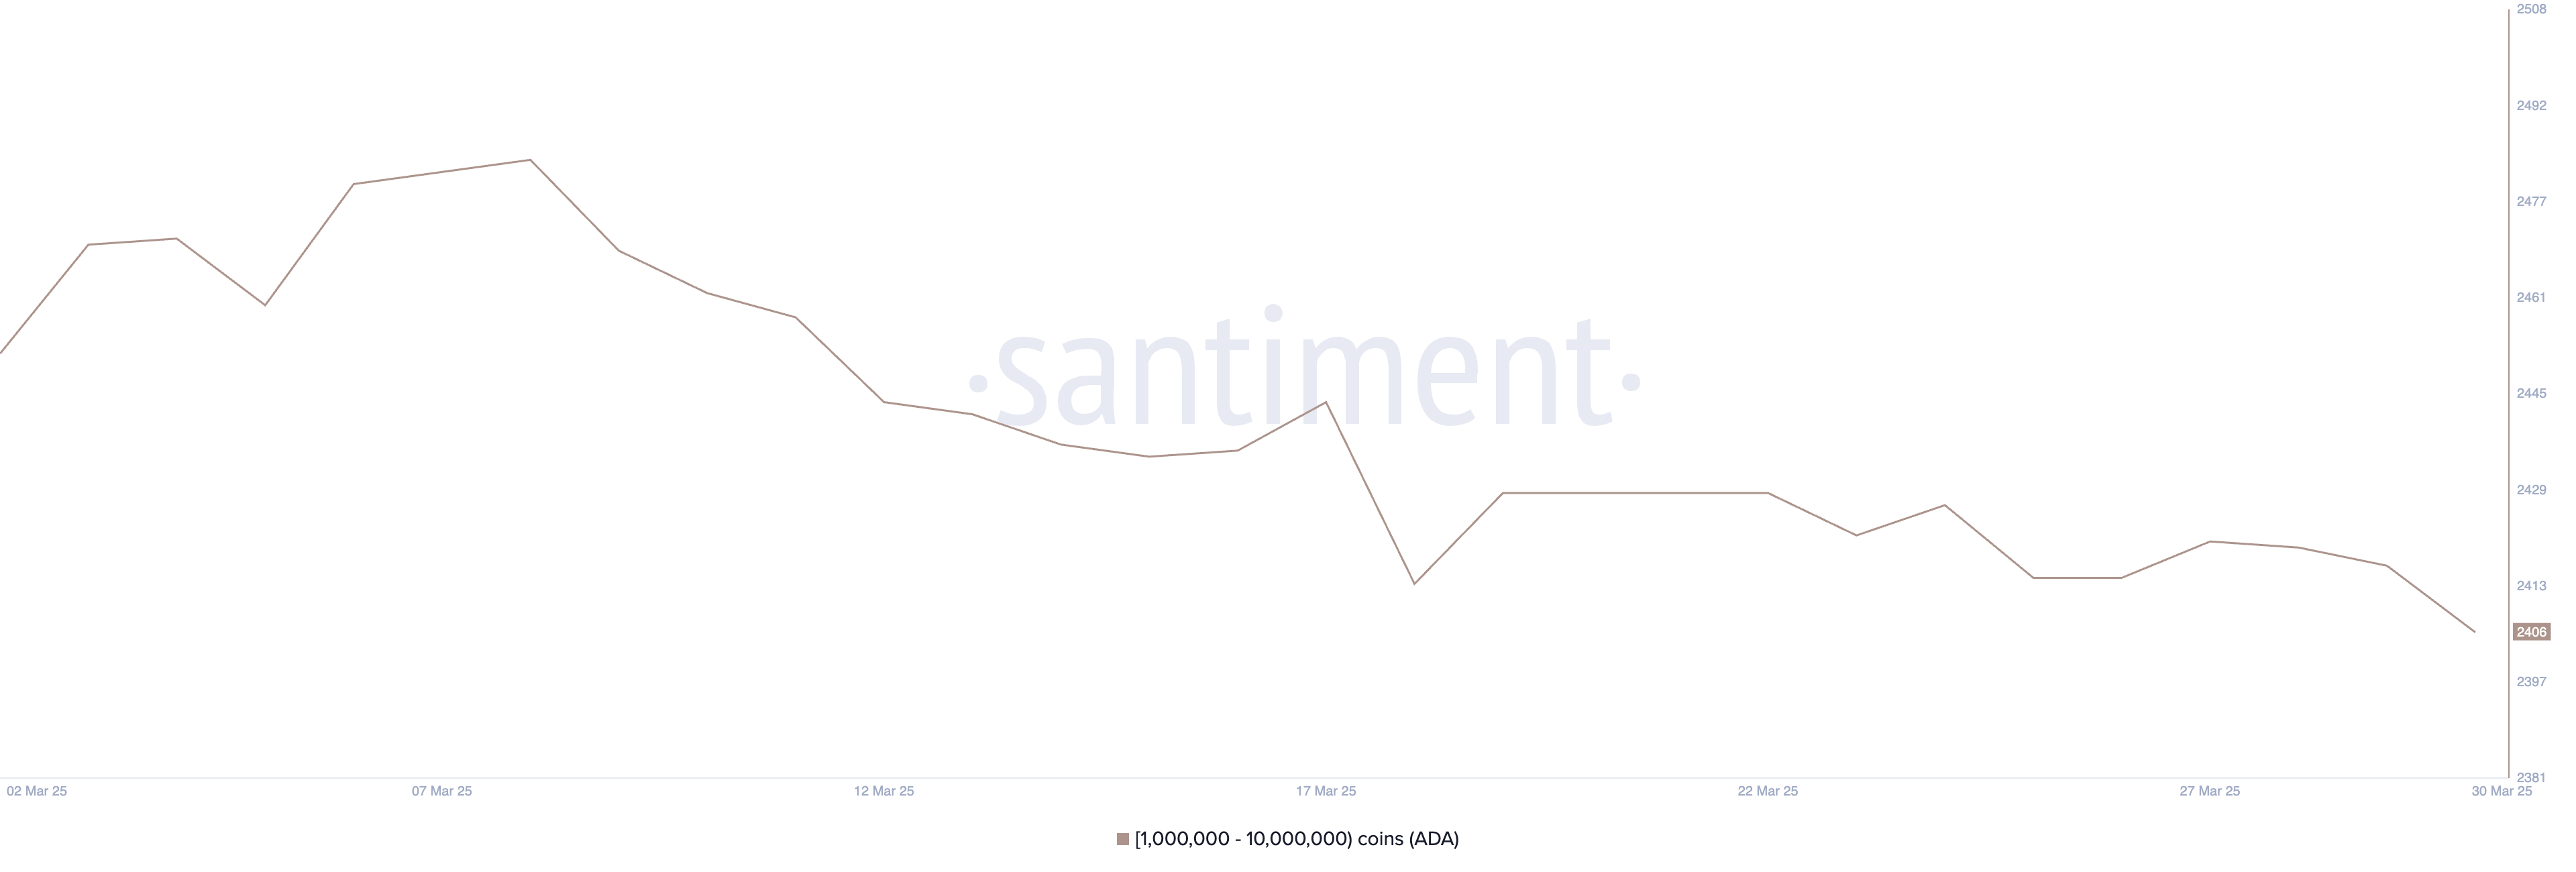
In Cardano’s case, the drop suggests that some major players may be exiting or reducing exposure, which could add downward pressure to ADA’s price.
If this trend continues, it could weaken investor sentiment and make it harder for ADA to recover in the short term.
Can Cardano Sustain The $0.64 Support Again?
Cardano price recently tested the support level at $0.64 and managed to hold, showing that buyers are still defending that zone. This support has become a key line in the sand for ADA’s short-term outlook.
If the current downtrend is reversed and bullish momentum picks up, the next upside target would be the resistance at $0.69. A breakout above that level could open the door for a push toward $0.77.
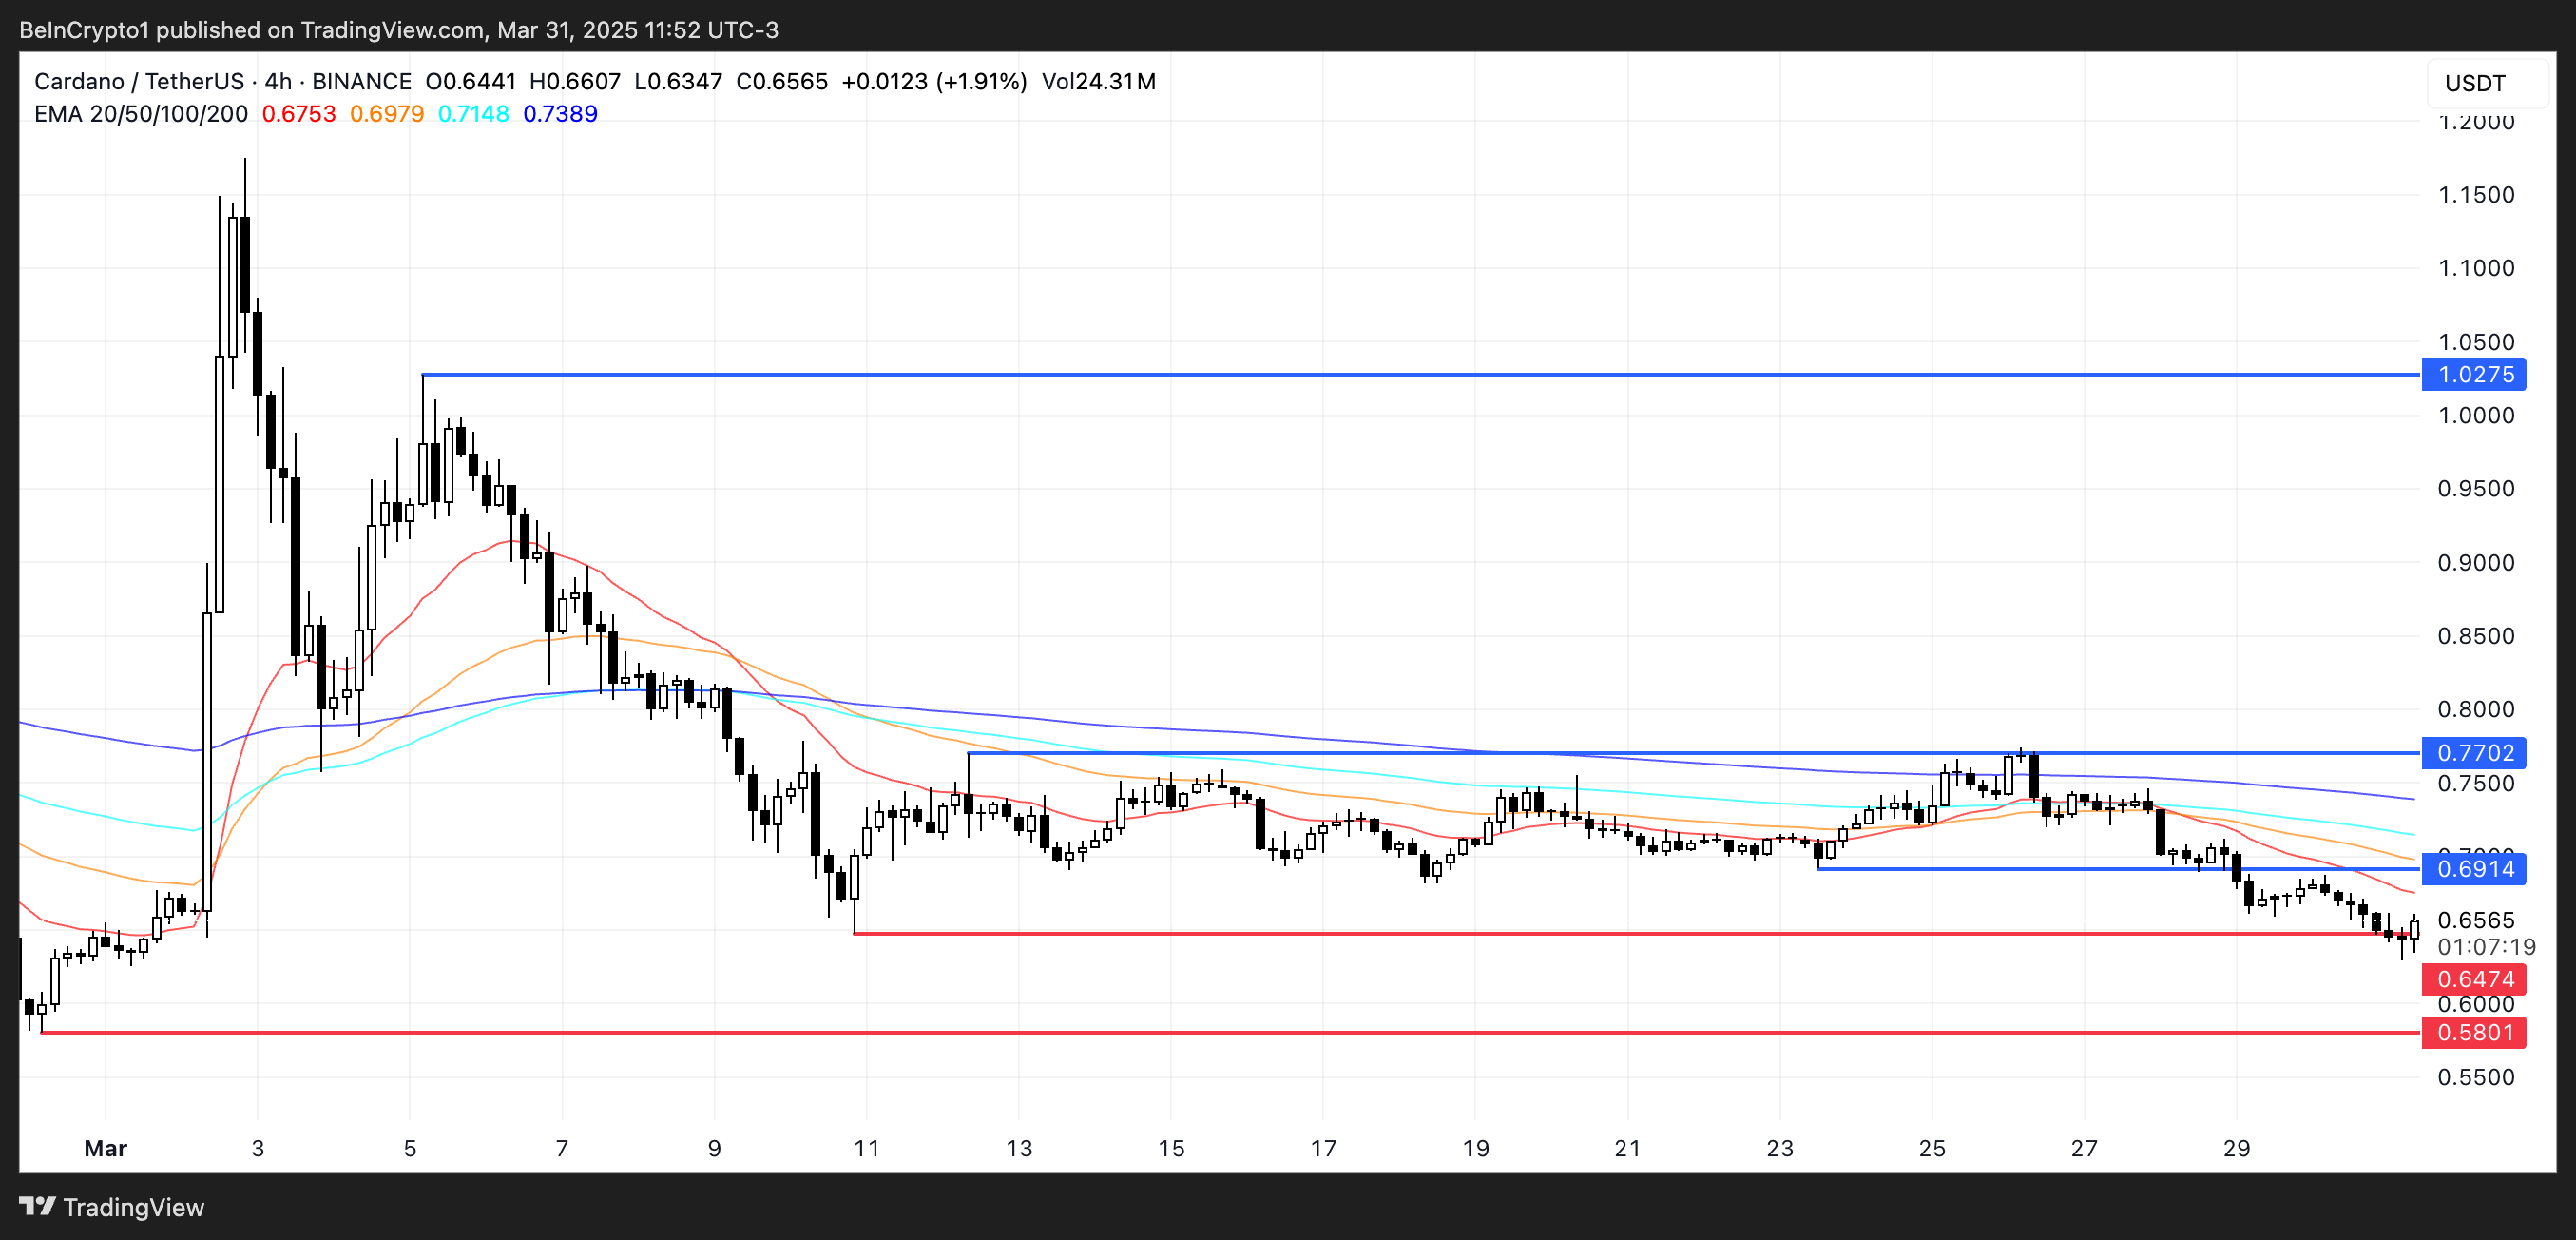
Should the rally continue with strength, ADA could aim for $1.02—marking a return above the $1 level for the first time since early March.
However, the $0.64 support remains a critical level to watch. If Cardano tests it again and fails to hold, it could indicate weakening buyer conviction.
A breakdown below $0.64 would likely send ADA toward the next support at $0.58. This would confirm a continuation of the downtrend and possibly trigger further selling pressure.
Disclaimer
In line with the Trust Project guidelines, this price analysis article is for informational purposes only and should not be considered financial or investment advice. BeInCrypto is committed to accurate, unbiased reporting, but market conditions are subject to change without notice. Always conduct your own research and consult with a professional before making any financial decisions. Please note that our Terms and Conditions, Privacy Policy, and Disclaimers have been updated.

Ethereum Price Faces a Tough Test—Can It Clear the Hurdle?

Top 3 Made in USA Coins to Watch In April

Cardano (ADA) Whales Hit 2-Year Low as Key Support Retested

This is Why PumpSwap Brings Pump.fun To the Next Level

Hedera (HBAR) Bears Dominate, HBAR Eyes Key $0.15 Level

Charles Hoskinson Reveals How Cardano Will Boost Bitcoin’s Adoption

2.52 Million Altcoins Are Ruining Crypto’s Future

Animoca Brands Valuation Tanks 75% In Two Years, Here’s Why

Crypto exchange BingX hacked for $43 million

Are The Big Players Losing Interest?

Hong Kong’s Securities Association Tips Authorities On Crypto Self-Regulation

Coinbase cbBTC Set to go Live on Solana
2.52 Million Altcoins Are Ruining Crypto’s Future
Animoca Brands Valuation Tanks 75% In Two Years, Here’s Why
Crypto exchange BingX hacked for $43 million
Are The Big Players Losing Interest?
Hong Kong’s Securities Association Tips Authorities On Crypto Self-Regulation
Coinbase cbBTC Set to go Live on Solana
-

 Market19 hours ago
Don’t Fall for These Common Crypto Scams
-
 Bitcoin12 hours ago
Strategy Adds 22,048 BTC for Nearly $2 Billion
-
 Market11 hours ago
Trump Family Gets Most WLFI Revenue, Causing Corruption Fears
-
 Altcoin16 hours ago
$33 Million Inflows Signal Market Bounce
-
 Market21 hours ago
Bitcoin Price Nears $80,000; Fuels Death Cross Potential
-

 Market14 hours ago
Bitcoin Mining Faces Tariff Challenges as Hashrate Hits New ATH
-
 Regulation14 hours ago
USDC Issuer Circle Set To File IPO In April, Here’s All
-

 Bitcoin19 hours ago
US Macroeconomic Indicators This Week: NFP, JOLTS, & More