
Market
Will Aptos Price Reclaim Six-Month High?

Aptos’s APT coin has experienced a resurgence in buying activity following Franklin Templeton’s announcement of the expansion of its tokenized US Treasuries fund — the Franklin OnChain US Government Money Fund (FOBXX) — on the Layer-1 (L1) blockchain.
With a surging bullish bias toward the altcoin, it is poised to revisit its six-month high. This analysis explores how soon this may occur.
Aptos Joins the FOBXX fund, APT Gains
On Wednesday, Franklin Templeton, a leading investment manager with over $1.4 trillion in assets, announced the launch of its FOBXX on the Aptos blockchain. This news drove APT to an intraday day high of $8.33. While the Aptos’ price has since shed some of these gains, it still notes a 1% hike over the past 24 hours. As of this writing, APT is trading at $7.96.
Furthermore, APT’s open interest has surged by 16% within the same period. This measures the total number of the coin’s outstanding futures or options contracts that have not been settled or closed.
Read more: Where To Buy Aptos (APT): 5 Best Platforms for 2024
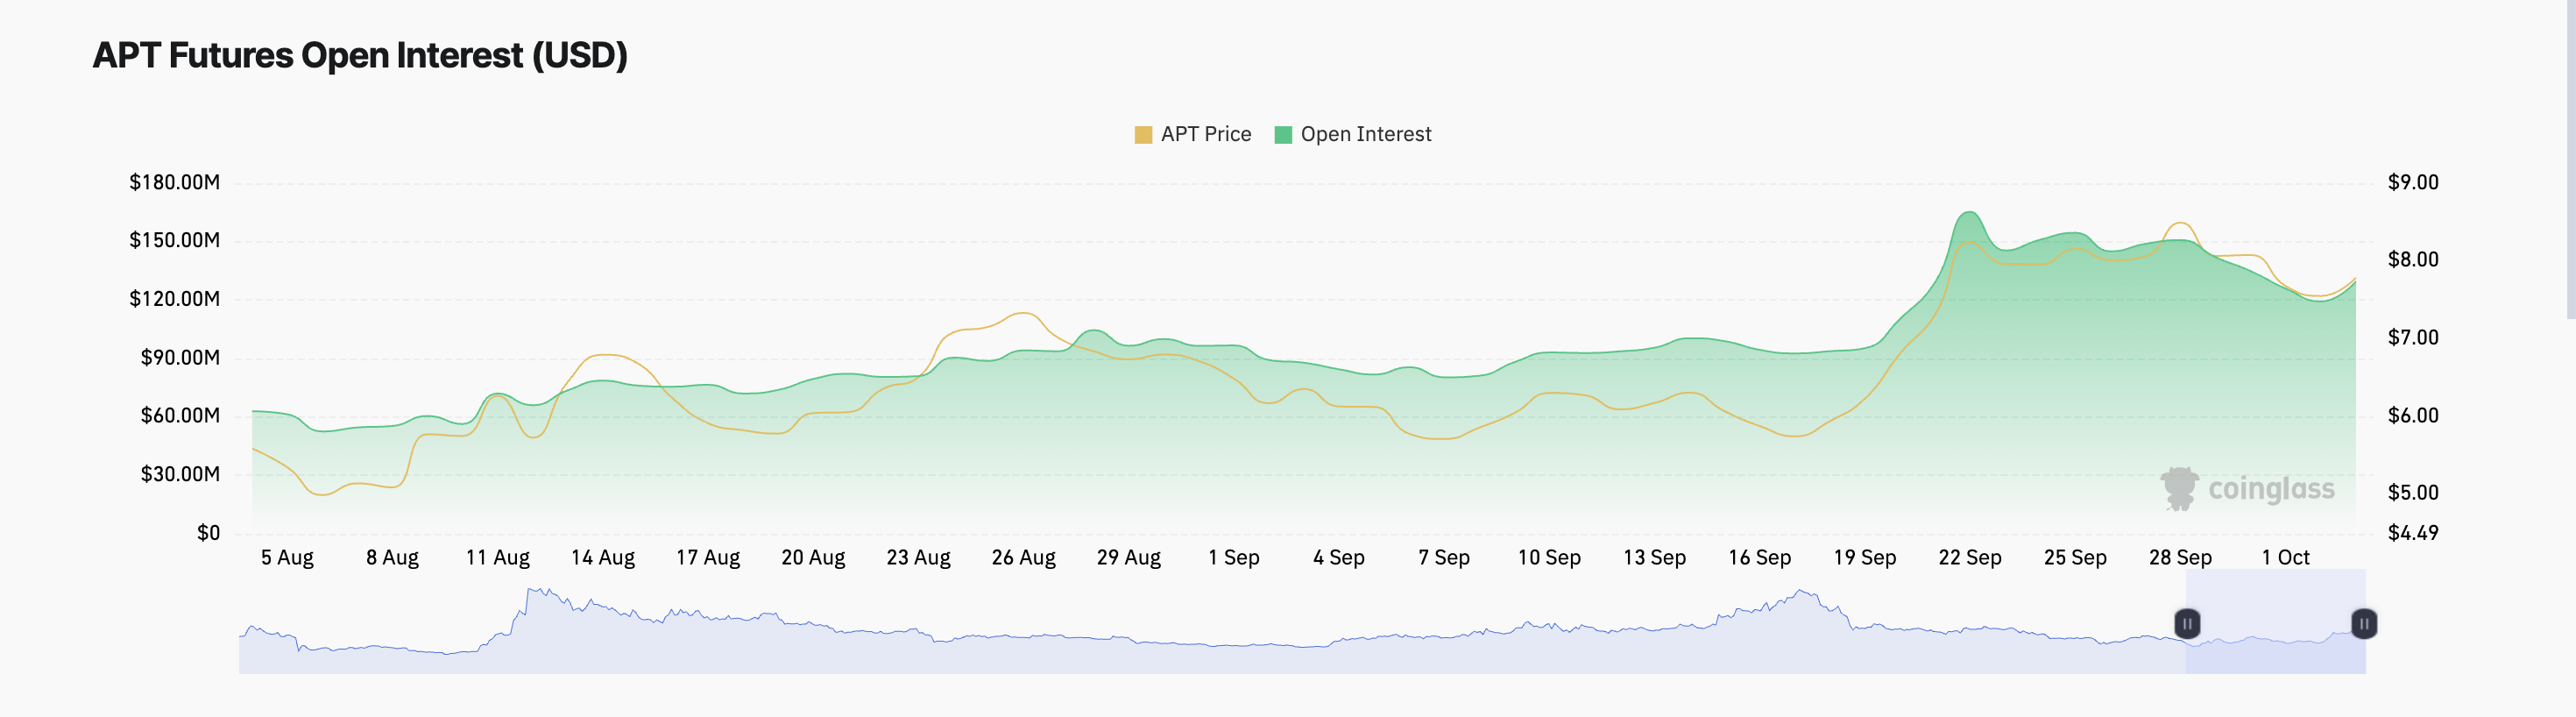
The combination of rising prices and increasing open interest often reflects bullish sentiment among traders. The willingness to add new positions indicates they expect the price movement to be sustained.
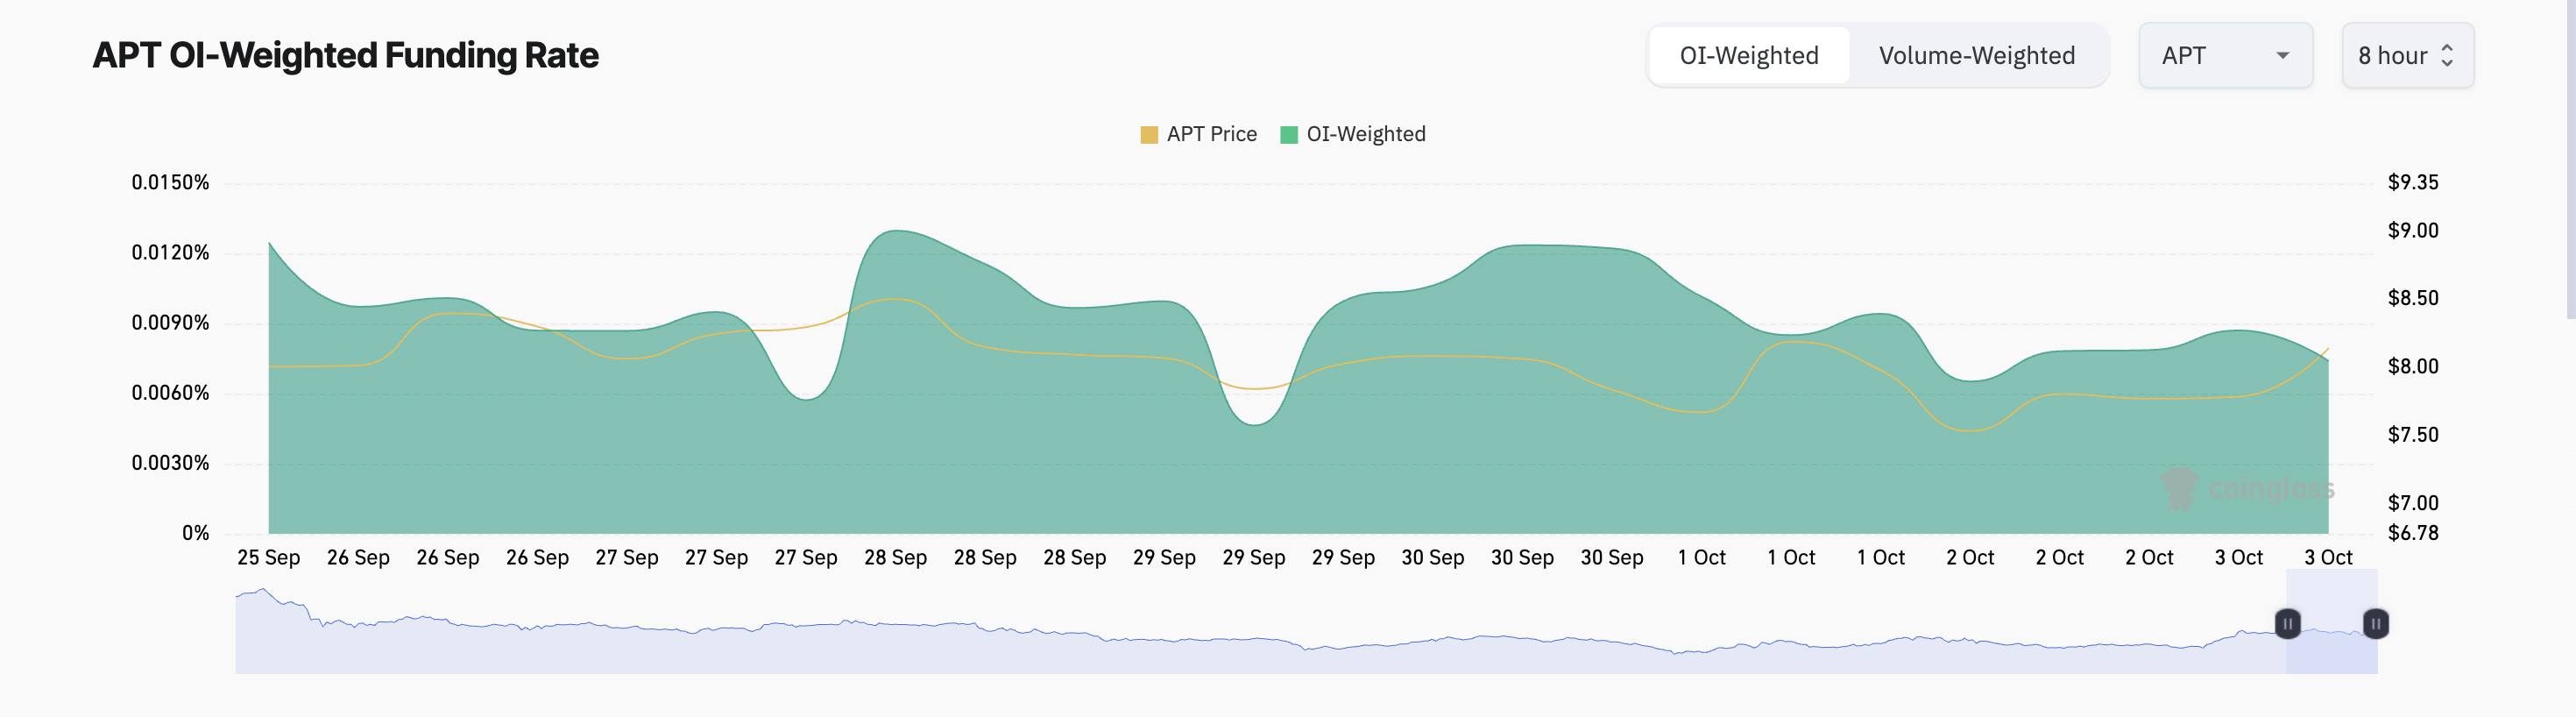
APT’s positive funding rate of 0.0074% supports this bullish outlook. A positive funding rate signifies bullish sentiment among traders. It suggests that more participants are confident in the price rise, leading them to take long positions. This can create upward pressure on the price of the underlying asset.
APT Price Prediction: Price May Break Above Crucial Resistance Level
APT’s rising Relative Strength Index (RSI) reflects the surge in demand for the altcoin. At press time, the indicator stands at 61.51.
The RSI measures an asset’s overbought and oversold market conditions. It ranges between 0 and 100, with values above 70 suggesting that the asset is overbought and due for a correction. Conversely, values below 30 indicate that the asset is oversold and may witness a correction.
At 62.99, APT’s RSI suggests that buying momentum is high and outweighs profit-taking activity. According to the coin’s Fibonacci Retracement tool, if this trend continues, APT’s next target is $10.11, a high it last reached in April. If it breaches this crucial resistance level, it may chart its course toward $19.48.
Read more: Aptos (APT) Price Prediction 2024/2025/2030
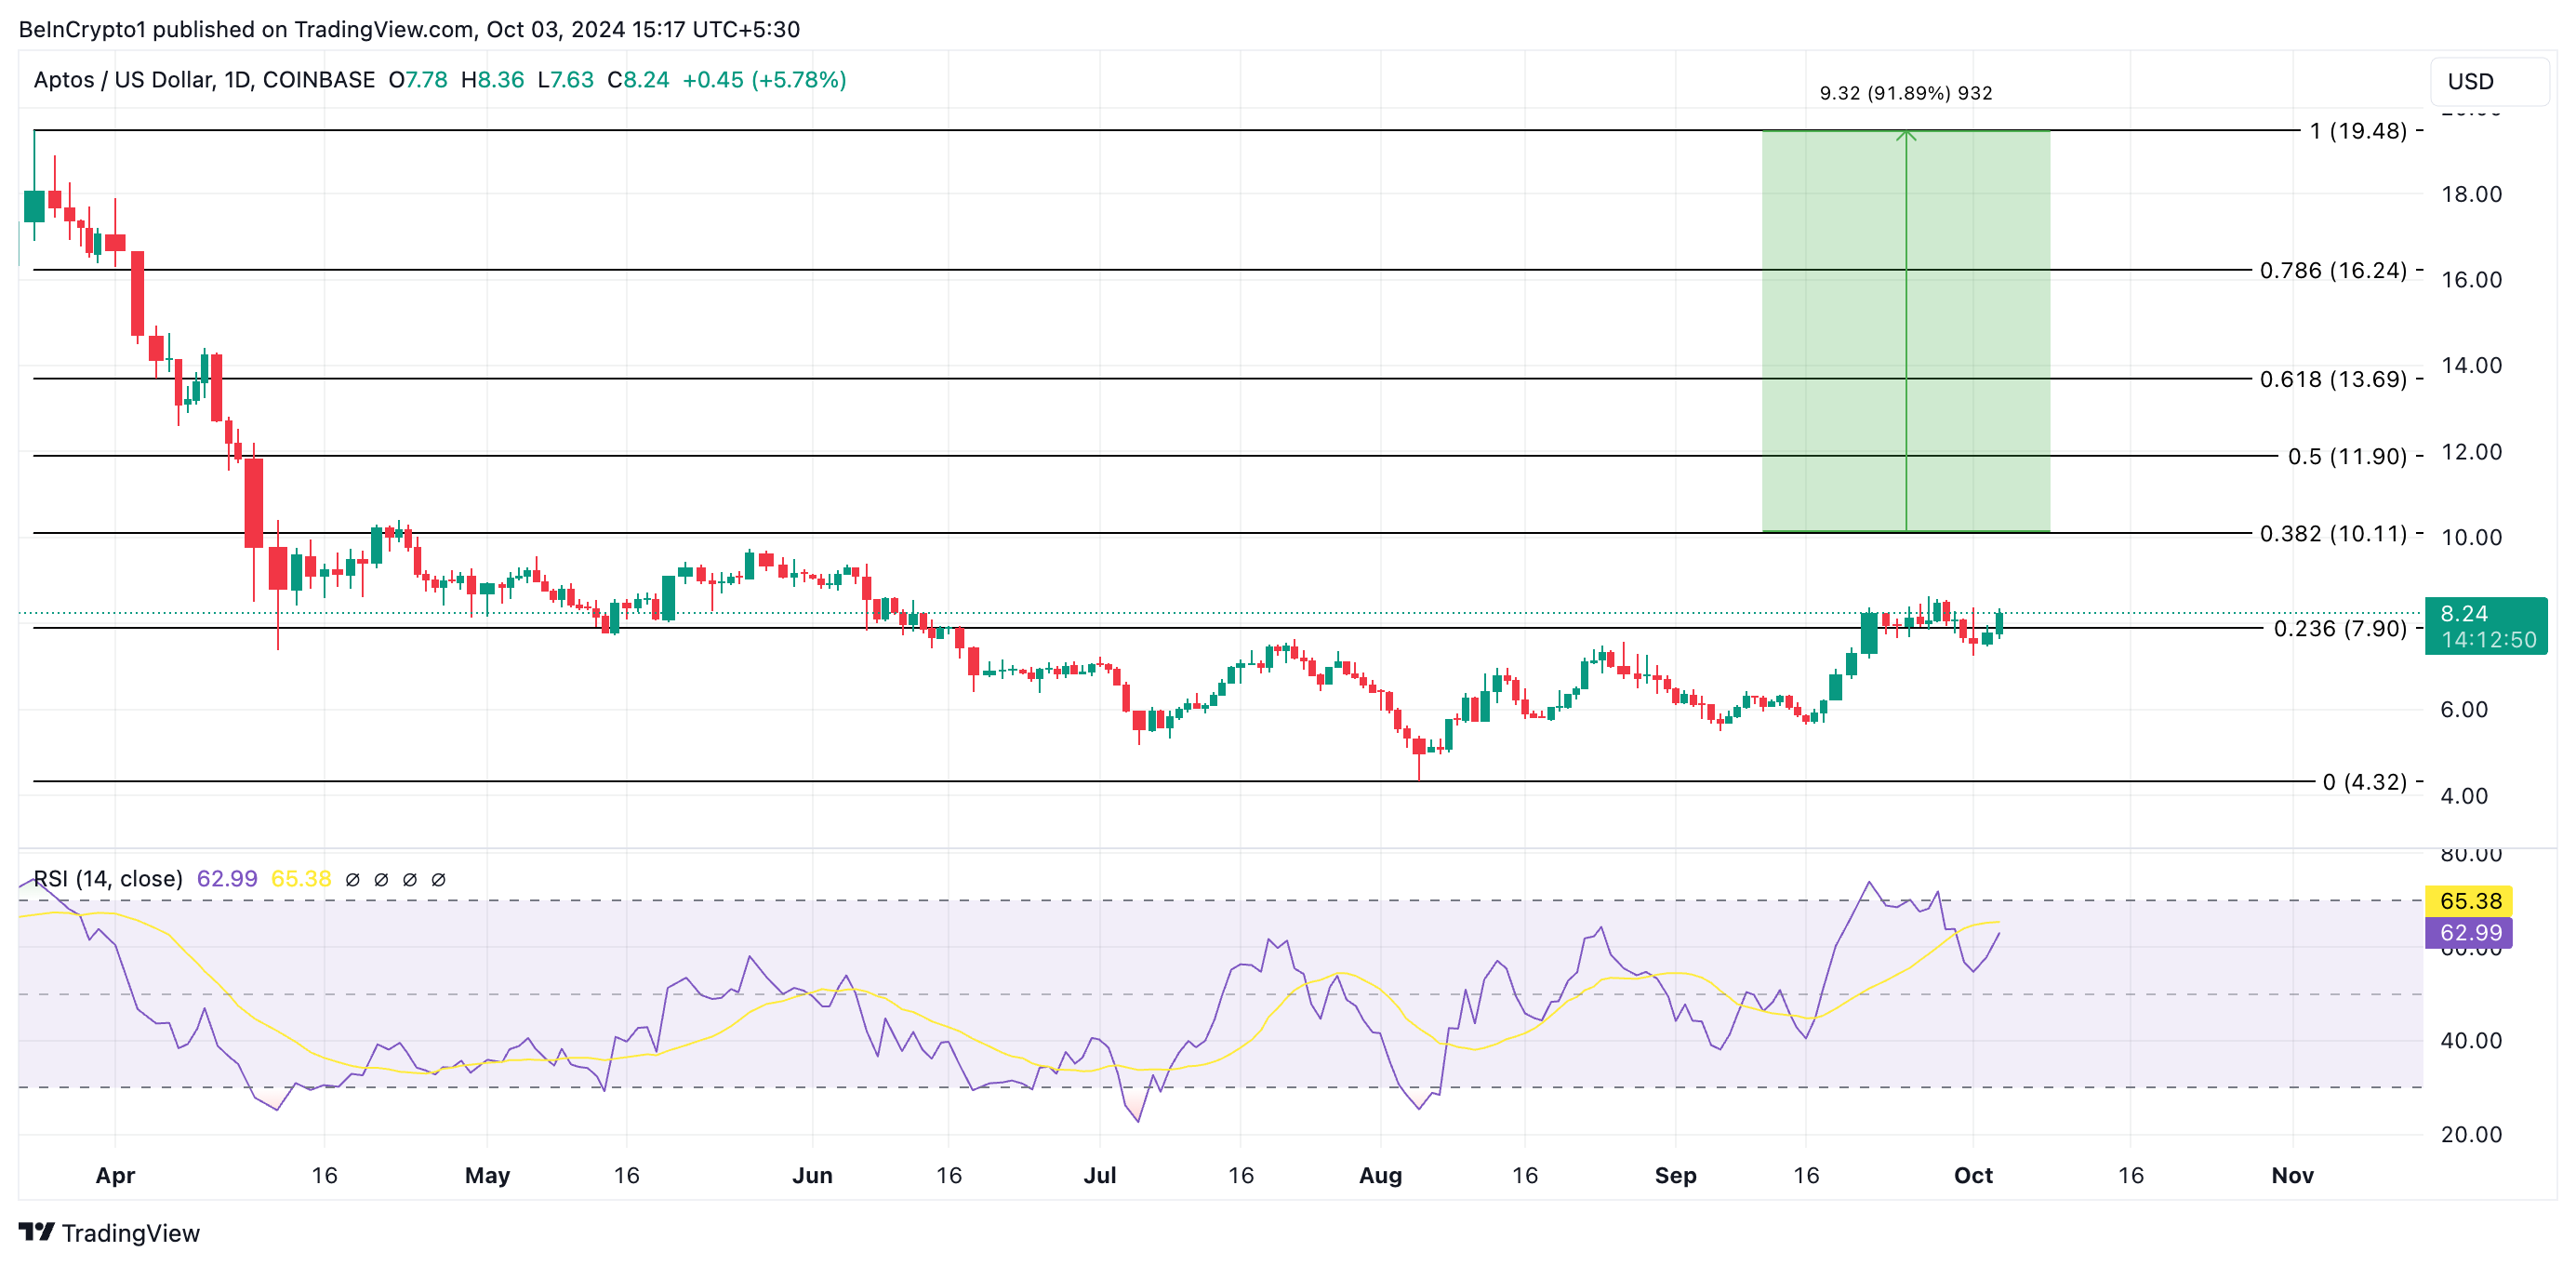
However, if the uptick in Aptos’ price prompts holders to begin profit-taking, the coin may lose some of its gains and drop toward its August 5 low of $4.32.
Disclaimer
In line with the Trust Project guidelines, this price analysis article is for informational purposes only and should not be considered financial or investment advice. BeInCrypto is committed to accurate, unbiased reporting, but market conditions are subject to change without notice. Always conduct your own research and consult with a professional before making any financial decisions. Please note that our Terms and Conditions, Privacy Policy, and Disclaimers have been updated.


Cardano price started a recovery wave above the $0.680 zone but failed. ADA is consolidating near $0.650 and remains at risk of more losses.
- ADA price failed to recover above the $0.70 resistance zone.
- The price is trading below $0.680 and the 100-hourly simple moving average.
- There was a break below a connecting bullish trend line with support at $0.6720 on the hourly chart of the ADA/USD pair (data source from Kraken).
- The pair could start another increase if it clears the $0.70 resistance zone.
Cardano Price Dips Again
In the past few days, Cardano saw a recovery wave from the $0.6350 zone, like Bitcoin and Ethereum. ADA was able to climb above the $0.680 and $0.6880 resistance levels.
However, the bears were active above the $0.70 zone. A high was formed at $0.7090 and the price corrected most gains. There was a move below the $0.650 level. Besides, there was a break below a connecting bullish trend line with support at $0.6720 on the hourly chart of the ADA/USD pair.
A low was formed at $0.6356 and the price is now consolidating losses near the 23.6% Fib retracement level of the recent decline from the $0.7090 swing high to the $0.6356 low. Cardano price is now trading below $0.680 and the 100-hourly simple moving average.
On the upside, the price might face resistance near the $0.6720 zone or the 50% Fib retracement level of the recent decline from the $0.7090 swing high to the $0.6356 low. The first resistance is near $0.6950. The next key resistance might be $0.700.

If there is a close above the $0.70 resistance, the price could start a strong rally. In the stated case, the price could rise toward the $0.7420 region. Any more gains might call for a move toward $0.7650 in the near term.
Another Drop in ADA?
If Cardano’s price fails to climb above the $0.6720 resistance level, it could start another decline. Immediate support on the downside is near the $0.6420 level.
The next major support is near the $0.6350 level. A downside break below the $0.6350 level could open the doors for a test of $0.620. The next major support is near the $0.60 level where the bulls might emerge.
Technical Indicators
Hourly MACD – The MACD for ADA/USD is losing momentum in the bearish zone.
Hourly RSI (Relative Strength Index) – The RSI for ADA/USD is now below the 50 level.
Major Support Levels – $0.6420 and $0.6350.
Major Resistance Levels – $0.6720 and $0.7000.
Aayush Jindal, a luminary in the world of financial markets, whose expertise spans over 15 illustrious years in the realms of Forex and cryptocurrency trading. Renowned for his unparalleled proficiency in providing technical analysis, Aayush is a trusted advisor and senior market expert to investors worldwide, guiding them through the intricate landscapes of modern finance with his keen insights and astute chart analysis.
From a young age, Aayush exhibited a natural aptitude for deciphering complex systems and unraveling patterns. Fueled by an insatiable curiosity for understanding market dynamics, he embarked on a journey that would lead him to become one of the foremost authorities in the fields of Forex and crypto trading. With a meticulous eye for detail and an unwavering commitment to excellence, Aayush honed his craft over the years, mastering the art of technical analysis and chart interpretation.
As a software engineer, Aayush harnesses the power of technology to optimize trading strategies and develop innovative solutions for navigating the volatile waters of financial markets. His background in software engineering has equipped him with a unique skill set, enabling him to leverage cutting-edge tools and algorithms to gain a competitive edge in an ever-evolving landscape.
In addition to his roles in finance and technology, Aayush serves as the director of a prestigious IT company, where he spearheads initiatives aimed at driving digital innovation and transformation. Under his visionary leadership, the company has flourished, cementing its position as a leader in the tech industry and paving the way for groundbreaking advancements in software development and IT solutions.
Despite his demanding professional commitments, Aayush is a firm believer in the importance of work-life balance. An avid traveler and adventurer, he finds solace in exploring new destinations, immersing himself in different cultures, and forging lasting memories along the way. Whether he’s trekking through the Himalayas, diving in the azure waters of the Maldives, or experiencing the vibrant energy of bustling metropolises, Aayush embraces every opportunity to broaden his horizons and create unforgettable experiences.
Aayush’s journey to success is marked by a relentless pursuit of excellence and a steadfast commitment to continuous learning and growth. His academic achievements are a testament to his dedication and passion for excellence, having completed his software engineering with honors and excelling in every department.
At his core, Aayush is driven by a profound passion for analyzing markets and uncovering profitable opportunities amidst volatility. Whether he’s poring over price charts, identifying key support and resistance levels, or providing insightful analysis to his clients and followers, Aayush’s unwavering dedication to his craft sets him apart as a true industry leader and a beacon of inspiration to aspiring traders around the globe.
In a world where uncertainty reigns supreme, Aayush Jindal stands as a guiding light, illuminating the path to financial success with his unparalleled expertise, unwavering integrity, and boundless enthusiasm for the markets.
Reason to trust
![]()
Strict editorial policy that focuses on accuracy, relevance, and impartiality
Created by industry experts and meticulously reviewed
The highest standards in reporting and publishing
Strict editorial policy that focuses on accuracy, relevance, and impartiality
Morbi pretium leo et nisl aliquam mollis. Quisque arcu lorem, ultricies quis pellentesque nec, ullamcorper eu odio.
Bitcoin price started a recovery wave above the $85,500 zone. BTC is trimming all gains and might decline again toward the $80,000 zone.
- Bitcoin started a decent recovery wave above the $84,500 zone.
- The price is trading near $83,500 and the 100 hourly Simple moving average.
- There was a break below a connecting bullish trend line with support at $85,000 on the hourly chart of the BTC/USD pair (data feed from Kraken).
- The pair could start another increase if it stays above the $82,200 zone.
Bitcoin Price Dips Sharply
Bitcoin price managed to stay above the $82,500 support zone. BTC formed a base and recently started a decent recovery wave above the $83,500 resistance zone.
The bulls were able to push the price above the $84,500 and $85,500 resistance levels. The price even climbed above the $88,000 resistance. A high was formed at $89,042 and the price started a sharp decline. There was a drop below the $86,000 and $85,000 levels.
There was a break below a connecting bullish trend line with support at $85,000 on the hourly chart of the BTC/USD pair. A low was formed at $82,141 and the price is now consolidating near the 23.6% Fib retracement level of the recent decline from the $89,042 swing high to the $82,141 low.
Bitcoin price is now trading near $83,500 and the 100 hourly Simple moving average. On the upside, immediate resistance is near the $84,000 level. The first key resistance is near the $85,000 level.

The next key resistance could be $85,550 and the 50% Fib retracement level of the recent decline from the $89,042 swing high to the $82,141 low. A close above the $85,550 resistance might send the price further higher. In the stated case, the price could rise and test the $86,800 resistance level. Any more gains might send the price toward the $88,000 level or even $88,500.
More Losses In BTC?
If Bitcoin fails to rise above the $85,000 resistance zone, it could start a fresh decline. Immediate support on the downside is near the $82,800 level. The first major support is near the $82,200 level.
The next support is now near the $81,350 zone. Any more losses might send the price toward the $80,500 support in the near term. The main support sits at $80,000.
Technical indicators:
Hourly MACD – The MACD is now losing pace in the bearish zone.
Hourly RSI (Relative Strength Index) – The RSI for BTC/USD is now below the 50 level.
Major Support Levels – $82,800, followed by $82,200.
Major Resistance Levels – $84,200 and $85,500.

Cardano (ADA) Downtrend Deepens—Is a Rebound Possible?

Analyst Forecasts 250% Dogecoin Price Rally If This Level Holds

XRP Price Under Pressure—New Lows Signal More Trouble Ahead

Bitcoin Price Swings Wildly—Yet Bears Keep the Upper Hand!

Binance Sidelines Pi Network Again In Vote To List Initiative, Here’s All

XRP Price Reversal Toward $3.5 In The Works With Short And Long-Term Targets Revealed

2.52 Million Altcoins Are Ruining Crypto’s Future

Animoca Brands Valuation Tanks 75% In Two Years, Here’s Why

Crypto exchange BingX hacked for $43 million

Are The Big Players Losing Interest?

Hong Kong’s Securities Association Tips Authorities On Crypto Self-Regulation

Coinbase cbBTC Set to go Live on Solana
2.52 Million Altcoins Are Ruining Crypto’s Future
Animoca Brands Valuation Tanks 75% In Two Years, Here’s Why
Crypto exchange BingX hacked for $43 million
Are The Big Players Losing Interest?
Hong Kong’s Securities Association Tips Authorities On Crypto Self-Regulation
Coinbase cbBTC Set to go Live on Solana
-
 Altcoin24 hours ago
Pi Network Faces Community Backlash, Is Pi Coin Price Heading to Zero?
-

 Market22 hours ago
BNB Price Faces More Downside—Can Bulls Step In?
-

 Regulation16 hours ago
Kraken Obtains Restricted Dealer Registration in Canada
-

 Market24 hours ago
XRP Recovery Stalls—Are Bears Still In Control?
-

 Market23 hours ago
VanEck Sets Stage for BNB ETF with Official Trust Filing
-

 Bitcoin22 hours ago
Tokenized Gold Market Cap Tops $1.2 Billion as Gold Prices Surge
-

 Bitcoin18 hours ago
Lummis Confirms Treasury Probes Direct Buys
-

 Bitcoin24 hours ago
Institutional Risk Aversion Drives $218 Million Bitcoin ETF Outflows