
Market
Why Is the Market Up Today?
The total crypto market cap (TOTAL) and Bitcoin’s (BTC) price are currently subdued owing to bearish macro conditions. The recent approval of spot Ethereum filings and the crypto regulatory framework bill FIT21 have had no bullish impact on the market yet.
Nevertheless, a small-cap token, JasmyCoin (JASMY), did impress investors with a 31% rise in 24 hours.
In the news today:-
- Justin Sun publicly advocates for a US presidential candidate who endorses cryptocurrencies. He tweeted that it’s imperative to demonstrate to the candidate that the cryptocurrency community and companies’ voices should be heard and interests protected.
- Former US President and candidate Donald Trump vows to release the founder of the website Silkroad, Ross Ulbricht. Trump noted that Ulbricht would be pardoned on the first day if re-elected.
The Total Market Cap Rise Is on Pause
The total crypto market cap is currently at $2.5 trillion, hovering around this level for almost a week. TOTAL managed to breach this barrier but fell soon after below the level. Amid the bearish macro market conditions, the rise expected to take the total market cap beyond $2.61 trillion has become a sideways movement.
This will continue in the coming days until the market witnesses a resurgence in optimism.
Read More: 9 Best Altcoin Exchanges In 2024
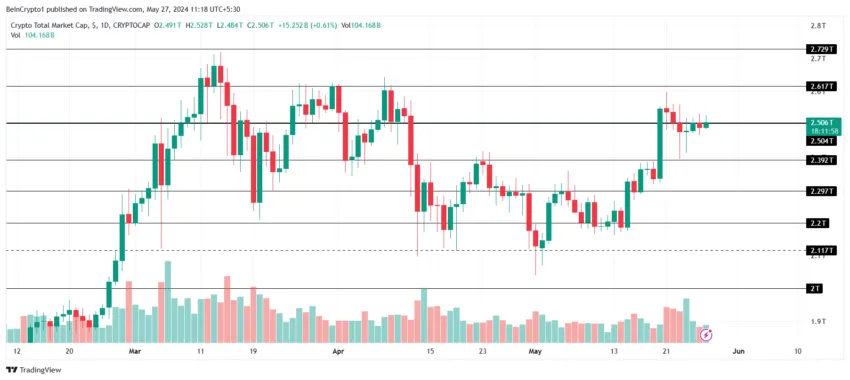
But if bearish cues dominate the market, a drop to $2.40 trillion cannot be ruled out. This could also wipe out a chunk of inventors’ gains.
Bitcoin’s Price Holds at Crucial Support
Bitcoin’s price is trading at $68,571 at the time of writing after failing to breach the resistance at $71,800. Holding the support at $70,000 or bouncing off it would have enabled BTC to continue rising, but this did not transpire either.
As a result, the crypto asset is currently holding above the $68,500 support floor that BTC has tested multiple times.
Read More: Bitcoin Halving History: Everything You Need To Know
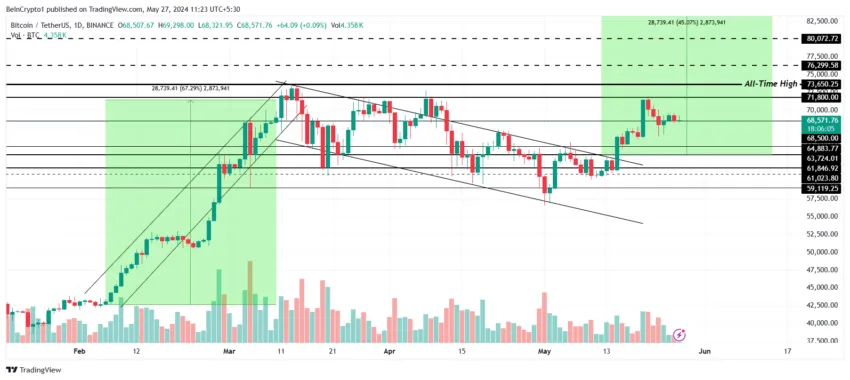
A fall below this support could lead to a significant drawdown, which could drag Bitcoin’s price down to $64,800.
JasmyCoin Takes the Spotlight
JasmyCoin, the native crypto token of a Tokyo-based IoT company, Jasmy Corporation, leveraged the little bullishness still in the market. The altcoin surpassed every other major altcoin to emerge as the best performer in the last 24 hours.
JASMY marked a 30% rally, bringing the crypto asset up from $0.021 to $0.027 and reaching a two-year high as a result.
Read More: What Is JasmyCoin (JASMY)?
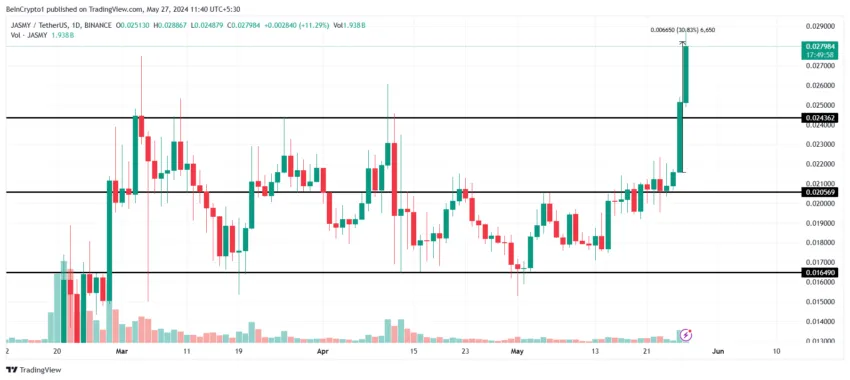
While the all-time high is far away, the next major support is also far away. Thus, if investors do not sustain this rise, the chances of reaching it could vanish, with JASMY falling to the crucial support of $0.024.
Disclaimer
In line with the Trust Project guidelines, this price analysis article is for informational purposes only and should not be considered financial or investment advice. BeInCrypto is committed to accurate, unbiased reporting, but market conditions are subject to change without notice. Always conduct your own research and consult with a professional before making any financial decisions. Please note that our Terms and Conditions, Privacy Policy, and Disclaimers have been updated.


Sui meme coins, not typically seen at the forefront of the sector, are surging in volume recently. Their market cap is far smaller than Solana meme coins, but it’s also growing fast.
LOFI, a meme coin deployed on the blockchain, surged by over 186% in a week. If fresh DEX trading volumes start flowing into these assets, Sui could be the next emerging ecosystem for meme coins.
Are Sui Meme Coins About to Explode?
Meme coins based on Solana have been getting a lot of attention lately, with surging trade volumes and token prices. This has fueled speculation that Solana’s poised to lead a new meme coin boom, especially as the sector is exposed to new risks.
However, Sui meme coins are gaining some unexpected traction, and DEX volumes are noticeably soaring.
Sui is a high-performance Layer-1 blockchain that shares many similarities with Solana but several key differences.
Its design focuses on scalability, using parallel transaction processing and an object-centric transaction model to achieve this aim. Sui’s ecosystem is much less mature than Solana’s, but this could present opportunities for meme coins.
Sui’s developers are constantly working on upgrades to encourage new projects, some of which are explicitly geared towards meme coins. Solana’s 6.3 billion meme coin market cap grew by 2.4% in the previous 24 hours, while Sui’s increased by 4.6%.
LOFI grew 184.5% in the last week, highlighting its dedicated community.
LOFI’s impressive rise stands out, but several other projects on the layer-1 network have also attracted speculative interest. Meme coins thrive on community hype, and the blockchain’s DEX volumes are soaring.
If this high performance and committed enthusiasm connect with fresh investors, it could present an explosive opportunity.
For now, Sui’s meme coin ecosystem has a ways to go, with a total market cap of $123 million. However, this sector moves fast, and the Sui ecosystem could be poised to make some major growth soon, if meme coin enthusiasts continue to trade.
Disclaimer
In adherence to the Trust Project guidelines, BeInCrypto is committed to unbiased, transparent reporting. This news article aims to provide accurate, timely information. However, readers are advised to verify facts independently and consult with a professional before making any decisions based on this content. Please note that our Terms and Conditions, Privacy Policy, and Disclaimers have been updated.
AI coins continue to draw attention as April nears its end, with Render (RENDER), Story Protocol (IP), and CLANKER standing out. RENDER has led the pack, surging nearly 17% this week and reclaiming a $2 billion market cap.
In contrast, Story (IP) is down 6.5%, the worst performer among the top 10 AI tokens, while CLANKER dropped over 7% in the last 24 hours. With momentum shifting across the sector, all three tokens are positioned at key technical levels that could define their next move.
RENDER
Render Network provides decentralized GPU computing power for creators, developers, and artificial intelligence applications. Its infrastructure supports rendering for 3D graphics, visual effects, and artificial intelligence model training.

RENDER, the network’s native token, has surged nearly 17% over the past week, pushing its market cap back above $2 billion. It was the top performer among the ten largest AI coins in the market.
If the bullish momentum holds, RENDER could test resistance levels at $4.065 and $4.21, and a breakout could open the path to $4.63.
However, if the trend reverses, key support lies at $3.82 and $3.68—losing these could trigger a deeper decline toward $3.47 or even $3.14 in a stronger correction.
Story (IP)
Story Protocol is a decentralized infrastructure designed to manage and monetize intellectual property (IP) on-chain, with a strong focus on artificial intelligence.
It allows creators to register stories, characters, and other digital assets, enabling collaborative development, licensing, and programmable royalties—all while integrating AI into the creation and distribution process.
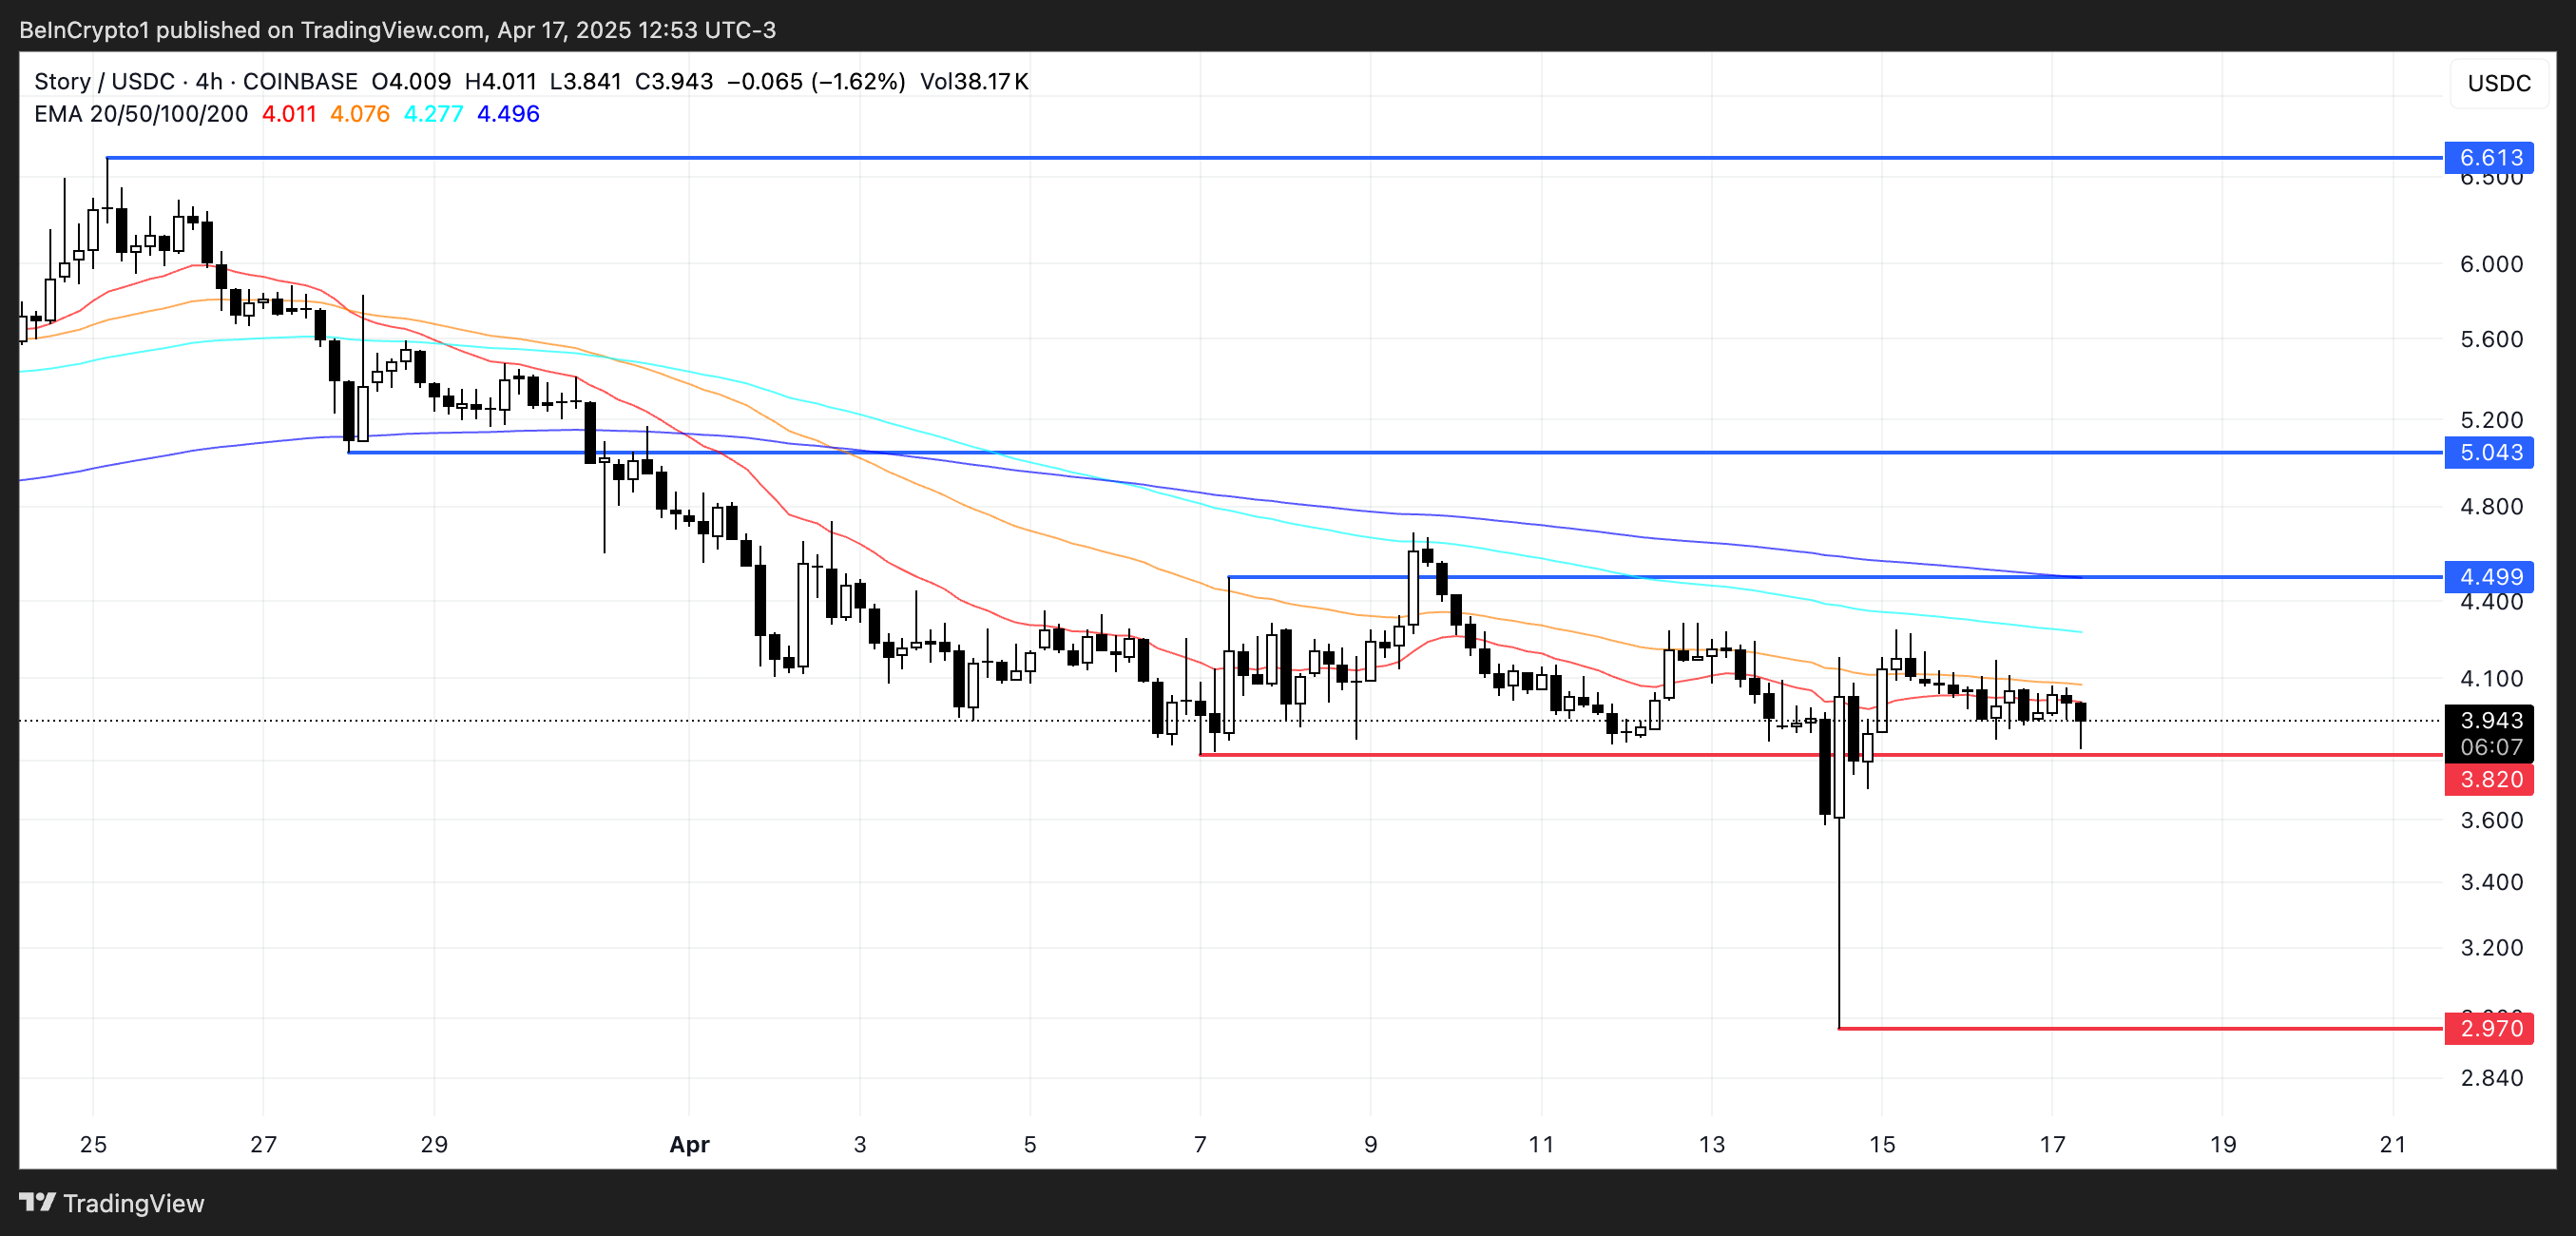
Despite its explosive 477% rally between February 16 and 26, Story’s native token, IP, is down 6.5% over the last seven days—the largest drop among the top 10 AI coins.
If the current correction continues, IP could test support at $3.82, and a break below that may push the price under $3. However, if bullish momentum returns, IP could retest resistance at $4.49 and then aim for $5.04.
A strong rebound could eventually lift the token back toward the $6.61 zone, reclaiming some of its earlier hype.
tokenbot (CLANKER)
Tokenbot is a coin launchpad built on the Base chain. Its native token, CLANKE, has been down over 7% in the last 24 hours.
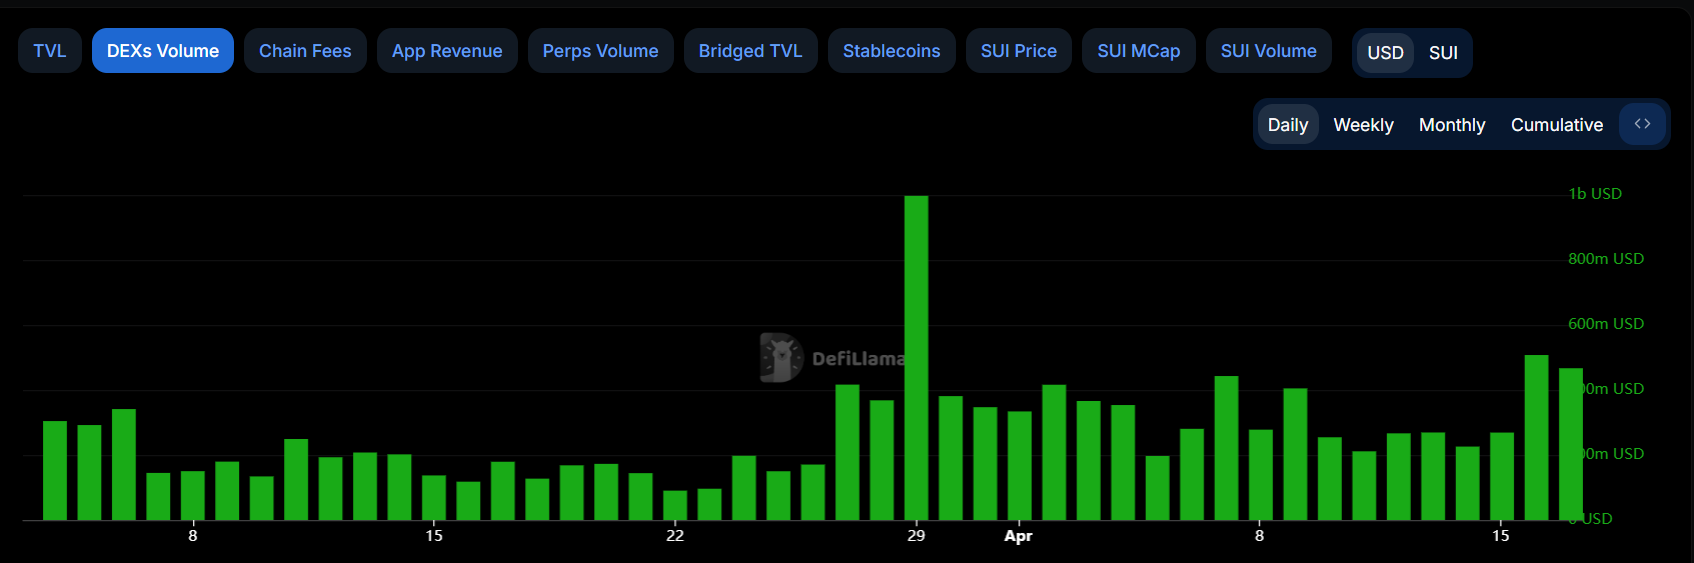
Notably, Base has climbed to the fourth spot in weekly DEX volume, reaching $4.7 billion—just behind BNB, Ethereum, and Solana—although its volume is down 7.73% in the last week.
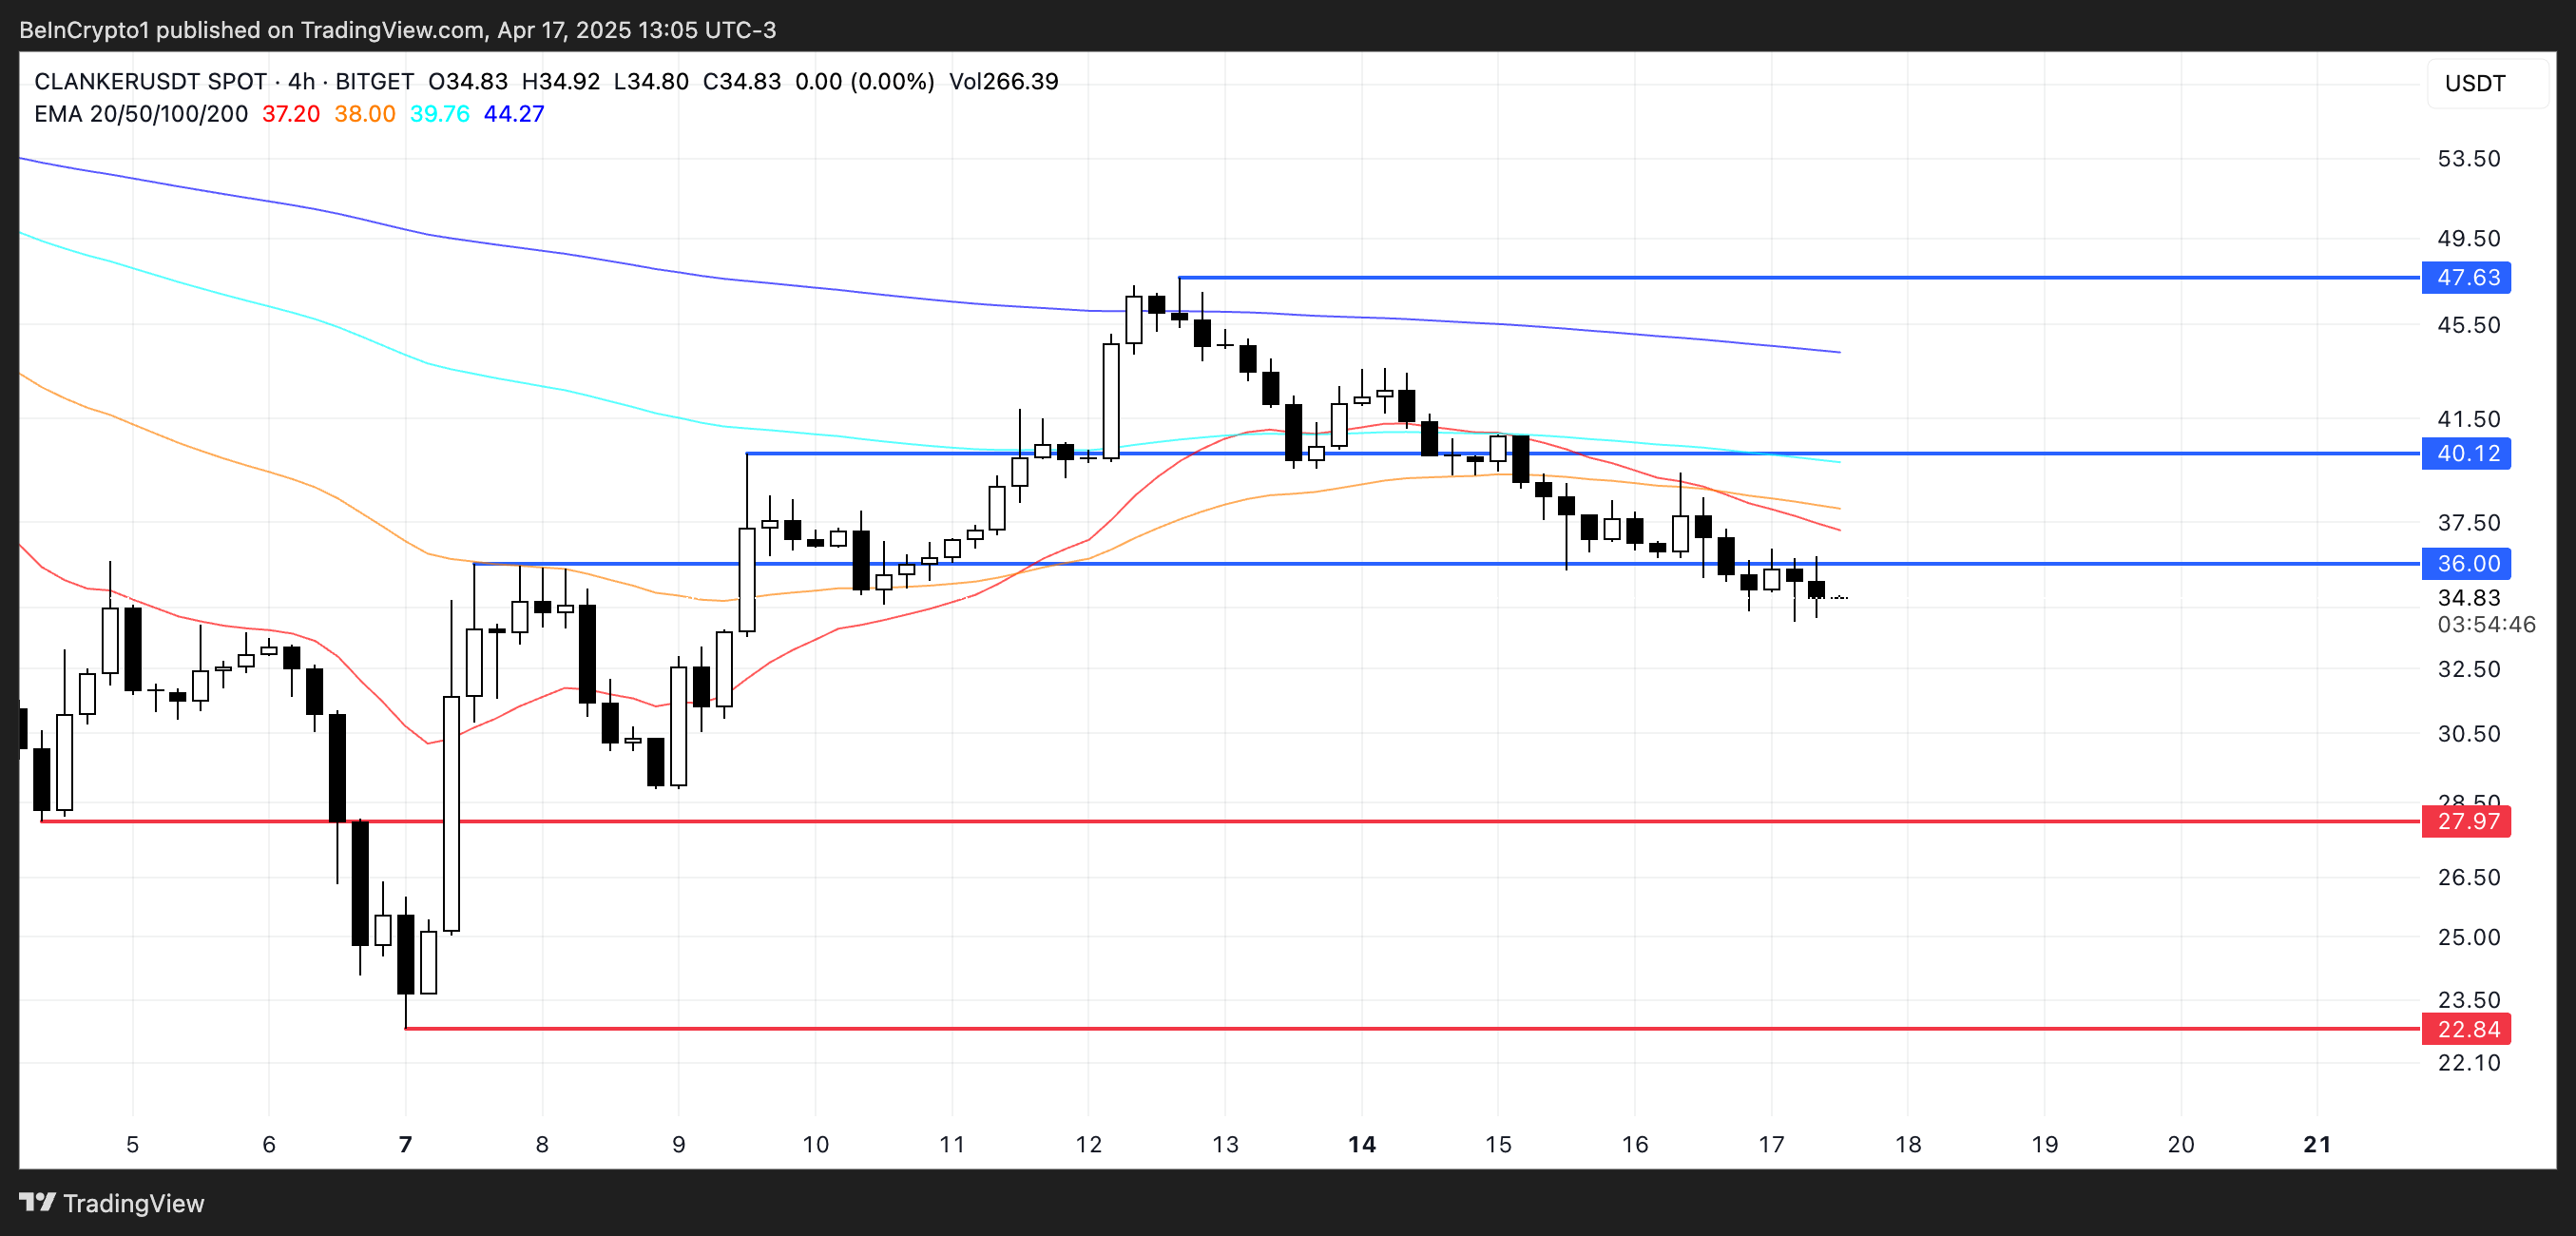
Interest remains around Base’s recent push into “Content Coins,” with the community watching closely to see how the narrative evolves.
If CLANKER’s current downtrend deepens, it could test support at $27.97 and potentially fall to $22.84, dropping below $25 for the first time since April 6.
On the upside, a recovery could lead to a test of the $36 resistance, followed by $40. If sentiment around Base tokens strengthens, CLANKER could rally toward $47 as momentum builds.
Disclaimer
In line with the Trust Project guidelines, this price analysis article is for informational purposes only and should not be considered financial or investment advice. BeInCrypto is committed to accurate, unbiased reporting, but market conditions are subject to change without notice. Always conduct your own research and consult with a professional before making any financial decisions. Please note that our Terms and Conditions, Privacy Policy, and Disclaimers have been updated.

Hedera (HBAR) is up more than 5% in the last 24 hours, showing signs of short-term relief after a rough start to April.
Despite the bounce, technical indicators still point to a weak overall trend, with bearish EMA alignment and a flat ADX reading. Momentum remains uncertain, but bulls have managed to defend key support levels so far.
Hedera Shows Early Signs of Bullish Shift, But Trend Still Weak
Hedera’s DMI indicator shows its ADX at 19.8—slightly up from 18.49 two days ago but down from a recent high of 21.94 earlier today.
The ADX (Average Directional Index) measures the strength of a trend, regardless of its direction. Values below 20 typically indicate a weak or consolidating market, while readings above 25 suggest a strong trend is developing.
HBAR’s current ADX near 20 suggests momentum is still relatively soft, with no clear directional strength in place.

Looking at the directional indicators, the +DI (Directional Indicator) has risen from 13.42 to 14.2, showing a slight increase in bullish pressure. Meanwhile, the -DI has declined from 19.89 to 17.15, indicating weakening bearish momentum.
This narrowing gap between +DI and -DI may signal a potential shift in favor of the bulls, but with ADX still under 25, the trend remains unconfirmed.
If +DI continues to climb and crosses above -DI, Hedera could attempt a short-term reversal—but for now, the market remains in a cautious, sideways phase.
HBAR Enters Cloud Zone as Trend Momentum Stalls
The Ichimoku Cloud chart for HBAR reflects a mostly neutral to slightly bearish trend.
The price is currently trading below the Kijun-sen (red line) and very close to the Tenkan-sen (blue line), indicating weak short-term momentum and a lack of clear direction.
Both lines are flat, which often signals consolidation and market indecision.

Looking ahead, the Kumo (cloud) is relatively thick and bearish, with the Senkou Span A below the Senkou Span B. However, price action has entered the cloud zone, suggesting possible trend exhaustion or transition.
The Chikou Span (lagging green line) is overlapping with recent price candles, reinforcing the sideways outlook.
Unless HBAR breaks cleanly above the cloud and reclaims the Kijun-sen, the market is likely to remain in a holding pattern.
Hedera Holds Key Supports, But Bearishness Still Lingers
Hedera’s EMA lines are currently showing a bearish structure, with short-term averages positioned below the long-term ones—typically a sign of ongoing downward momentum.
Despite this, HBAR price has recently tested and held support at both $0.156 and $0.153, signaling that buyers are still defending key levels. If the trend reverses from here, HBAR could begin a recovery move, first targeting resistance at $0.168.
A break above that level could open the path to $0.178, and if bullish momentum strengthens further, a move toward $0.201 could follow.

On the flip side, if selling pressure resumes, Hedera could retest the same support zones at $0.156 and $0.153.
Losing these levels would weaken the technical structure significantly and could trigger a deeper drop.
In that case, the next major support comes all the way down near $0.124, which would represent a substantial decline and reinforce the current bearish trend.
Disclaimer
In line with the Trust Project guidelines, this price analysis article is for informational purposes only and should not be considered financial or investment advice. BeInCrypto is committed to accurate, unbiased reporting, but market conditions are subject to change without notice. Always conduct your own research and consult with a professional before making any financial decisions. Please note that our Terms and Conditions, Privacy Policy, and Disclaimers have been updated.

Analysts Predict XRP Price to Hit $6 as Wave 2 Correction Nears End

Sui Meme Coins Surge With Rising DEX Volumes

Tron Founder Justin Sun Reveals Plan To HODL Ethereum Despite Price Drop

Top 3 AI Coins To Watch: RENDER, IP, and CLANKER

Ethereum Investors Suffer More Losses Than Bitcoin Amid Ongoing Market Turmoil

Dogecoin Price Breakout in view as Analyst Predicts $5.6 high

2.52 Million Altcoins Are Ruining Crypto’s Future

Animoca Brands Valuation Tanks 75% In Two Years, Here’s Why

Crypto exchange BingX hacked for $43 million

Are The Big Players Losing Interest?

Hong Kong’s Securities Association Tips Authorities On Crypto Self-Regulation

Coinbase cbBTC Set to go Live on Solana
2.52 Million Altcoins Are Ruining Crypto’s Future
Animoca Brands Valuation Tanks 75% In Two Years, Here’s Why
Crypto exchange BingX hacked for $43 million
Are The Big Players Losing Interest?
Hong Kong’s Securities Association Tips Authorities On Crypto Self-Regulation
Coinbase cbBTC Set to go Live on Solana
-
 Market21 hours ago
Bitcoin and Global M2 Money Supply: A Misleading Connection?
-

 Market23 hours ago
No Rate Cut Soon, Crypto Banking Rules to Ease
-

 Market17 hours ago
Bitcoin Whales Withdraw $280 Million: Bullish Signal?
-

 Market22 hours ago
Ethereum Price Struggles to Rebound—Key Hurdles In The Way
-

 Ethereum22 hours ago
77K Ethereum Moved to Derivatives—Is Another Price Crash Looming?
-
 Altcoin18 hours ago
How Rising Solana Network Inflows Could Drive SOL Price to $150?
-
 Bitcoin18 hours ago
Gary Gensler Explains Why Bitcoin Will Outlast Altcoins
-
 Altcoin17 hours ago
How Crypto Traders Made $666K from $4.5K in One Trade?
