
Market
Why BONK Price Increase Could Come to a Halt

BONK’s price is enjoying the bullishness of the broader market cues, but despite the massive rise, the future appears not so bright.
This is because the investors are exhibiting mixed signals at the moment, which could lead to a neutral-bearish outcome.
Bonk Investors Seem Unsure
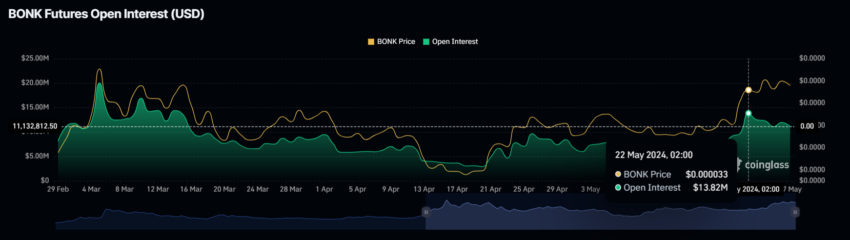
BONK price is poised to witness a contraction as investors show slight bearishness. This can be seen in the money being pulled out of the Futures market, evidenced in the Open Interest.
Open interest refers to the total number of outstanding derivative contracts, such as options or futures, that have not been settled. In five days, BONK’s open interest dropped by 20% from $13.8 million to $11.1 million.
This $2.7 million decline shows investors are not keen on trading BONK, a bearish sign for the altcoin.
However, investors still hope for a rally despite money being pulled out of the Futures market. Their faith in the rise is evident in the still positive funding rate.
The funding rate is the periodic payment between long and short positions in a perpetual futures contract to maintain its price close to the underlying asset’s value. It reflects the balance of buying and selling pressure in the market.
Read More: Bonk Airdrop Eligibility: Who Can Claim and How?
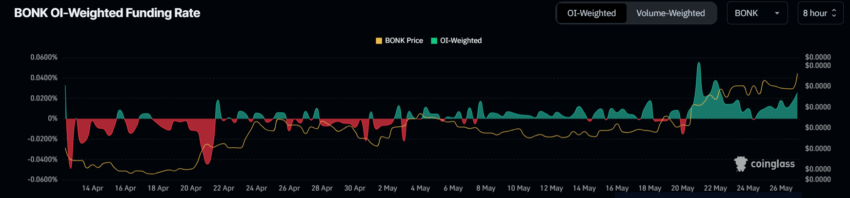
The negative funding rate suggests that short contracts are dominating the market, while long contracts hint at positive contracts taking precedence. Such is the case with BONK as well, which could counter the bearishness from the declining open interest.
BONK Price Prediction: Sideways Is the New Uptrend
The BONK price, trading at 0.00003783, is slightly above the key resistance of 0.00003769. This is the closing price of the previous 2024 high when BONK reached 0.00004800 during the intra-day trading hours.
However, a close above this resistance is unlikely. Secondly, the above-mentioned factors might reduce the bullishness in the market, which could result in a consolidation. BONK could witness sideways movement between 0.00003769 and 0.00002811.
Read More: Best Upcoming Airdrops in 2024
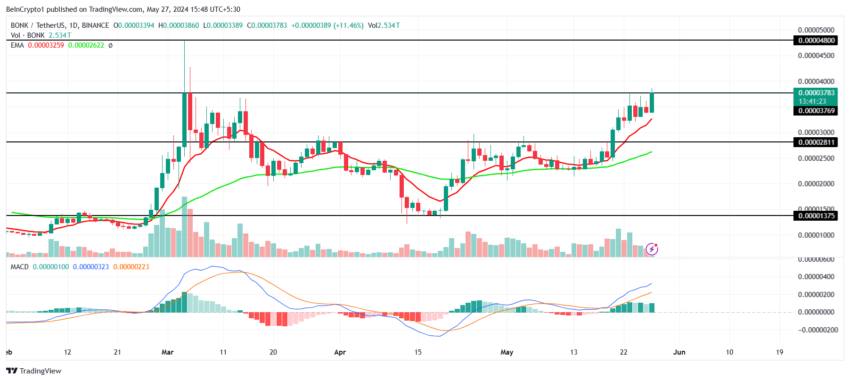
On the other hand, if either of the limits is breached, the neutral-bearish thesis would be invalidated. A breakout may push the BONK price to 0.00004500 and above, while a breakdown may bring the meme coin down to 0.00002200.
Disclaimer
In line with the Trust Project guidelines, this price analysis article is for informational purposes only and should not be considered financial or investment advice. BeInCrypto is committed to accurate, unbiased reporting, but market conditions are subject to change without notice. Always conduct your own research and consult with a professional before making any financial decisions. Please note that our Terms and Conditions, Privacy Policy, and Disclaimers have been updated.


Reason to trust
![]()
Strict editorial policy that focuses on accuracy, relevance, and impartiality
Created by industry experts and meticulously reviewed
The highest standards in reporting and publishing
Strict editorial policy that focuses on accuracy, relevance, and impartiality
Morbi pretium leo et nisl aliquam mollis. Quisque arcu lorem, ultricies quis pellentesque nec, ullamcorper eu odio.
Ethereum price attempted a recovery wave above the $1,880 level but failed. ETH is now trimming all gains and remains below the $1,880 resistance zone.
- Ethereum failed to stay above the $1,850 and $1,880 levels.
- The price is trading below $1,850 and the 100-hourly Simple Moving Average.
- There was a break below a key bullish trend line with support at $1,865 on the hourly chart of ETH/USD (data feed via Kraken).
- The pair must clear the $1,865 and $1,890 resistance levels to start a decent increase.
Ethereum Price Fails Again
Ethereum price managed to stay above the $1,800 support zone and started a recovery wave, like Bitcoin. ETH was able to climb above the $1,850 and $1,880 resistance levels.
The bulls even pushed the price above the $1,920 resistance zone. However, the bears are active near the $1,950 zone. A high was formed at $1,955 and the price trimmed most gains. There was a break below a key bullish trend line with support at $1,865 on the hourly chart of ETH/USD.
A low was formed at $1,781 and the price is now consolidating near the 23.6% Fib retracement level of the downward move from the $1,955 swing high to the $1,781 low.
Ethereum price is now trading below $1,850 and the 100-hourly Simple Moving Average. On the upside, the price seems to be facing hurdles near the $1,850 level. The next key resistance is near the $1,865 level and the 50% Fib retracement level of the downward move from the $1,955 swing high to the $1,781 low.

The first major resistance is near the $1,920 level. A clear move above the $1,920 resistance might send the price toward the $1,950 resistance. An upside break above the $1,950 resistance might call for more gains in the coming sessions. In the stated case, Ether could rise toward the $2,000 resistance zone or even $2,050 in the near term.
Another Decline In ETH?
If Ethereum fails to clear the $1,865 resistance, it could start another decline. Initial support on the downside is near the $1,800 level. The first major support sits near the $1,780 zone.
A clear move below the $1,780 support might push the price toward the $1,720 support. Any more losses might send the price toward the $1,680 support level in the near term. The next key support sits at $1,620.
Technical Indicators
Hourly MACD – The MACD for ETH/USD is gaining momentum in the bearish zone.
Hourly RSI – The RSI for ETH/USD is now below the 50 zone.
Major Support Level – $1,780
Major Resistance Level – $1,865
Cardano price started a recovery wave above the $0.680 zone but failed. ADA is consolidating near $0.650 and remains at risk of more losses.
- ADA price failed to recover above the $0.70 resistance zone.
- The price is trading below $0.680 and the 100-hourly simple moving average.
- There was a break below a connecting bullish trend line with support at $0.6720 on the hourly chart of the ADA/USD pair (data source from Kraken).
- The pair could start another increase if it clears the $0.70 resistance zone.
Cardano Price Dips Again
In the past few days, Cardano saw a recovery wave from the $0.6350 zone, like Bitcoin and Ethereum. ADA was able to climb above the $0.680 and $0.6880 resistance levels.
However, the bears were active above the $0.70 zone. A high was formed at $0.7090 and the price corrected most gains. There was a move below the $0.650 level. Besides, there was a break below a connecting bullish trend line with support at $0.6720 on the hourly chart of the ADA/USD pair.
A low was formed at $0.6356 and the price is now consolidating losses near the 23.6% Fib retracement level of the recent decline from the $0.7090 swing high to the $0.6356 low. Cardano price is now trading below $0.680 and the 100-hourly simple moving average.
On the upside, the price might face resistance near the $0.6720 zone or the 50% Fib retracement level of the recent decline from the $0.7090 swing high to the $0.6356 low. The first resistance is near $0.6950. The next key resistance might be $0.700.

If there is a close above the $0.70 resistance, the price could start a strong rally. In the stated case, the price could rise toward the $0.7420 region. Any more gains might call for a move toward $0.7650 in the near term.
Another Drop in ADA?
If Cardano’s price fails to climb above the $0.6720 resistance level, it could start another decline. Immediate support on the downside is near the $0.6420 level.
The next major support is near the $0.6350 level. A downside break below the $0.6350 level could open the doors for a test of $0.620. The next major support is near the $0.60 level where the bulls might emerge.
Technical Indicators
Hourly MACD – The MACD for ADA/USD is losing momentum in the bearish zone.
Hourly RSI (Relative Strength Index) – The RSI for ADA/USD is now below the 50 level.
Major Support Levels – $0.6420 and $0.6350.
Major Resistance Levels – $0.6720 and $0.7000.
Aayush Jindal, a luminary in the world of financial markets, whose expertise spans over 15 illustrious years in the realms of Forex and cryptocurrency trading. Renowned for his unparalleled proficiency in providing technical analysis, Aayush is a trusted advisor and senior market expert to investors worldwide, guiding them through the intricate landscapes of modern finance with his keen insights and astute chart analysis.
From a young age, Aayush exhibited a natural aptitude for deciphering complex systems and unraveling patterns. Fueled by an insatiable curiosity for understanding market dynamics, he embarked on a journey that would lead him to become one of the foremost authorities in the fields of Forex and crypto trading. With a meticulous eye for detail and an unwavering commitment to excellence, Aayush honed his craft over the years, mastering the art of technical analysis and chart interpretation.
As a software engineer, Aayush harnesses the power of technology to optimize trading strategies and develop innovative solutions for navigating the volatile waters of financial markets. His background in software engineering has equipped him with a unique skill set, enabling him to leverage cutting-edge tools and algorithms to gain a competitive edge in an ever-evolving landscape.
In addition to his roles in finance and technology, Aayush serves as the director of a prestigious IT company, where he spearheads initiatives aimed at driving digital innovation and transformation. Under his visionary leadership, the company has flourished, cementing its position as a leader in the tech industry and paving the way for groundbreaking advancements in software development and IT solutions.
Despite his demanding professional commitments, Aayush is a firm believer in the importance of work-life balance. An avid traveler and adventurer, he finds solace in exploring new destinations, immersing himself in different cultures, and forging lasting memories along the way. Whether he’s trekking through the Himalayas, diving in the azure waters of the Maldives, or experiencing the vibrant energy of bustling metropolises, Aayush embraces every opportunity to broaden his horizons and create unforgettable experiences.
Aayush’s journey to success is marked by a relentless pursuit of excellence and a steadfast commitment to continuous learning and growth. His academic achievements are a testament to his dedication and passion for excellence, having completed his software engineering with honors and excelling in every department.
At his core, Aayush is driven by a profound passion for analyzing markets and uncovering profitable opportunities amidst volatility. Whether he’s poring over price charts, identifying key support and resistance levels, or providing insightful analysis to his clients and followers, Aayush’s unwavering dedication to his craft sets him apart as a true industry leader and a beacon of inspiration to aspiring traders around the globe.
In a world where uncertainty reigns supreme, Aayush Jindal stands as a guiding light, illuminating the path to financial success with his unparalleled expertise, unwavering integrity, and boundless enthusiasm for the markets.

Ethereum Price Recovery Stalls—Bears Keep Price Below $2K

Cardano (ADA) Downtrend Deepens—Is a Rebound Possible?
Analyst Forecasts 250% Dogecoin Price Rally If This Level Holds

XRP Price Under Pressure—New Lows Signal More Trouble Ahead

Bitcoin Price Swings Wildly—Yet Bears Keep the Upper Hand!

Binance Sidelines Pi Network Again In Vote To List Initiative, Here’s All


-

 Market23 hours ago
BNB Price Faces More Downside—Can Bulls Step In?
-
 Regulation17 hours ago
Kraken Obtains Restricted Dealer Registration in Canada
-

 Market24 hours ago
VanEck Sets Stage for BNB ETF with Official Trust Filing
-

 Bitcoin23 hours ago
Tokenized Gold Market Cap Tops $1.2 Billion as Gold Prices Surge
-

 Bitcoin19 hours ago
Lummis Confirms Treasury Probes Direct Buys
-

 Altcoin19 hours ago
Franklin Templeton Eyes Crypto ETP Launch In Europe After BlackRock & 21Shares
-
 Altcoin13 hours ago
Here’s Why This Analyst Believes XRP Price Could Surge 44x
-
 Altcoin12 hours ago
How Will Elon Musk Leaving DOGE Impact Dogecoin Price?
 Arabic
 Chinese (Simplified)
 Dutch
Dutch English
 French
 German
 Italian
 Portuguese
 Russian
 Spanish
 Vietnamese