
Market
Why ADA’s Increase May Not Continue
Cardano’s (ADA) price has increased by a modest 3.85% in the last 24 hours. This hike has brought back hopes that the altcoin could produce gains for investors who purchased the token at a higher value than its current price.
While optimism surrounds ADA’s potential growth, technical and on-chain data suggest that such ambitious profit targets might be unrealistic. Here is why.
Cardano Sets Holders Up for Disappointment
Cardano’s recent increase has ensured that the price did not pull back to $0.30. While it trades at $0.36, the Global In/Out of Money (GIOM) shows that those who accumulated ADA between $0.36 and $0.39 are still holding at a loss.
For context, the GIOM categorizes addresses and volumes based on their profitability. By showing this aggregate, the indicator can spot resistance and support areas that could either help accelerate the upswing or invalidate it.
Typically, the larger the volume (clusters), the stronger the support or resistance. As seen below, 373,000 addresses that accumulated 5.21 billion ADA at an average price of $0.37 are out of the money. At current prices, this volume is worth $1.87 billion and is larger than those holding ADA in profits, which purchased around $0.35.
Read more: How To Buy Cardano (ADA) and Everything You Need To Know
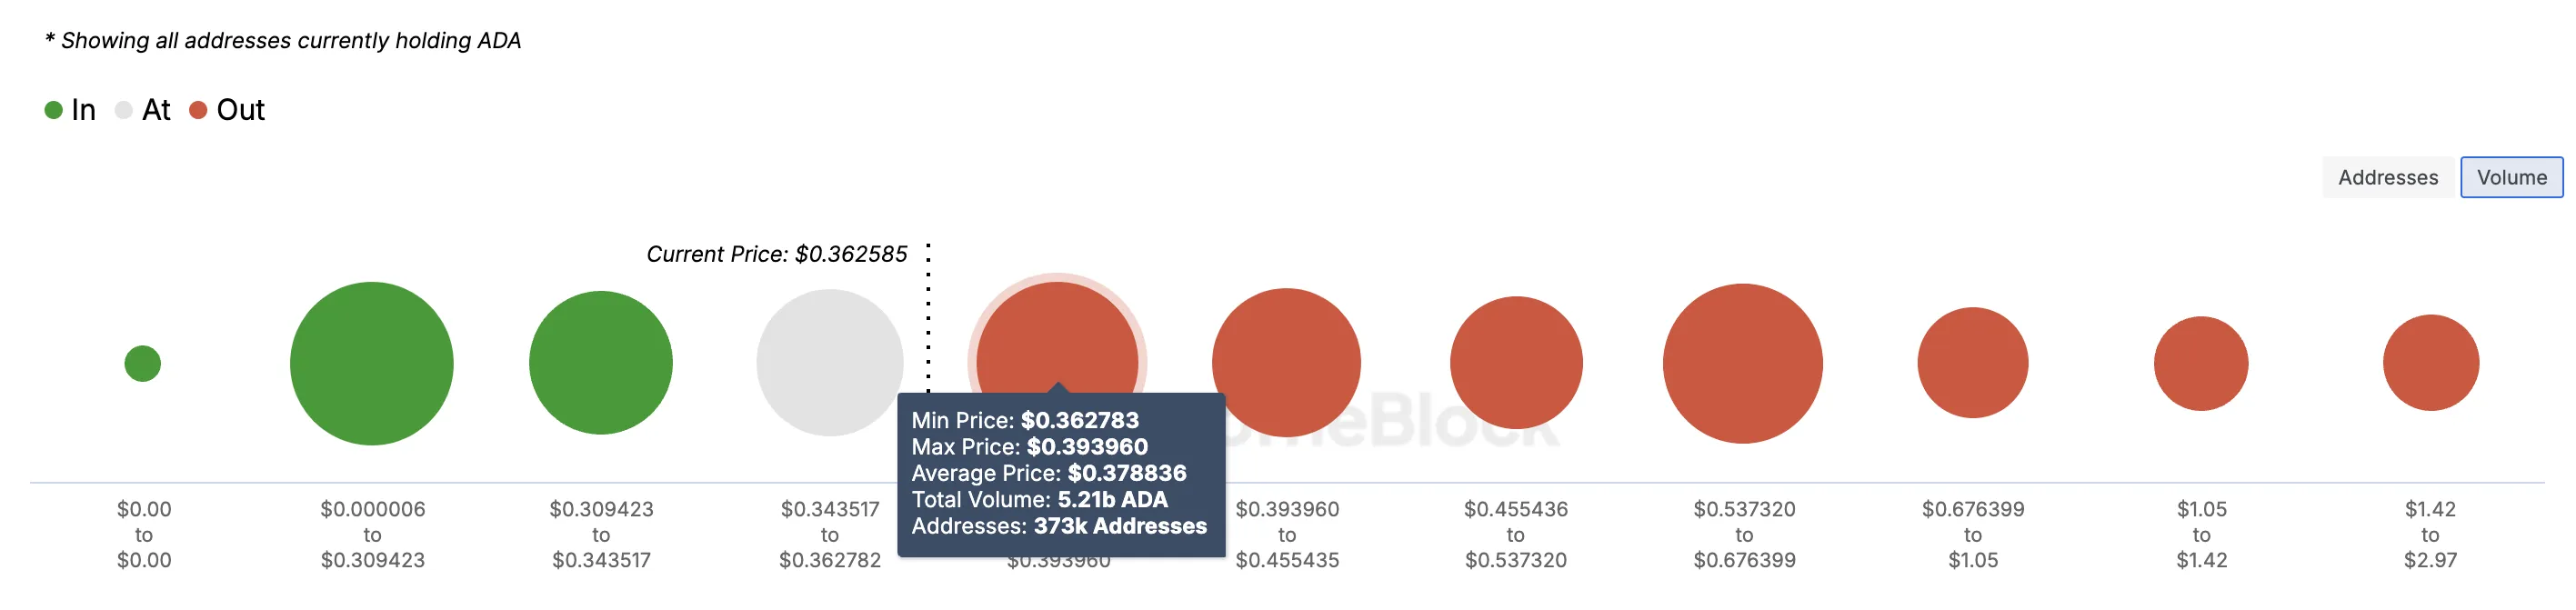
Based on the conditions above, it is highly unlikely that ADA will reach $0.39 in the short term due to this supply zone. As such, some of these Cardano investors might fail to achieve the profitable status desired.
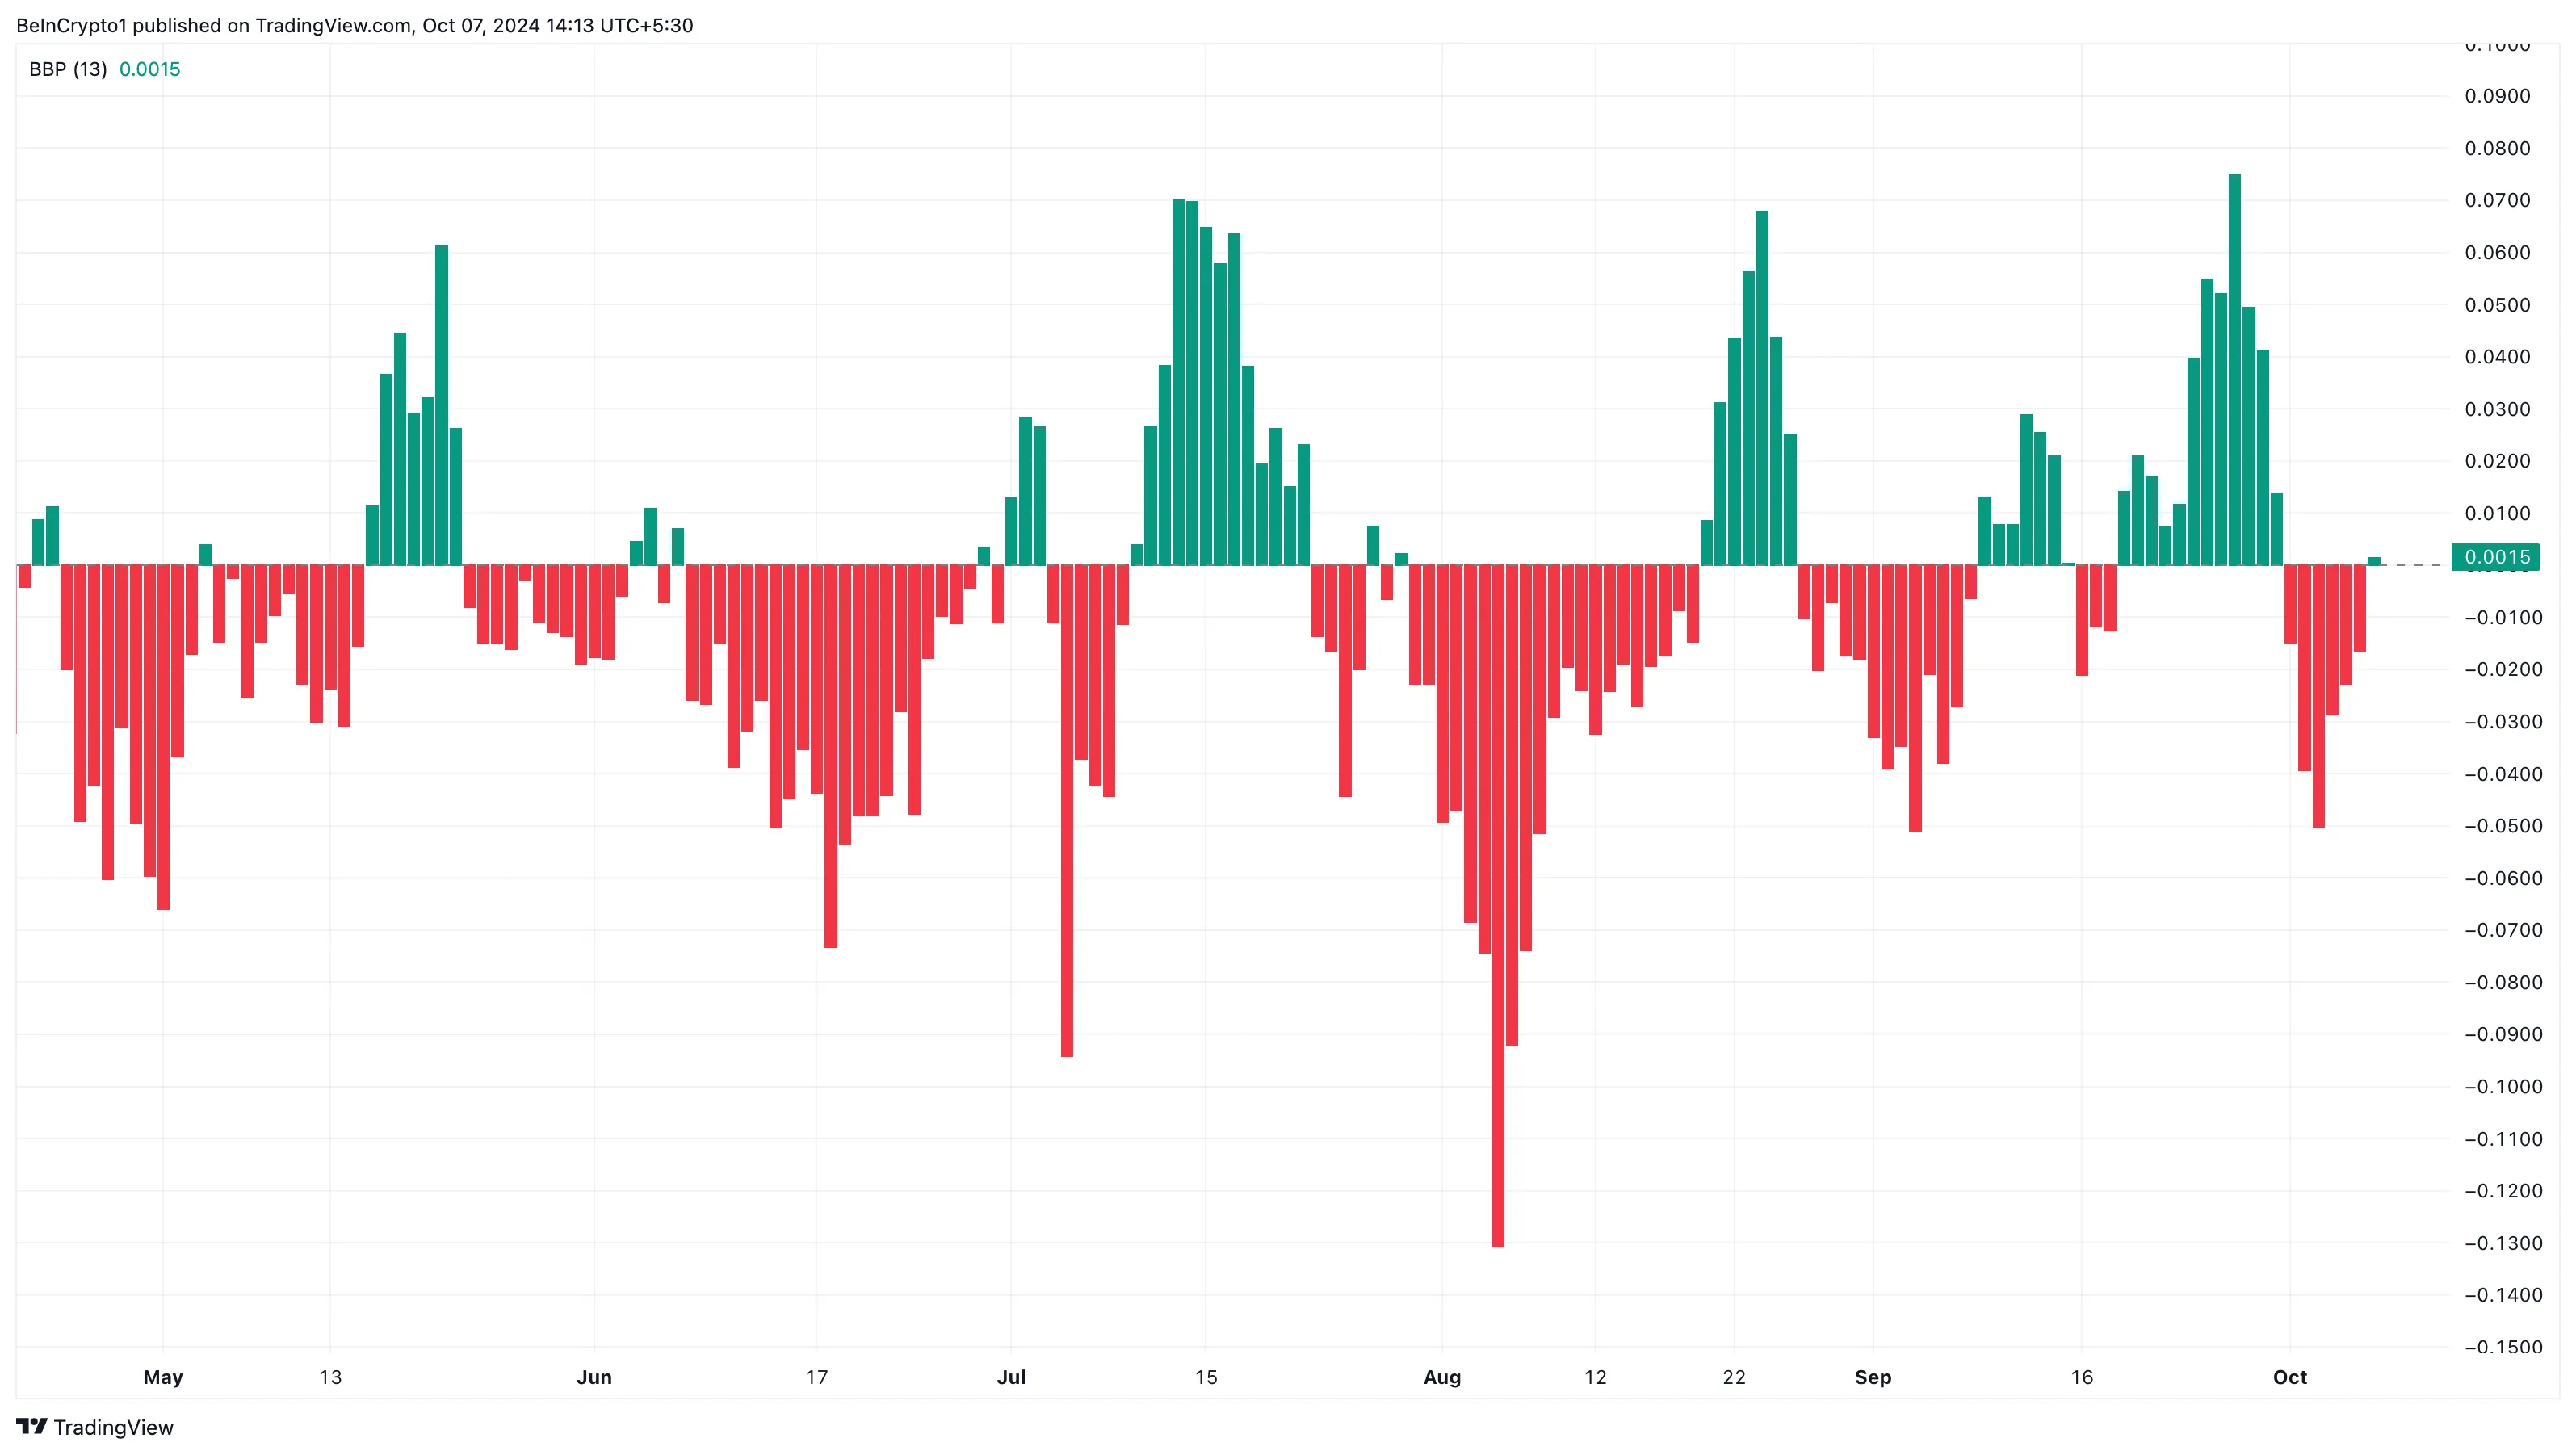
Another indicator suggesting a Cardano price decrease is the Bull Bear Power (BBP). The BBP compares the strength of buyers (bulls) with that of sellers (bears). When the indicator’s reading is green, buyers are in control, but if it is in the red, sellers are dominant.
On the daily chart, there is a slight green histogram bar. However, it is nothing compared to the red ones, suggesting that bulls are yet to match bearish control.
ADA Price Prediction: No More Appreciation
Following its recent jump, ADA is approaching two major supply zones: one at $0.42 and the other around $0.50. An analysis of the daily chart shows that Cardano might face resistance around $0.37.
If validated, this could send the token’s value down to $0.34 support. If bulls fail to defend this support, ADA’s price might see another decline, and the cryptocurrency’s value could tank to $0.31.
Read more: 6 Best Cardano (ADA) Wallets You Should Consider in October 2024
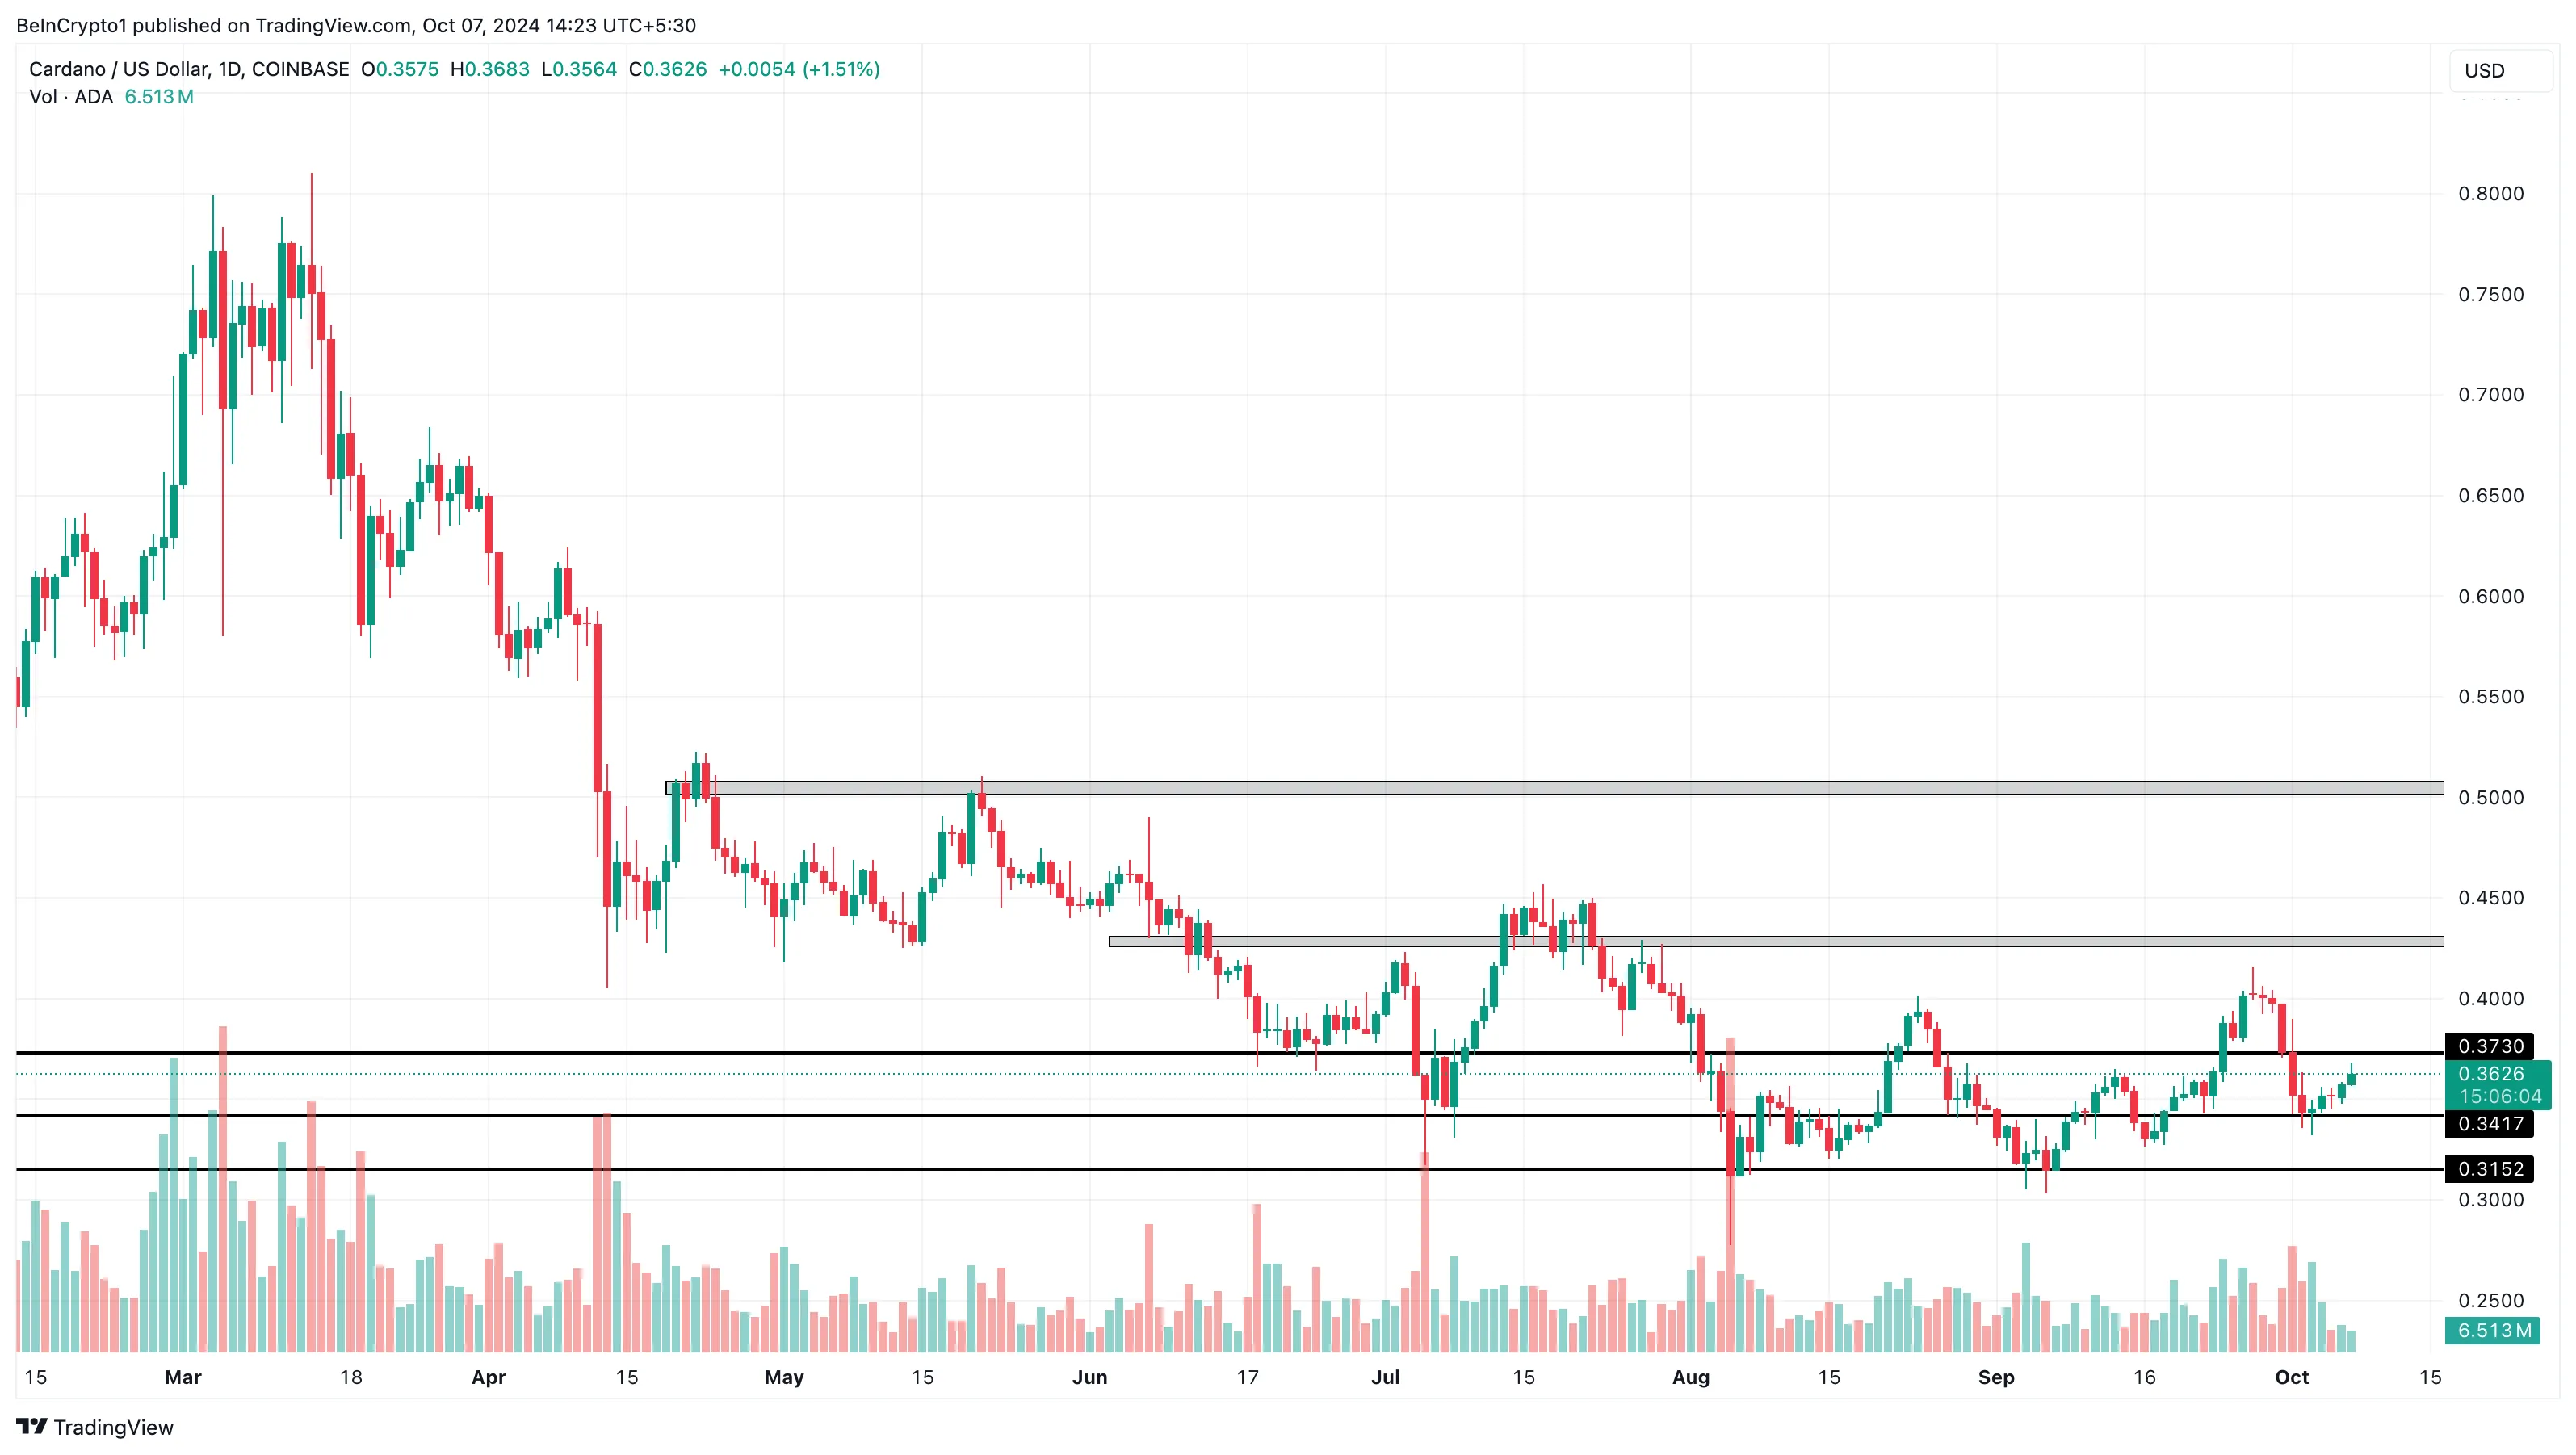
On the flip side, Cardano could resist going down to that point if the strength of buyers improves. Should that be the case, the Cardano’s price might breach $0.42 and head toward $0.50.
Disclaimer
In line with the Trust Project guidelines, this price analysis article is for informational purposes only and should not be considered financial or investment advice. BeInCrypto is committed to accurate, unbiased reporting, but market conditions are subject to change without notice. Always conduct your own research and consult with a professional before making any financial decisions. Please note that our Terms and Conditions, Privacy Policy, and Disclaimers have been updated.


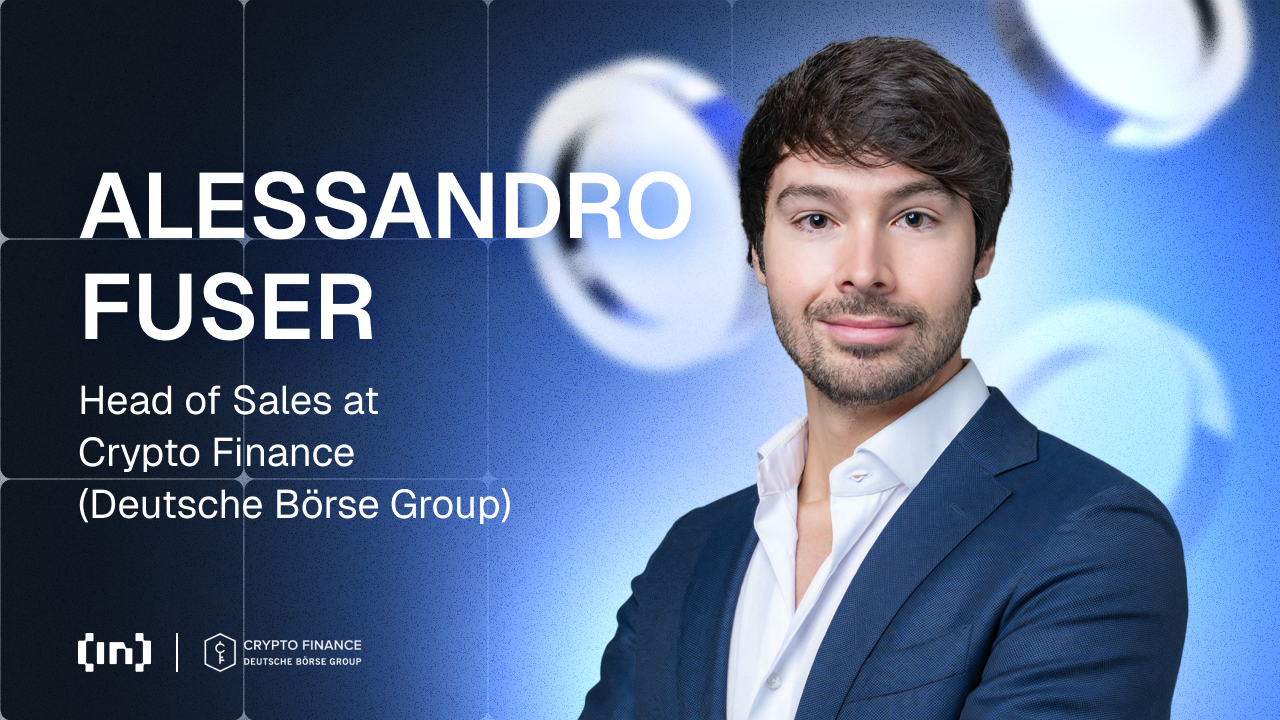
As crypto continues its transformation from fringe curiosity to legitimate asset class, traditional financial institutions are no longer sitting on the sidelines. In a candid conversation, Alessandro Fuser, Head of Sales at Crypto Finance, a firm enabling banks to navigate the digital asset world, unpacks how regulation, especially across Europe, is finally catching up with innovation.
Fuser breaks down how institutions are shifting from hesitation to action, the role of trust in this transition, and why the “start small but start now” approach is key to success. From the fallout of recent hacks to the promise of deeper liquidity access and the landmark partnership with Clearstream, this conversation maps out the evolving role of crypto infrastructure in mainstream finance.
Fuser on Crypto Finance Bridging TradFi and Crypto
At the end of the day, Crypto Finance provides market infrastructures to enable banks that are interested in crypto services to launch in a compliant and secured manner services across trading, custody, and post-trade settlements. My role as the head of sales is to enable them to go through this kind of journey in the safest way possible. With all the questions that, at the end of the day, different teams will have and ultimately create that level of familiarity that is needed for the traditional financial space to embrace new asset classes like crypto
Trust is important. Generally, there’s a difficulty in finding trust when there aren’t answers. The answers, especially now in 2025, obviously exist. The regulatory market is only now catching up in areas such as the European Union. So, a lot of what we do, especially as someone who’s been in Switzerland, working with Swiss banks that are alive in the space, is to provide visibility to other entrances as to how companies that they compare themselves to have done things. Phased approaches, starting in a conservative manner and only over time, add more complexity and more sophistication to the services so that they don’t have any reputational risks. They can take advantage of the opportunities of crypto as an asset class. And provide a service to their customers that is of the quality that they expect.
Shifting Attitudes and Regulations in 2025
I think the biggest difference is that despite everyone knowing that regulation in Europe is coming, the regulation is now here. On the back of this, a lot of different banks are formalizing projects, which up to that point they were not and only through experience do they effectively know what should and should not be done.
The speed at which a lot of these projects are now being formalized is obviously faster, mainly on the back of the elections and, to an extent, on the back of increased competitiveness that will exist with the United States now being more open to crypto as an asset class. So I think this is an important one. At the time I had talked about a degree of fragmentation in the market, when it came to custody, when it came to liquidity.
I think there are a number of initiatives that are ultimately making the landscape more efficient. Some of these initiatives are happening at a crypto-native level. I think about off-exchange services, which reduce your counterpart and your risk on the custody side and allow you to have exposure to markets. But this is also true on the custodial front, with companies such as Clearstream, for example, which is a traditional ICSD offering the new asset class without reinventing the wheel, simply allowing banks that they connected to leverage the connectivity and unlock the asset class.
Crypto’s Agility vs. TradFi’s Caution: Finding Common Ground
I like the juxtaposition. I don’t think that the two approaches are mutually exclusive. You have a secure compliant setup that isn’t necessarily boring or excessively conservative to make you lose the opportunity. And that’s potentially where, within a protective environment, it makes sense to experiment and “break things,” to use your words. Now, Crypto Finance, specifically being a regulated entity, obviously has more constraints. Having said this, what we do is to continue being innovative by partnering with all sorts of players in the market to reinforce our service offering, to future-proof our service offering without compromising at the end of the day the reputation and especially the status quo.
I would like to mention one thing, though: our experience is mainly revolving around regulated clientele and what we always advise is ‘start small, start simply, but do start’. And I think this is what has been missing in the past. The lack of certainty around certain things of even the complexity around launching a new offering, was oftentimes preventing the regulating intermediaries from getting into the space in the first place, which then resulted in a harder consumer protection because service providers were instead coming from a completely different angle.
So a lot of what we do now is that we try to push to get started with simple, close-look trading and custody, allow the banks, allow the product issuers to start accumulating experience with, for example, on the product issuer’s side a single token in ETP. This is not going to be the most revolutionary thing but it allows you to understand flows, and then add complexity, adding staking and over time potentially borrowing and lending.
Adapting to the Pace of Traditional Finance
To an extent, I believe that the decision making is still very much low in the regulated traditional financial space. At the same time, I have seen projects in the crypto space being formalized and enacted or executed at a pace that is significantly faster compared to potentially other asset classes in the past. And the reason is two folds: the market, I think, has validated the crypto asset class sufficiently. The competitiveness of, say retail brokers, neo-banks, crypto exchanges is obviously to an extent a threat to some of the traditional players, especially retail banks for example.
There have been outflows for the past couple years, which for some have hurt, but more importantly, the growth or the rate at which those outflows are happening is something that is raising the alarm here and there. So, the banks, because of this, are acting ; they’re making sure that they have the right amount of knowledge, the right amount of talent in house, and they’re starting somewhere.
Neo-Banks vs Traditional Banks: A Shift in Custody Models
I think there is a degree of disruption happening for sure. Also, the underlined service is being packaged differently but the substance isn’t really too different. I would also argue that some of the – let me use the word – “sexier” neo-banks, for example, of financial institutions that are offering cash account and investment products, oftentimes are very good at showing specific sides and not showing others. There is the general perception that traditional banking is more expensive.
Of course, broadly speaking, this is probably true, if you think about the infrastructure that they have to support, but today, even crypto exchanges cycle between buying crypto assets, storing those assets, selling them and especially FX ; it’s still generating significant fees. The customers aren’t probably realising it and again, it’s an exotic market. It’s not commoditized just yet, so it is normal for there to be fees that are probably higher than a security that has been around for decades. Nonetheless, it is an attention economy and I think the TradFi is also paying attention.
Managing Security Concerns After Major Exchange Hacks
It always raises eyebrows. It was obviously very unfortunate that this hack occurred. Without commenting too specifically on the matter, I think it was also managed in a way that showed maturity compared to, for example, other scandals in the past, whether it was with Terra Luna depegging, whether it was the FTX scandal. I think the market is now reacting less negatively. Of course, a bank or an asset manager with potentially trillions of assets has to go through the process of unlocking access to an asset class whilst maintaining the same level of risks standards, compliance standards and also technological security standards.
It is in some ways a positive, because it allows, or it triggers the right kind of questions and I don’t believe that there is a “trust issue” in the market because today, in 2025 – and I could argue this is true already of last year – there are institutional grade solutions which are as bullet-proof as they can realistically be.
What we do, specifically speaking to Crypto Finance, is making sure – we’re a regulated entity, so we have standards to maintain – that we always innovate without ultimately sidelining the core, which is security. Crypto introduces a complexity, the finality of transactions is obviously something very different compared to traditional capital markets. Private key management is something that is new to many, and we just make sure that we can keep that as sophisticated without over-engineering things. We stick with battle-tested technology, that’s generally where the market is also.
How Bybit Differentiated Itself from FTX
What is also fascinating is that what happened with Bybit is very different from what happened in the past. There was a lot more support from the community. Obviously, there was an issue with the technology. It was unfortunate that there was an attack in the first place, but I think the market as a whole showed this kind of concept that “we’re all in this together’. Now, something to keep in mind as well : a crypto exchange has a different starting point compared to other service providers, which are natively tailored to financial institutions.
Exchanges started early, they started mainly with the retail type of clientele and over the years, as they became more successful, had to invest and became more sophisticated, more secure, more licensed, so on and so forth, but I think that it will still take time to reach a level of security that is ultimately sufficient for some of the larger traditional financial institutions. It could also be that they will never get there, but that is why companies like Crypto Finance and some of its rivals exist in the first place ; to act as a regulated counterparty between the market and between the client.
Future Partnerships in the Pipeline
Companies like ourselves, other regulated brokers – a couple already have MiCA licences including ourselves – already have and have had for many, many years relationships with the market. This normally comes in the form of – and the reason behind this is generally tied to token availability, we need to make sure we can source liquidity from different sources, also from a purely availability or disaster recovery process, or rather business continuity.
There’s nothing necessarily new and I think what brokers like ourselves will continue doing is grow their relationship with the market in a way that doesn’t expose the clientele to the market directly. Because then the value chain does become, to an extent, weaker, let’s say it this way. What I am seeing, though, is a very rapid growth in the opposite direction, where you have crypto exchanges and other types of retail native venues which are becoming more sophisticated.
As the existing distribution channels in today’s market become more involved in the asset class, they are the ones that already possess a relationship with the end customers. So it is unlikely for the end customers to abandon these rails outside of an early majority and the maximalists which, of course, the market has now been dominated by over the past couple years. So, there is an incentive for the market to be, instead, rooting its flow to these new distribution actors, such as the banks, and use them as aggregators.
All of a sudden there’s a shift from a direct relationship between a customer – end customer, a private customer – and the exchange to the bank. It allows exchanges to continue receiving flows but it also allows the final consumer to be significantly more protected, just because of the nature of the bank that is not something in between.
What’s in Store for Q2?
Yes, there will be exciting announcements in Q2. But I wouldn’t be doing my job if I didn’t also bring attention to something that is very important, which is the partnership between Clearstream and Crypto Finance. As you know, we’re both owned by Deutsche Börse Group, and I believe this is the first time that, at scale, we have seen an international central securities depository and global custodian effectively unlock access to all of its clients with zero project cost, with Crypto Finance simply as the additional self-custodian link.
This is as far as my world is concerned. I do expect the market to be very positively reacting to, say, the new stablecoin regulation coming over in the United States. I think all eyes are going to be on the US this year. If the first few banks come in if more products get approved, all of a sudden, Europe will have to change speed. Europe is already doing a good job but I think they’ll have to step it up even more, and I’m looking forward to more competitiveness in the market.
Disclaimer
In compliance with the Trust Project guidelines, this opinion article presents the author’s perspective and may not necessarily reflect the views of BeInCrypto. BeInCrypto remains committed to transparent reporting and upholding the highest standards of journalism. Readers are advised to verify information independently and consult with a professional before making decisions based on this content. Please note that our Terms and Conditions, Privacy Policy, and Disclaimers have been updated.

Reason to trust
![]()
Strict editorial policy that focuses on accuracy, relevance, and impartiality
Created by industry experts and meticulously reviewed
The highest standards in reporting and publishing
Strict editorial policy that focuses on accuracy, relevance, and impartiality
Morbi pretium leo et nisl aliquam mollis. Quisque arcu lorem, ultricies quis pellentesque nec, ullamcorper eu odio.
Ethereum price started a fresh increase above the $1,600 zone. ETH is now up nearly 15% and might attempt a move above the $1,680 zone.
- Ethereum started a decent increase above the $1,550 and $1,600 levels.
- The price is trading above $1,550 and the 100-hourly Simple Moving Average.
- There was a break above a key bearish trend line with resistance at $1,470 on the hourly chart of ETH/USD (data feed via Kraken).
- The pair tested the $1,680 resistance zone and might correct some gains.
Ethereum Price Jumps Over 12%
Ethereum price formed a base above $1,380 and started a fresh increase, like Bitcoin. ETH gained pace for a move above the $1,450 and $1,500 resistance levels.
The bulls even pumped the price above the $1,550 zone. There was a break above a key bearish trend line with resistance at $1,470 on the hourly chart of ETH/USD. The pair even cleared the $1,620 resistance zone. A high was formed at $1,687 and the price is now consolidating gains above the 23.6% Fib retracement level of the upward move from the $1,384 swing low to the $1,687 high.
Ethereum price is now trading above $1,550 and the 100-hourly Simple Moving Average. On the upside, the price seems to be facing hurdles near the $1,650 level.

The next key resistance is near the $1,680 level. The first major resistance is near the $1,720 level. A clear move above the $1,720 resistance might send the price toward the $1,750 resistance. An upside break above the $1,750 resistance might call for more gains in the coming sessions. In the stated case, Ether could rise toward the $1,850 resistance zone or even $1,880 in the near term.
Are Dips Limited In ETH?
If Ethereum fails to clear the $1,650 resistance, it could start a downside correction. Initial support on the downside is near the $1,615 level. The first major support sits near the $1,580 zone.
A clear move below the $1,580 support might push the price toward the $1,535 support and the 50% Fib retracement level of the upward move from the $1,384 swing low to the $1,687 high. Any more losses might send the price toward the $1,480 support level in the near term. The next key support sits at $1,420.
Technical Indicators
Hourly MACD – The MACD for ETH/USD is gaining momentum in the bullish zone.
Hourly RSI – The RSI for ETH/USD is now above the 50 zone.
Major Support Level – $1,535
Major Resistance Level – $1,650

Solana (SOL) has experienced significant volatility recently, with a marked decline following its failure to breach the $150 mark.
Over the last few days, Solana has struggled to break through certain resistance levels that have been affected by broader market trends. However, investor optimism appears to be driving recent price movements as SOL nears $120.
Solana Gains Support
One of the indicators showing promise for Solana’s recovery is its velocity, which measures the pace at which tokens are being circulated. The velocity has reached a monthly high, signaling that the transaction of supply is accelerating.
Amidst recovering price, there’s a noticeable increase in the velocity at which tokens are being transacted, highlighting greater demand. Velocity and price tend to move in tandem. Typically, when both price and velocity rise together, it’s considered a bullish signal — a trend currently seen with Solana.

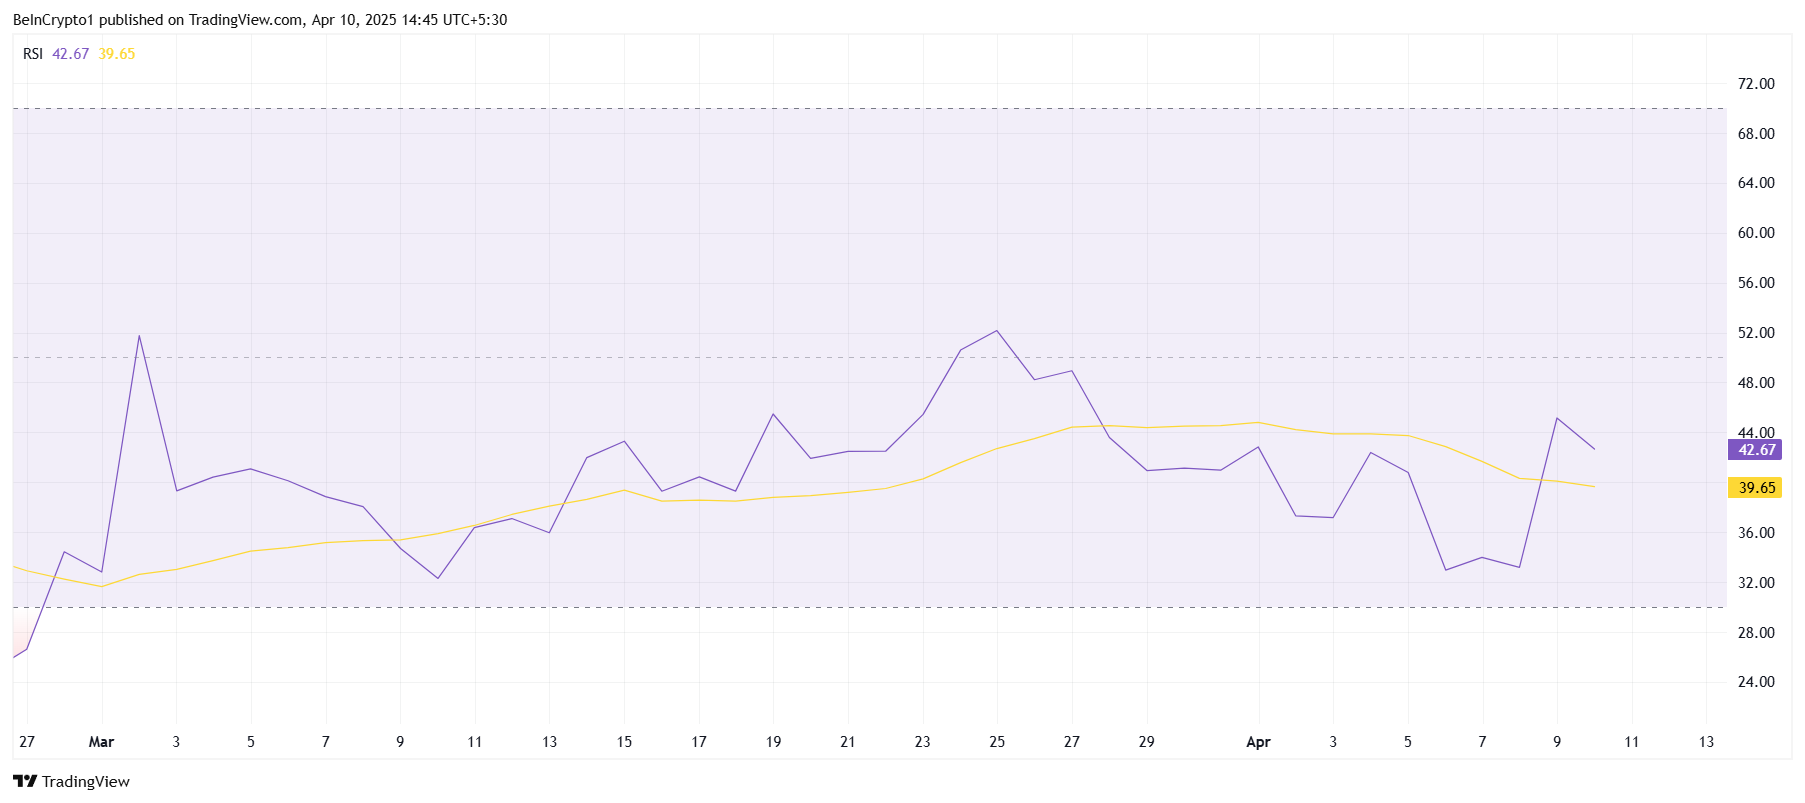
However, despite the favorable signs from the velocity, Solana’s macro momentum remains relatively weak. The Relative Strength Index (RSI) is still stuck in the bearish zone, under the neutral 50.0 mark.
While the broader market has seen some rallies, Solana’s RSI indicates a lack of significant buying momentum. This suggests that while some positive movement is occurring, broader macroeconomic factors may still be playing a limiting role.
The persistent bearish sentiment reflected in the RSI implies that Solana’s recovery may face continued challenges. Despite occasional price bounces, the altcoin has not yet experienced enough momentum to break free from the bearish pressure.
SOL Price Attempts Recovery
Solana’s price has risen by 8.2% in the past 24 hours, trading at $114. While it is showing signs of recovery, the altcoin remains under the key psychological price of $120. Beyond it lies a crucial resistance of $123, which has proven challenging in recent days.
If the bullish momentum continues, Solana could rise past $120 and aim for $123. Securing it as support would likely lead to further gains, pushing Solana toward the $135 mark. Investor confidence and continued supply distribution could support this upward movement.
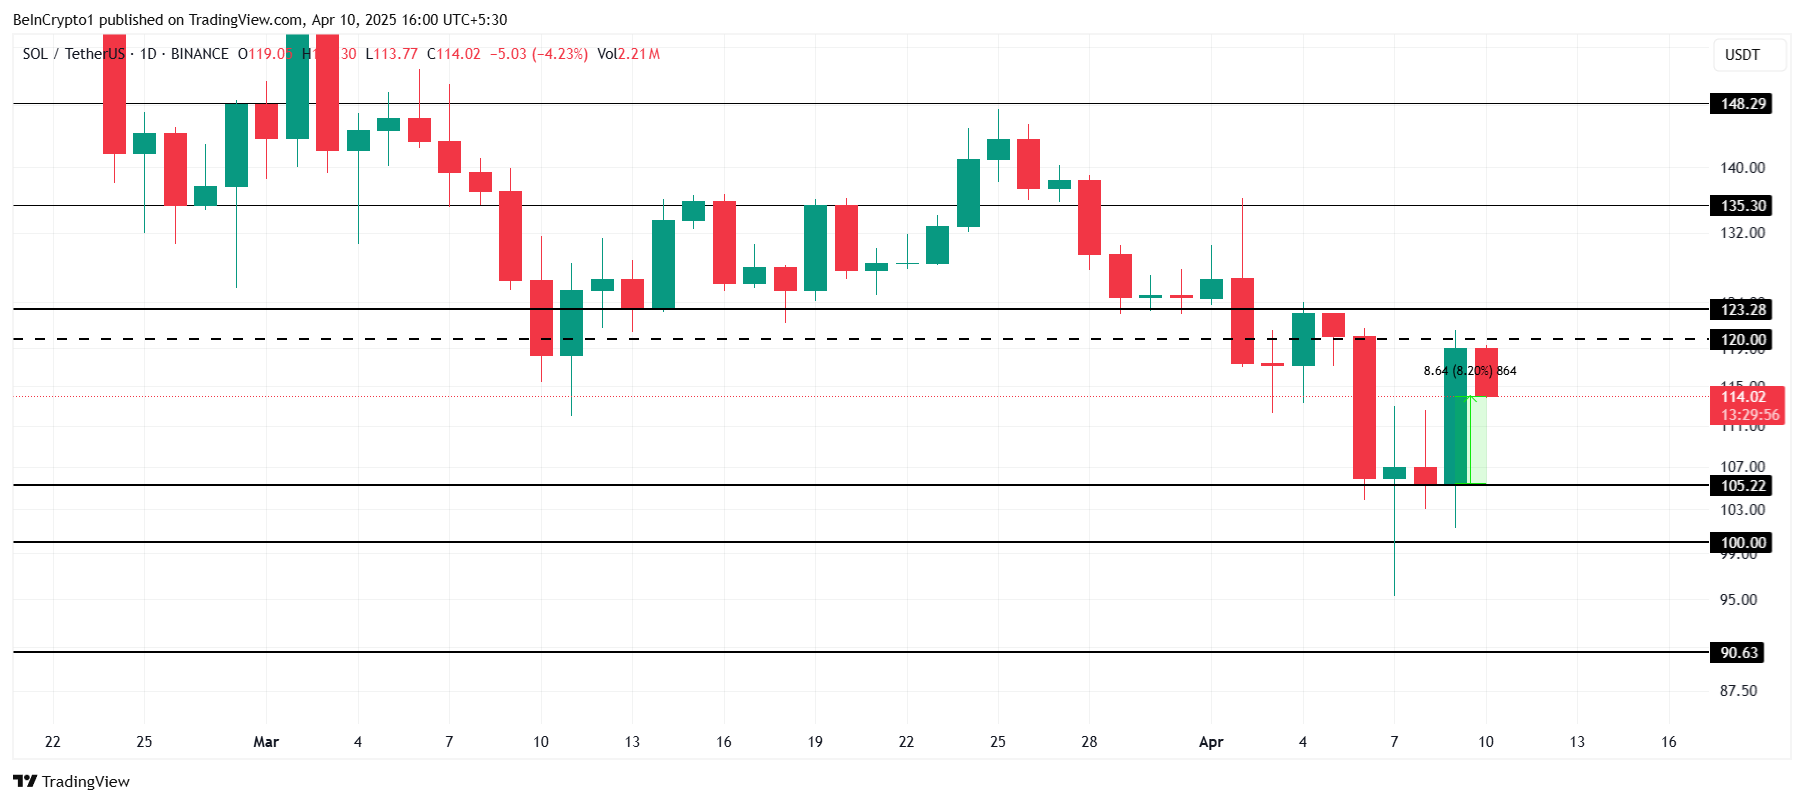
However, if Solana fails to breach the $123 resistance, the price may retreat toward $105 or even lower. A drop below $105 could signal a deeper decline, with the altcoin potentially heading toward the $100 mark. This would invalidate the recent bullish outlook, extending the correction phase for Solana.
Disclaimer
In line with the Trust Project guidelines, this price analysis article is for informational purposes only and should not be considered financial or investment advice. BeInCrypto is committed to accurate, unbiased reporting, but market conditions are subject to change without notice. Always conduct your own research and consult with a professional before making any financial decisions. Please note that our Terms and Conditions, Privacy Policy, and Disclaimers have been updated.
Dogecoin (DOGE) Reclaims Previous Breakdown, Will This Mark The Bottom?

Fuser on How Crypto Regulation in Europe is Finally Catching Up

Florida Bitcoin Reserve Bill Passes House With Zero Votes Against

Cash App’s Block Inc Settles for $40 Million Over AML Failures For Crypto Platform

Trump’s Surprise Move Sends ETH Up 15%

Ethereum’s Controversial Developer Freed Before Full Sentence

2.52 Million Altcoins Are Ruining Crypto’s Future

Animoca Brands Valuation Tanks 75% In Two Years, Here’s Why

Crypto exchange BingX hacked for $43 million

Are The Big Players Losing Interest?

Hong Kong’s Securities Association Tips Authorities On Crypto Self-Regulation

Coinbase cbBTC Set to go Live on Solana
2.52 Million Altcoins Are Ruining Crypto’s Future
Animoca Brands Valuation Tanks 75% In Two Years, Here’s Why
Crypto exchange BingX hacked for $43 million
Are The Big Players Losing Interest?
Hong Kong’s Securities Association Tips Authorities On Crypto Self-Regulation
Coinbase cbBTC Set to go Live on Solana
-
 Bitcoin18 hours ago
MicroStrategy Bitcoin Dump Rumors Circulate After SEC Filing
-

 Altcoin22 hours ago
NFT Drama Ends For Shaquille O’Neal With Hefty $11 Million Settlement
-
Altcoin21 hours ago
Is Dogecoin Price Levels About To Bounce Back?
-
 Market18 hours ago
XRP Primed for a Comeback as Key Technical Signal Hints at Explosive Move
-

 Market20 hours ago
FBI Ran Dark Web Money Laundering to Track Crypto Criminals
-

 Market14 hours ago
Bitcoin Rallies After Trump Pauses Tariff—Crypto Markets Cheer the Move
-

 Market19 hours ago
SEC Approves Ethereum ETF Options Trading After Delays
-
 Altcoin23 hours ago
Ethereum Price Signals Strong Recovery After Forming Historical Pattern From 2020