Market
Which Ones Are the Top 3?

Several altcoins are trending today, despite prices being lower than at the week’s start. While the reasons may seem unclear to some, CoinGecko has identified the top three trending altcoins as (WELSH), Turbo (TURBO), and MAGA Hat (MAGA).
This analysis by BeInCrypto explores the factors behind the growing attention these altcoins are attracting, offering insights into their market movements and underlying trends.
Welshcorgicoin (WELSH) Leads the Trending Altcoins List
WELSH is trending primarily due to its impressive price action. Over the past 30 days, the altcoin has surged by 96%, catching the attention of investors.
Although it remains relatively unknown in the broader market, WELSH has carved out a niche for itself. The project claimed it is the first dog-themed Bitcoin meme coin secured on the Stacks network. This unique positioning has contributed to its rising popularity and price momentum.
Currently, WELSH’s price is $0.0033, and its self-reported market cap is $31.55 million. The altcoin experienced a significant rally, climbing by 110% between September 18 and Monday, September 14. However, in the last 24 hours, it has given back 2% of those gains.
Read more: Top 9 Safest Crypto Exchanges in 2024
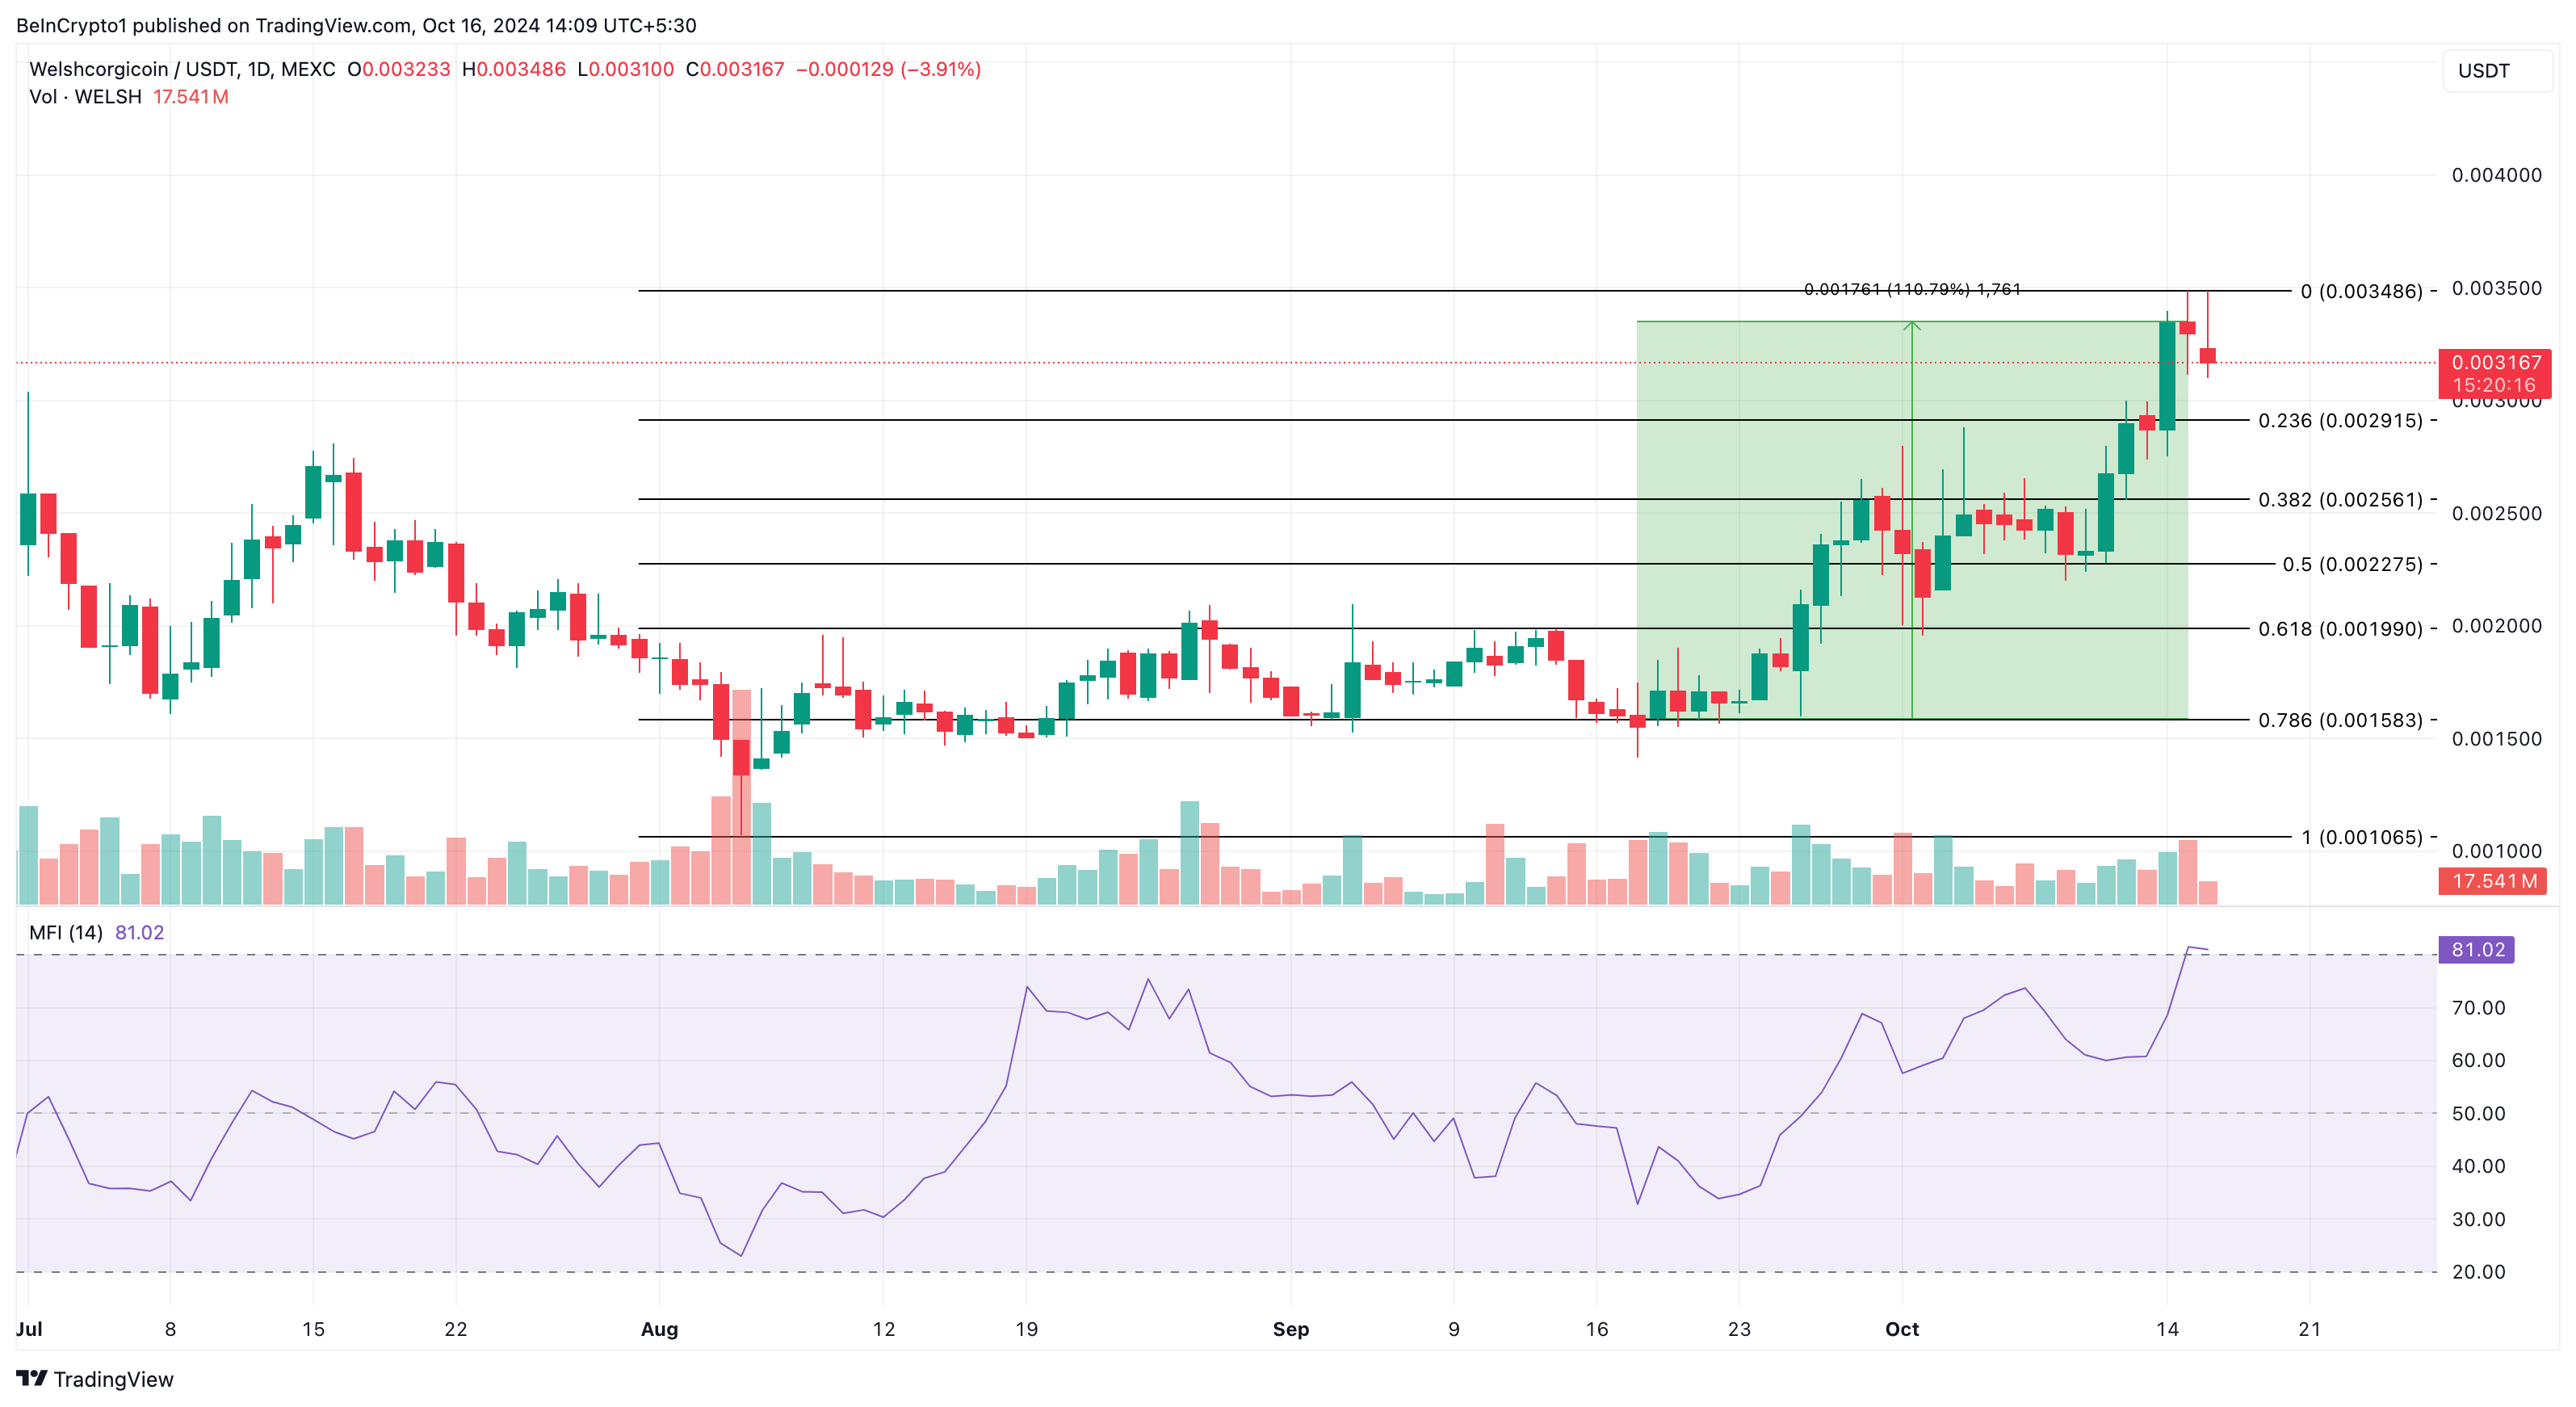
One possible reason for this recent drawdown is the Money Flow Index (MFI). The MFI is a technical indicator that measures buying and selling pressure. Beyond that, it also indicates whether an asset is overbought or oversold.
When the Money Flow Index (MFI) is below 20.00, the asset is considered oversold. Readings above 80.00 indicate an overbought condition. Given the current MFI readings, WELSH could be approaching an overbought territory. This suggests the possibility of a short-term decline. If this trend continues, the price might drop to $0.0026 in the near term.
On the other hand, if buying pressure picks up and profit-taking eases, the cryptocurrency could see a price rally beyond the $0.0035 mark, potentially resuming its upward momentum.
Turbo (TURBO) Has to Thank Binance
TURBO, which brands itself as “the first meme coin created by AI,” is gaining attention as one of the top trending altcoins today. The surge in interest comes after Binance announced the expansion of trading pairs for TURBO on October 15, fueling speculation about its potential in the market.
However, TURBO’s price movement also contributes to its trending status, with a 47.45% increase over the past week. Currently trading at $0.011, the cryptocurrency has seen an 8% decline in the last 24 hours.
This pullback may be attributed to increasing selling pressure. Spot On Chain, in a post on X earlier today, revealed that a wallet linked to the project deposited 810 million tokens to Binance and OKX exchanges. While this move has fueled speculation, the platform indicated that such transfers appear to be a regular occurrence whenever TURBO reaches new price peaks.
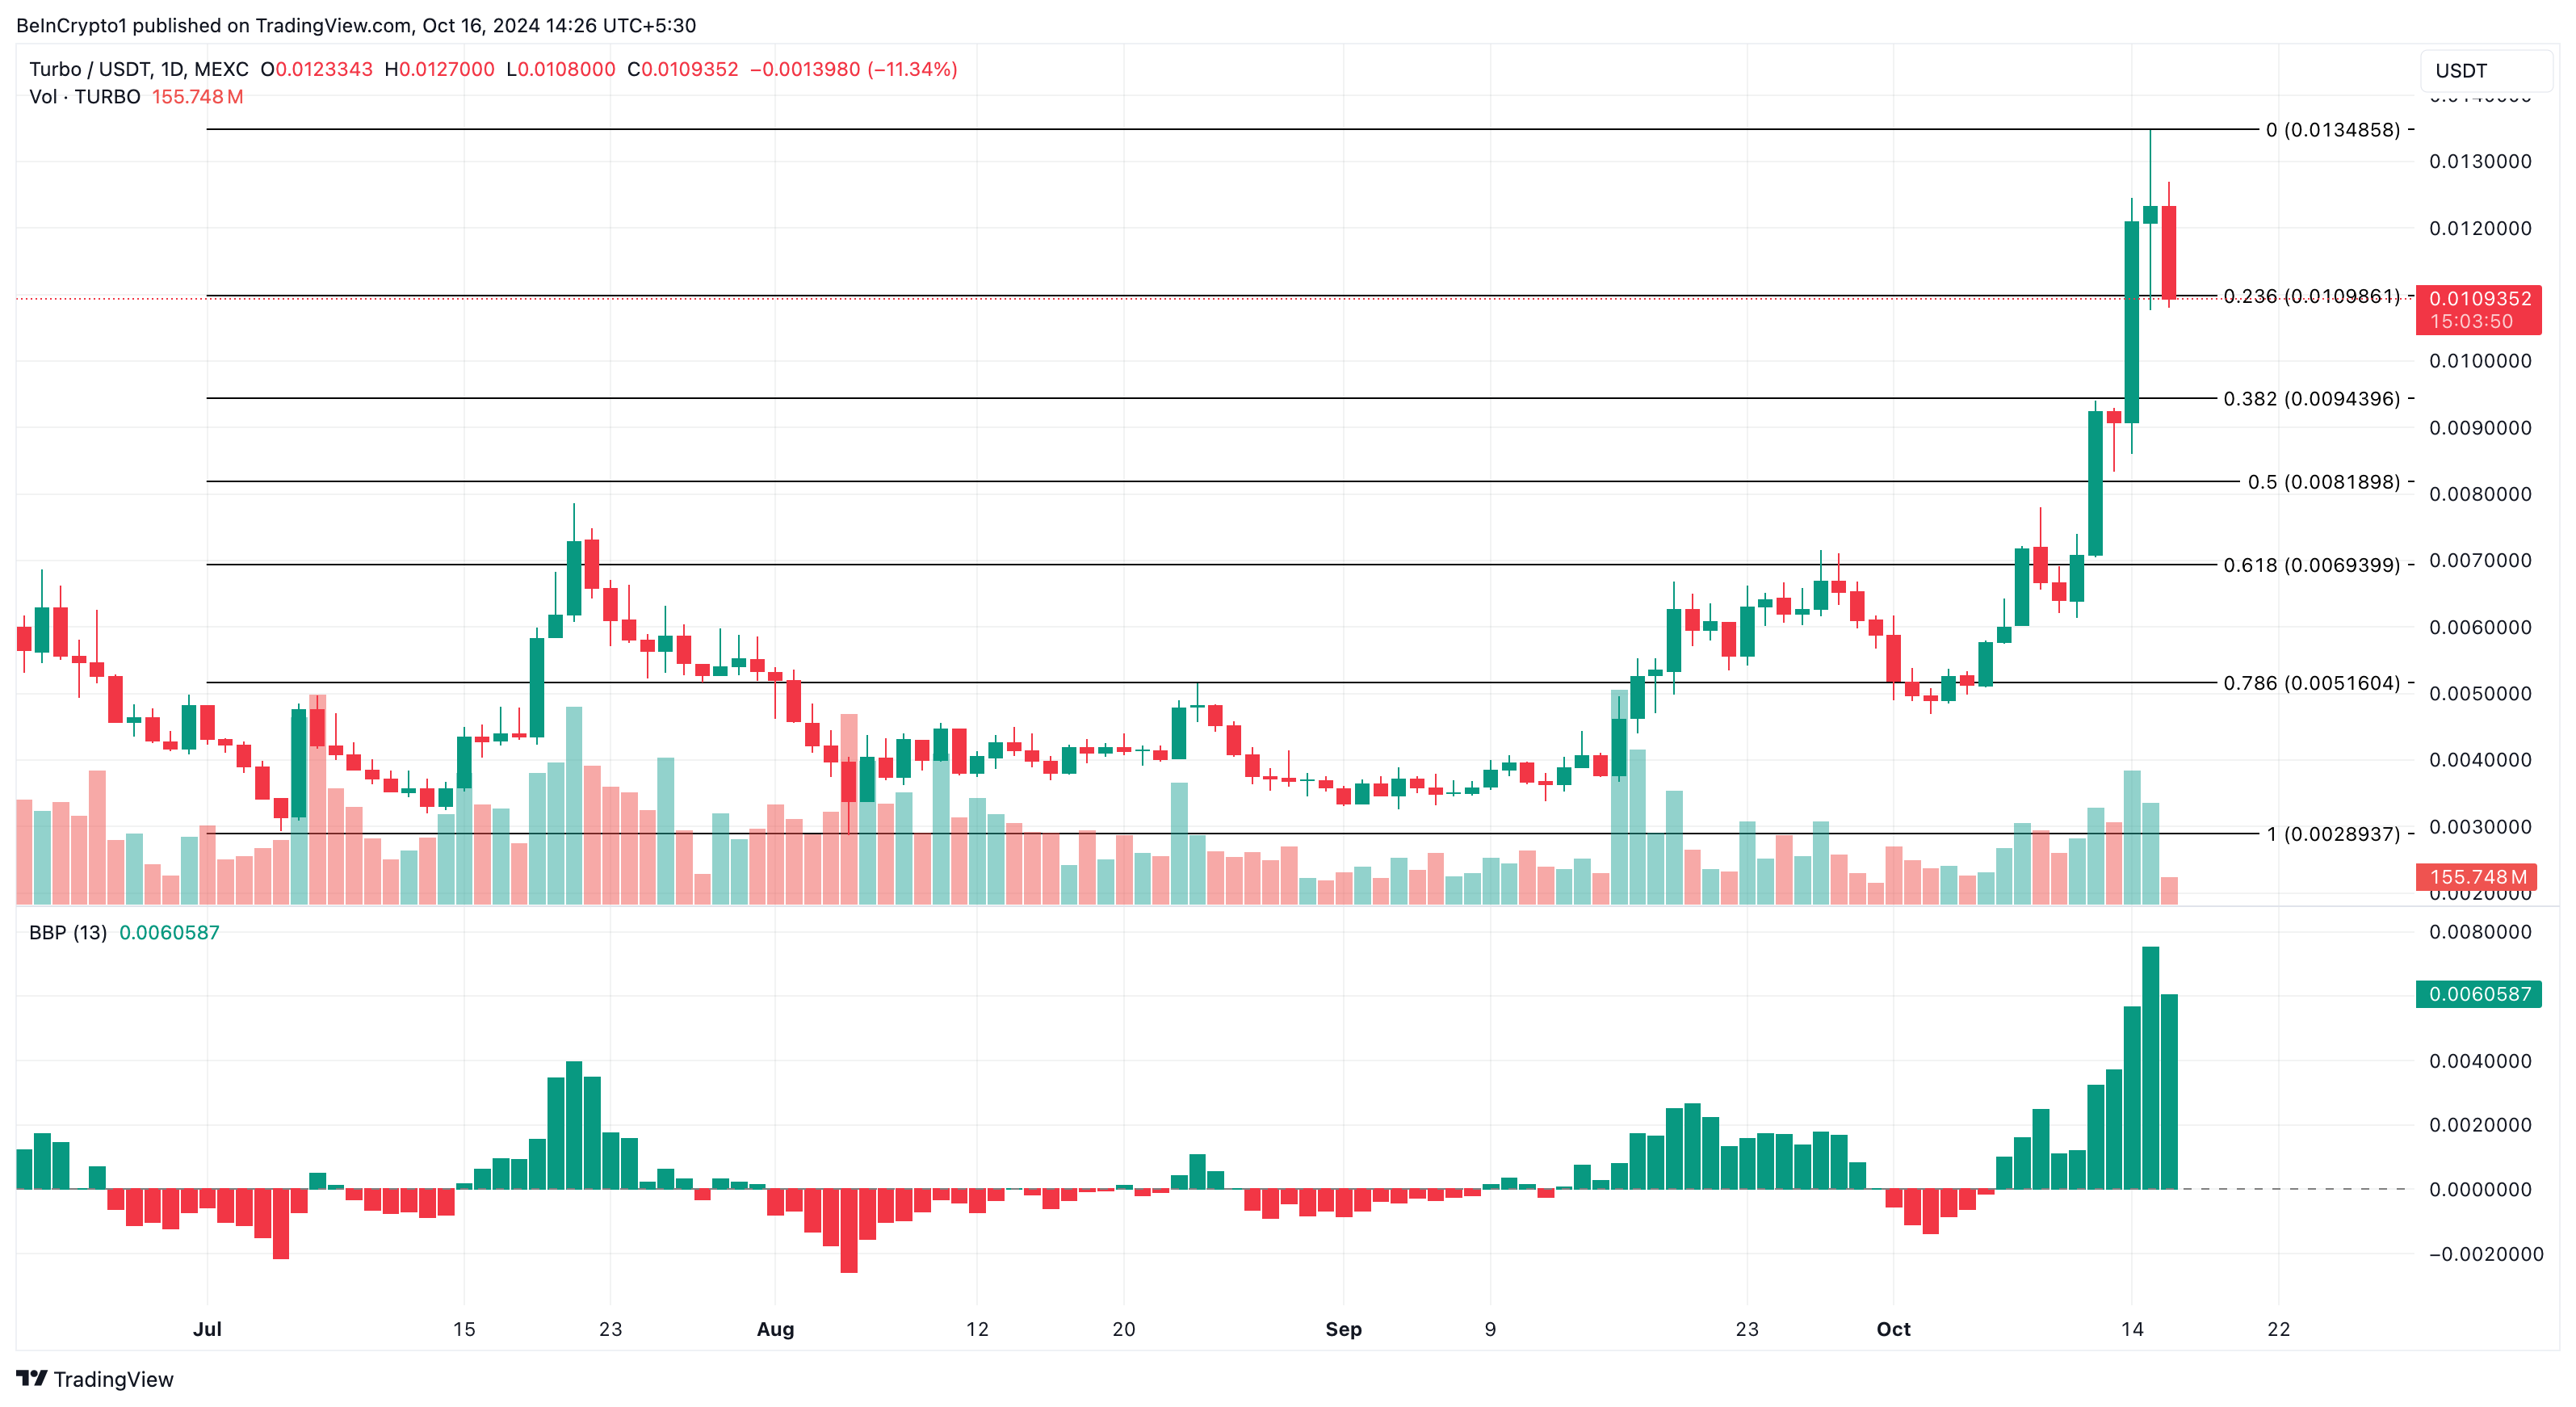
From a technical perspective, the Bull Bear Power (BBP) shows that bulls appear determined to send the altcoin back higher. This is because the BBP reading is green, showing the rising strength of buyers in the market.
If sustained, TURBO’s price could climb to $0.013. However, if bears overpower bullish power, this prediction might be invalidated. Instead, the altcoin’s price might decline to $0.0069.
MAGA Hat (MAGA) Gets More Attention as US Elections Near
The upcoming US election and the possibility of a Trump victory have made MAGA one of the top-trending cryptocurrencies today. With the election just 20 days away and Trump leading in the polls, MAGA and related altcoins have garnered significant attention.
However, MAGA’s price has dropped 17% in the past seven days, currently trading at $0.00013. It is now hovering near the 20-day Exponential Moving Average (EMA), which often signals a bearish trend when breached. If MAGA’s price falls below this key support level, the next target could be $0.00010, indicating a deeper correction and further bearish momentum.
Conversely, if MAGA’s price holds above the 20 EMA, which is still above the 50 EMA, the downward trend might reverse. In that case, MAGA could climb to $0.00019, signaling potential recovery.
Read more: Which Are the Best Altcoins To Invest in October 2024?
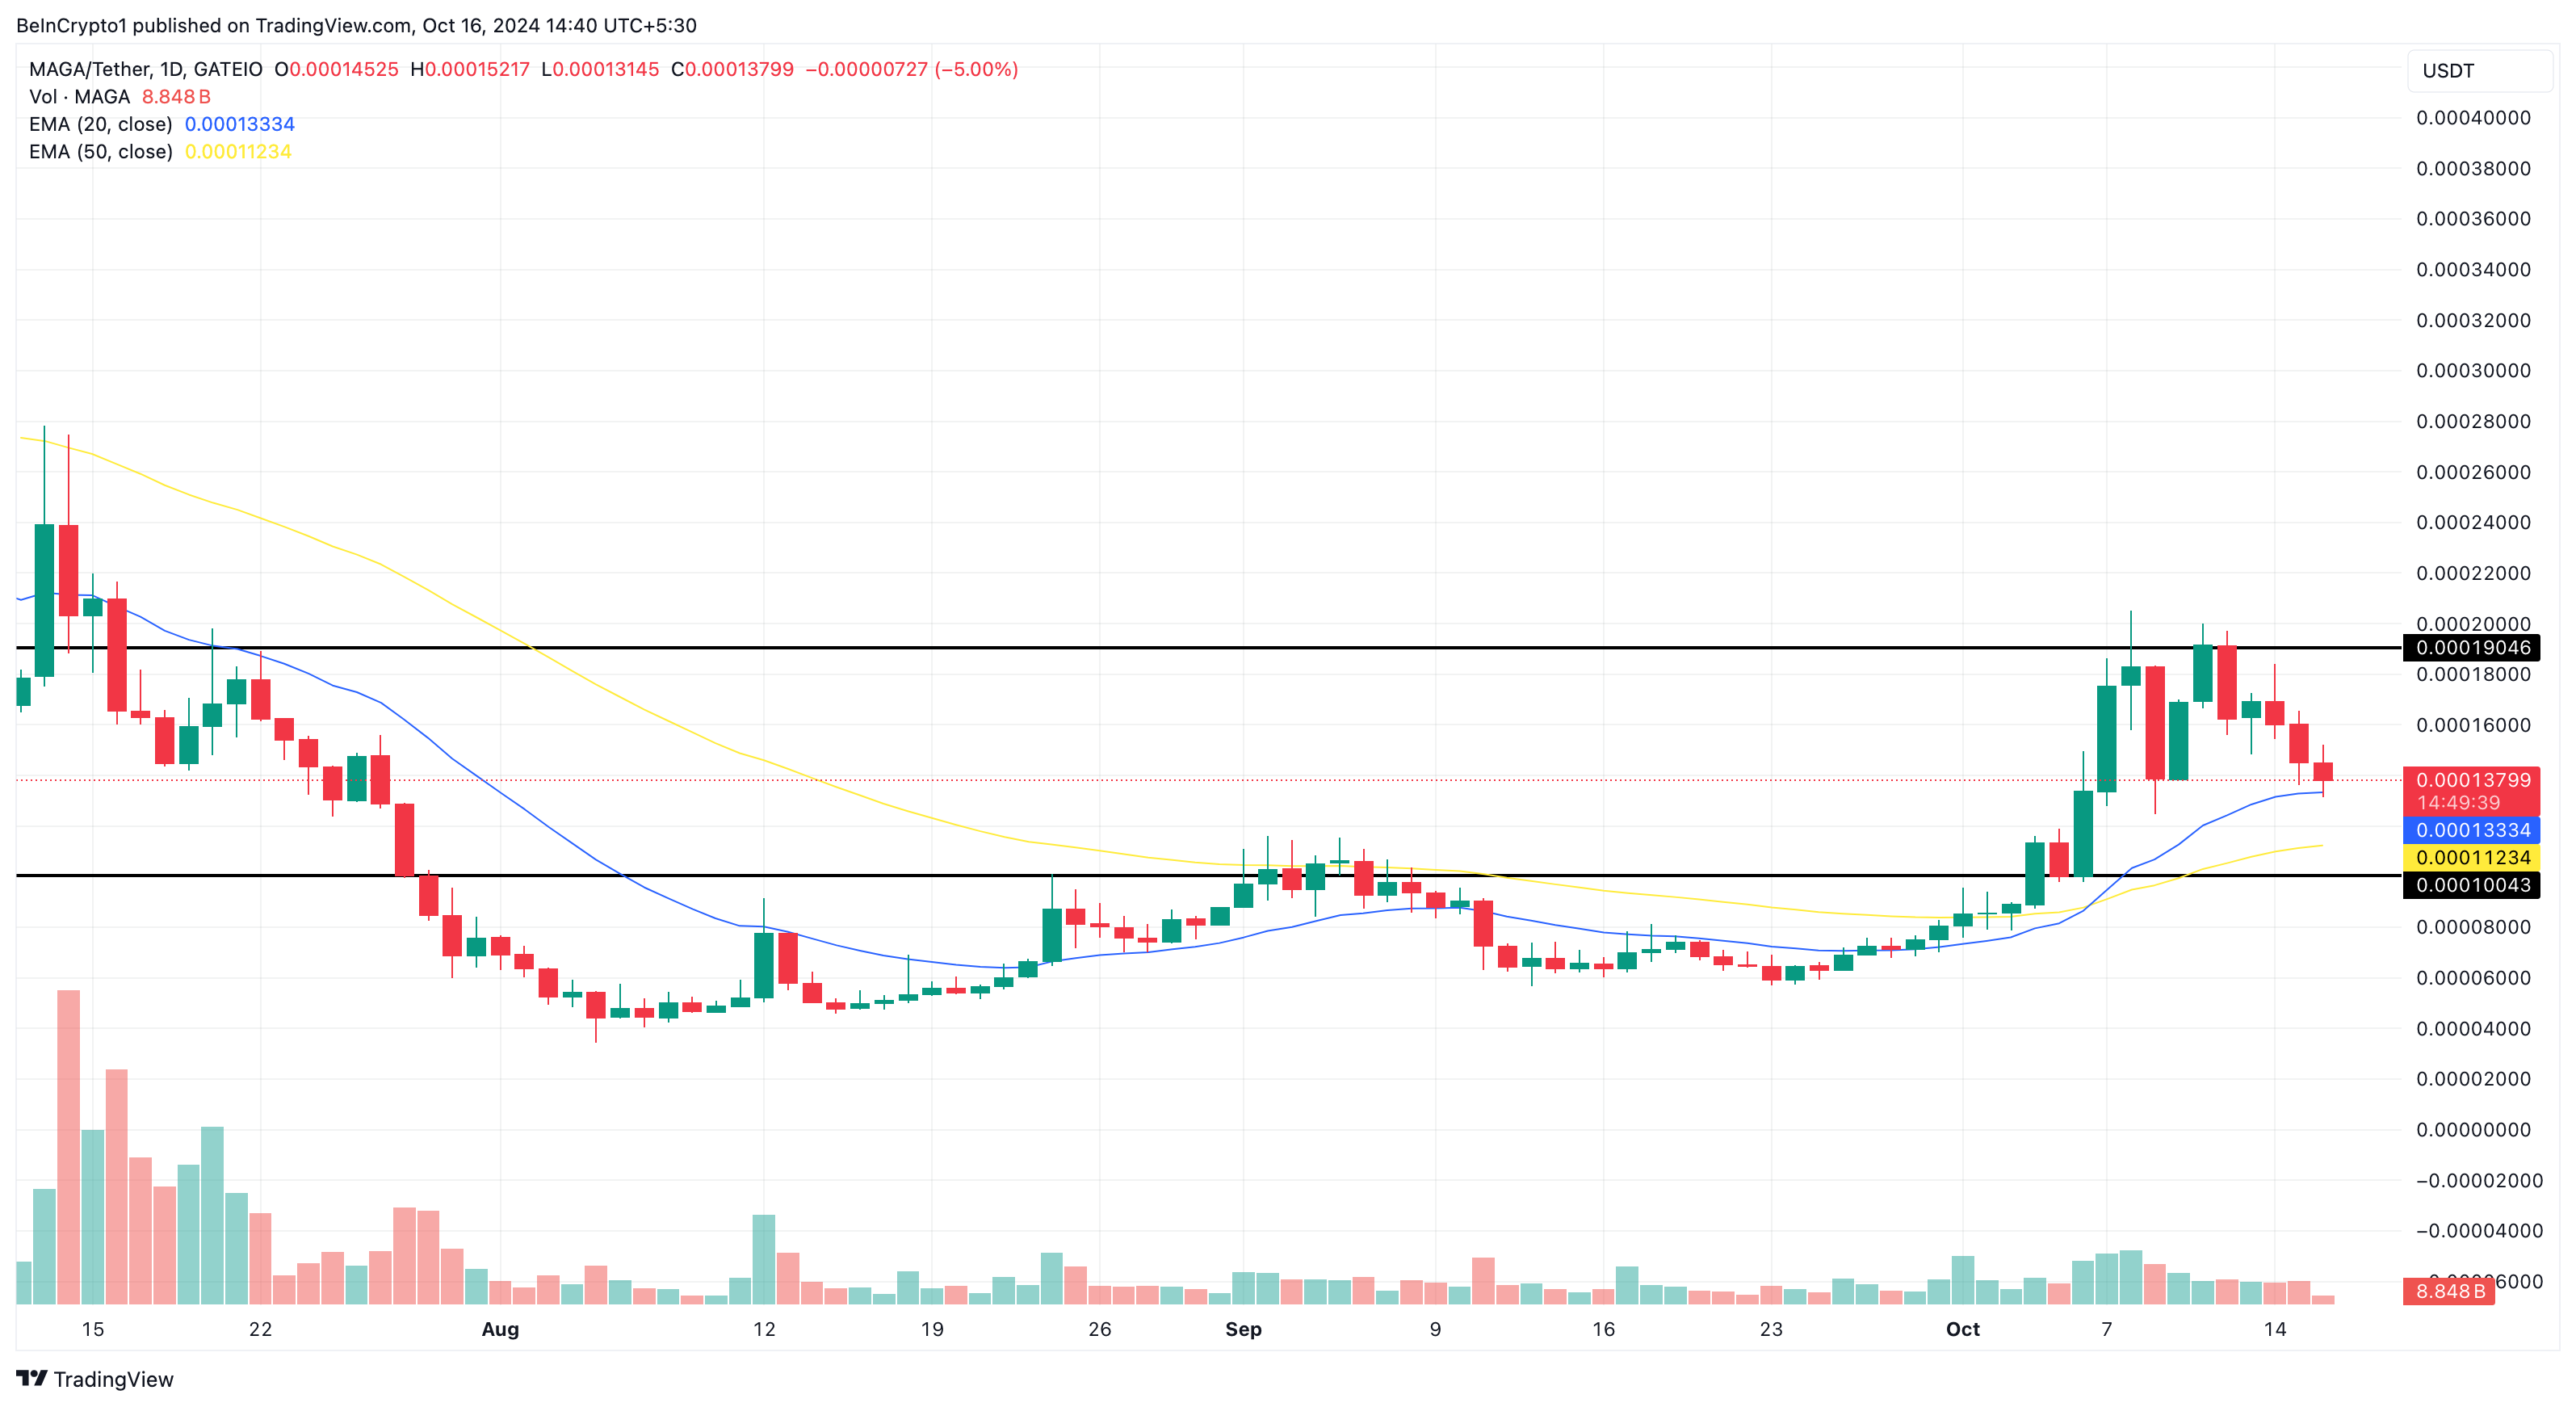
On the other hand, if the 20 EMA remains above the 50 EMA (yellow) and MAGA’s price stays above both indicators, the forecast might not come to pass. Instead, the price might climb to $0.00019.
Disclaimer
In line with the Trust Project guidelines, this price analysis article is for informational purposes only and should not be considered financial or investment advice. BeInCrypto is committed to accurate, unbiased reporting, but market conditions are subject to change without notice. Always conduct your own research and consult with a professional before making any financial decisions. Please note that our Terms and Conditions, Privacy Policy, and Disclaimers have been updated.
Market
Cardano Enters Opportunity Zone, But ADA Holders Are Skeptical

Cardano (ADA) has faced a lack of growth in recent weeks despite initially grabbing investors’ attention during a brief rally.
While ADA’s price action showed some promise, the momentum quickly faded, and now, despite entering an opportunity zone, ADA holders remain skeptical, and investor participation has dropped significantly.
Cardano Investors Need To Step Up
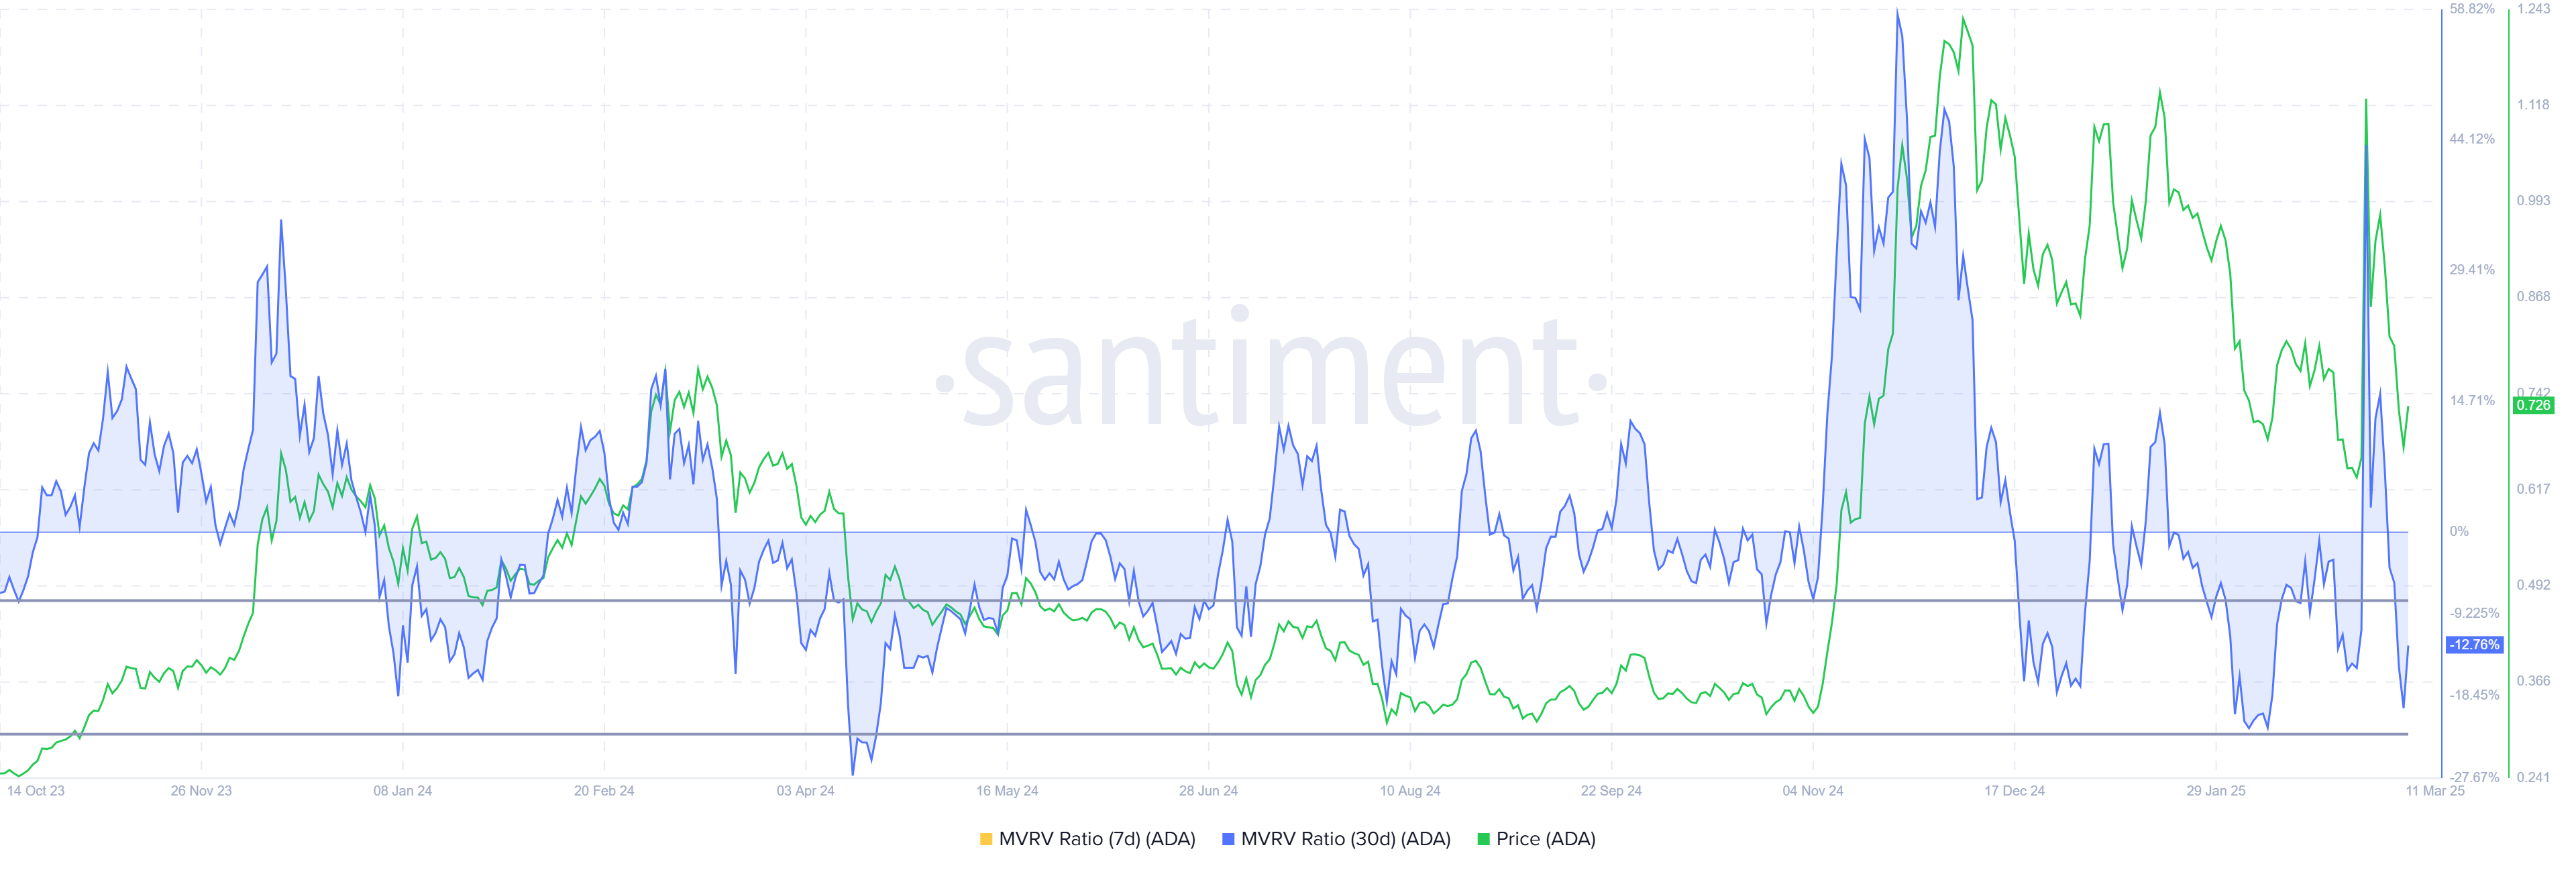
The Market Value to Realized Value (MVRV) Ratio for Cardano shows that ADA holders who purchased within the last month are currently facing 12% losses. This decline has brought ADA into the opportunity zone, which lies between -8% and -22%. Historically, this zone has been a reversal point for ADA, presenting a potential for recovery if investors decide to accumulate at low prices.
However, despite being in the opportunity zone, there is little indication that ADA holders are acting on this opportunity. The skepticism among investors, driven by the altcoin’s failure to sustain recent rallies, has made it difficult for ADA to capitalize on this potential recovery window.
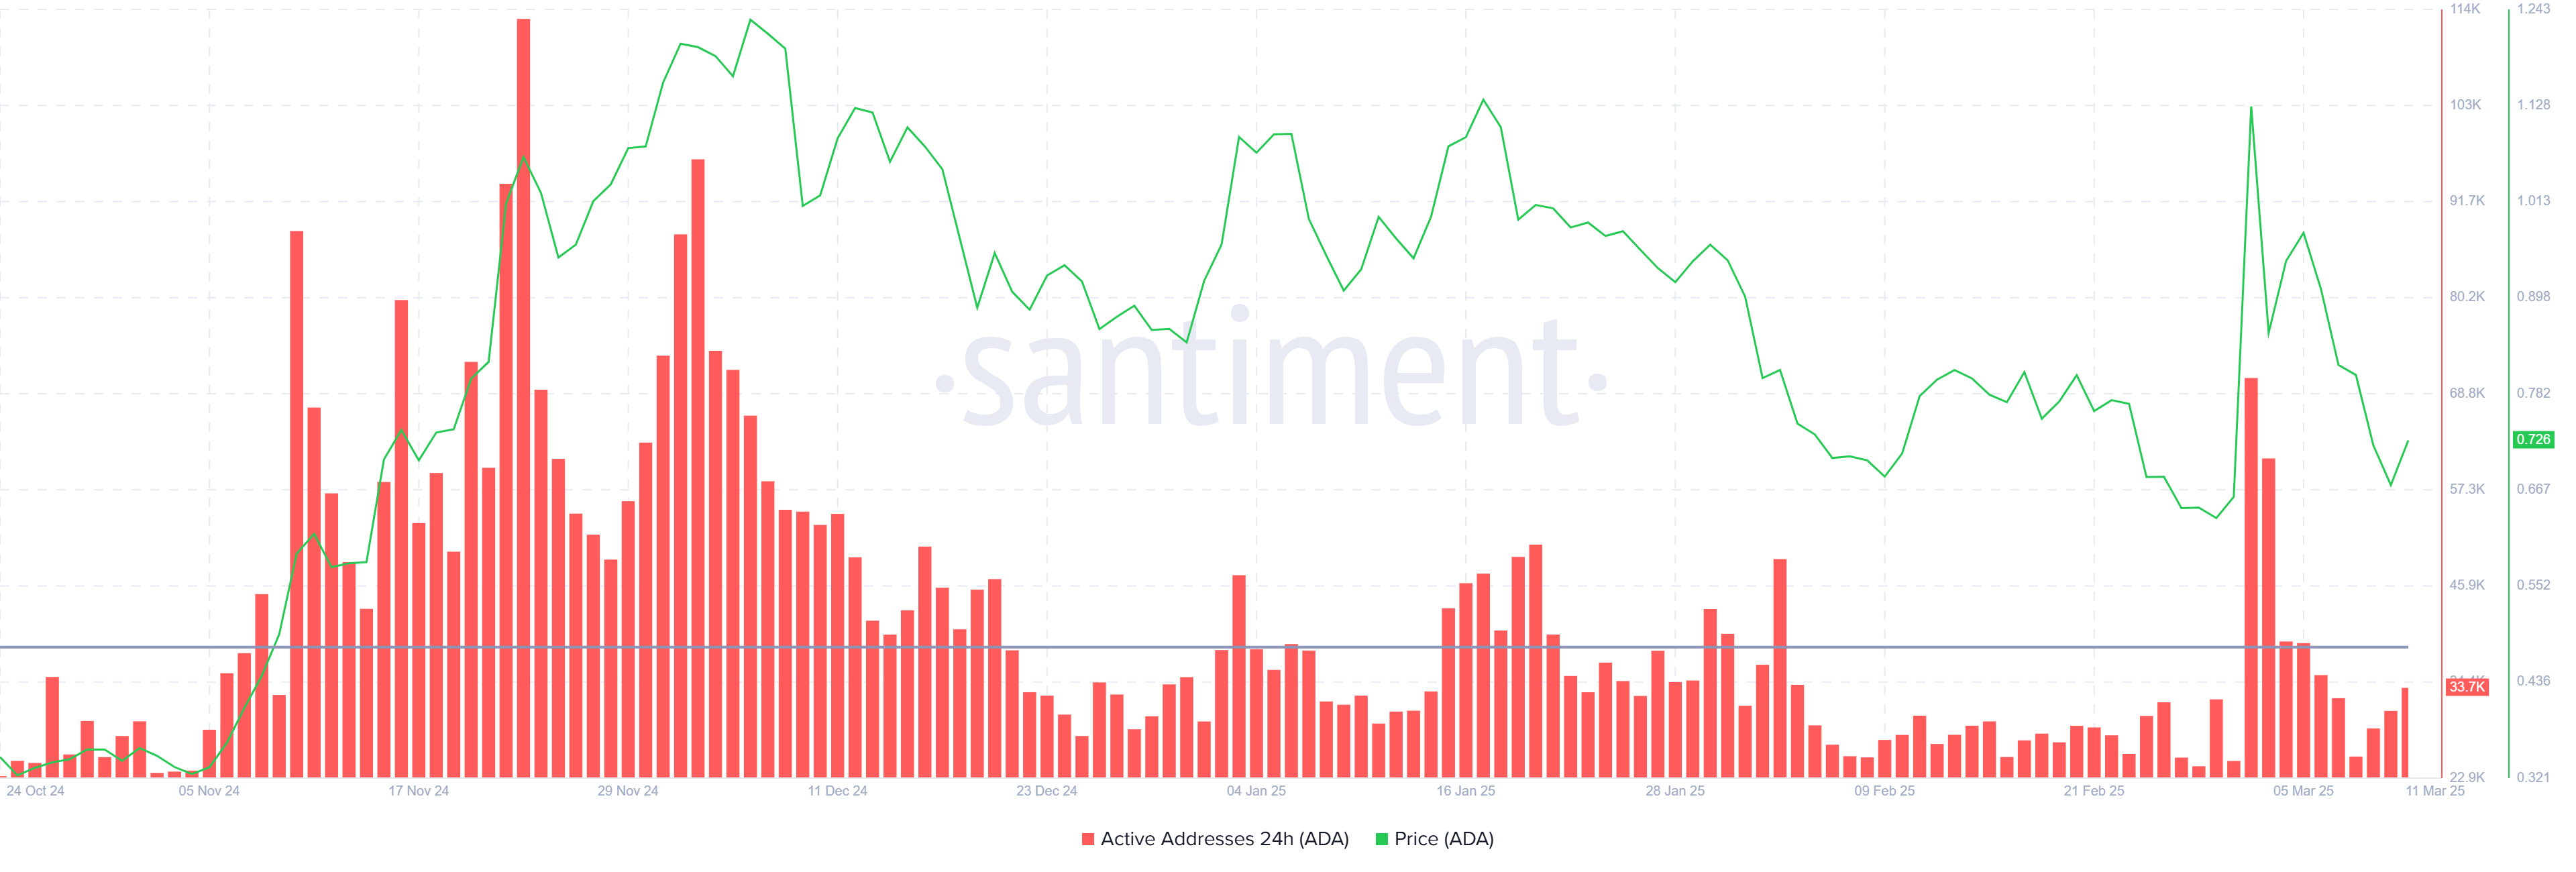
The overall macro momentum for Cardano has also been affected by diminishing participation. Active addresses on the network are currently below the average threshold of 38,600, with the count sitting at 33,700. This decrease in active addresses indicates a decline in investor participation and confidence.
During ADA’s brief rally at the beginning of the month, the number of active addresses surged, but the failure to sustain that momentum has caused skepticism to take over. With investor participation dwindling, ADA’s price could face further challenges if interest in the asset continues to wane.
ADA Price Is Facing Recovery Challenge
Cardano’s price is currently at $0.72 after falling 31% in the last few days. This decline followed ADA’s failure to breach the $0.99 level and flip it into support. The inability to reclaim this critical resistance level has led to further losses, and ADA is now struggling to recover.
As ADA moves farther away from the $1.00 price point, it continues to face challenges in terms of both investor confidence and broader market conditions. At this point, ADA is likely to experience consolidation above the $0.70 level, though a further drop to $0.62 remains a possibility, especially if investor sentiment remains weak.
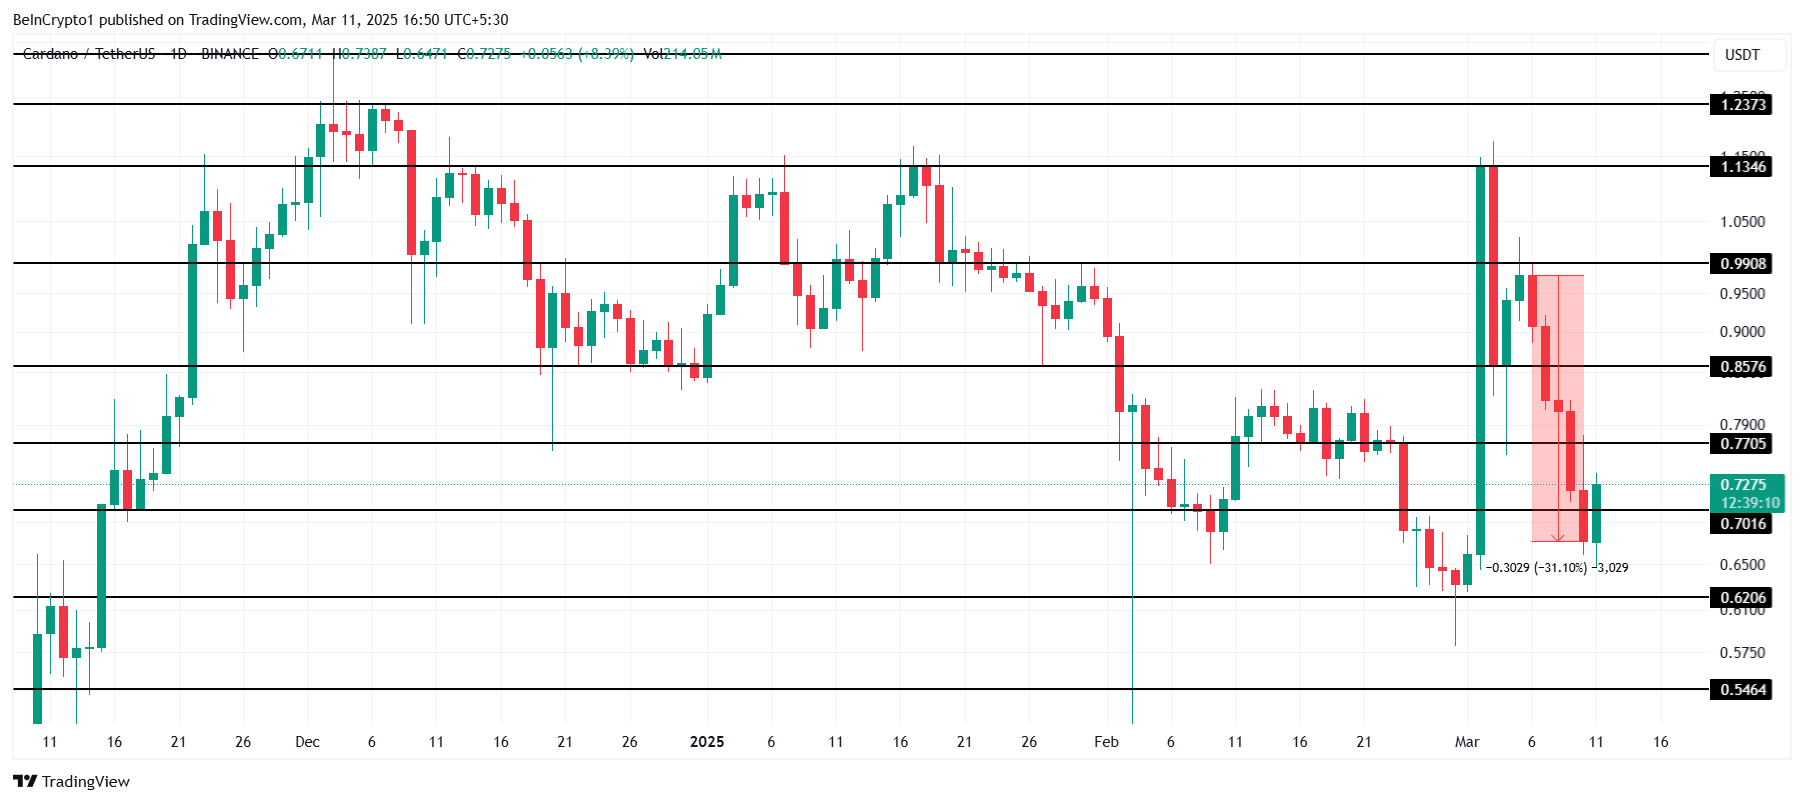
However, if ADA manages to flip $0.77 into support, it could signal the beginning of a recovery. Successfully holding above this level could push the price back toward $0.85 or higher, invalidating the current bearish outlook. This would require renewed investor interest and a favorable shift in market conditions to support ADA’s upward movement.
Disclaimer
In line with the Trust Project guidelines, this price analysis article is for informational purposes only and should not be considered financial or investment advice. BeInCrypto is committed to accurate, unbiased reporting, but market conditions are subject to change without notice. Always conduct your own research and consult with a professional before making any financial decisions. Please note that our Terms and Conditions, Privacy Policy, and Disclaimers have been updated.
Market
Ripple CTO and Robert Kiyosaki Advise Buying Bitcoin

Despite market downturns, figures like Ripple CTO David Schwartz and Robert Kiyosaki advise the community to buy Bitcoin. The market is historically cyclical, and BTC has always recovered in the long term.
There are a few more concrete factors in play, like the increasing M2 money supply providing fresh liquidity. Michael Saylor plans to spend $21 billion on Bitcoin, and he isn’t alone in bullish sentiment.
Should Bitcoin Supporters Buy the Dip?
Bitcoin’s price isn’t doing well right now, and the crypto community is scrambling. Several bearish signs have been looming, and President Trump’s long-awaited Crypto Summit didn’t do much to alleviate fears.
This week, the market opened with a huge correction, but some commentators like Ripple CTO David Schwartz think it’s a great time to buy Bitcoin.
“Looks like a buying opportunity to me. There are two kinds of Bitcoiners in the world, those that care about the answer to that question [why would I buy Bitcoin] and those who don’t. I’m 100% okay with both kinds,” Schwartz claimed on social media.
In fairness, Schwartz isn’t alone in saying people should buy Bitcoin right now. Michael Saylor, who directed his company to be one of the largest BTC holders, announced yesterday that Strategy would raise $21 billion in stock sales.
These sales would fund further BTC acquisitions. Why are these figures predicting a short-term crash?
This morning, a few new bearish indicators have opened up. Miners are selling off their holdings, and Trump’s comments about a potential recession have caused further market distress.
On the surface, it seems like there’s nothing but trouble on the horizon.

However, there are a few factors that make this potentially a good moment to play the long game. Arthur Hayes has been predicting a short crash that will rebound to a new all-time high before 2026.
Additionally, the M2 money supply has been recovering, which will enable additional liquidity to buy Bitcoin. Even if a crash happens, it may be temporary:
“The everything bubble is bursting. I am afraid this crash may be the biggest in history. It is normal to be disturbed and fearful. Just do not panic. In 2008, I waited, letting the panic and dust settle and then started to look for great real assets on sale at deep discounts. This crash the world is going through, just might be the opportunity of your life time,” claimed Robert Kiyosaki.
Author and investor Kiyosaki has also been predicting a market dip for many weeks, saying that it will be a momentary setback. Bitcoin will recover, and this will be a great time to buy it at a discount.
Ultimately, no one knows exactly where the market is going. Based on its long history, however, Bitcoin always bounces back. It’s well known that crypto has been through far, far worse.
Disclaimer
In adherence to the Trust Project guidelines, BeInCrypto is committed to unbiased, transparent reporting. This news article aims to provide accurate, timely information. However, readers are advised to verify facts independently and consult with a professional before making any decisions based on this content. Please note that our Terms and Conditions, Privacy Policy, and Disclaimers have been updated.
Market
What It Means for Ethereum’s Reputation

The recent $1.5 billion Bybit hack turned North Korean Lazarus Group into one of the top 15 Ethereum holders in the world. The breach sent shockwaves through the crypto space, alerting users who previously thought Ethereum was among the safest and most decentralized networks.
In a conversation with BeInCrypto, representatives from Holonym, Cartesi, and Komodo Platform discussed the implications of this breach, steps to curb similar situations in the future, and how public trust in Ethereum can be restored.
A Different Kind of Breach
The Bybit hack shook the crypto community not just because of the quantity of funds stolen but also because of the nature of the breach.
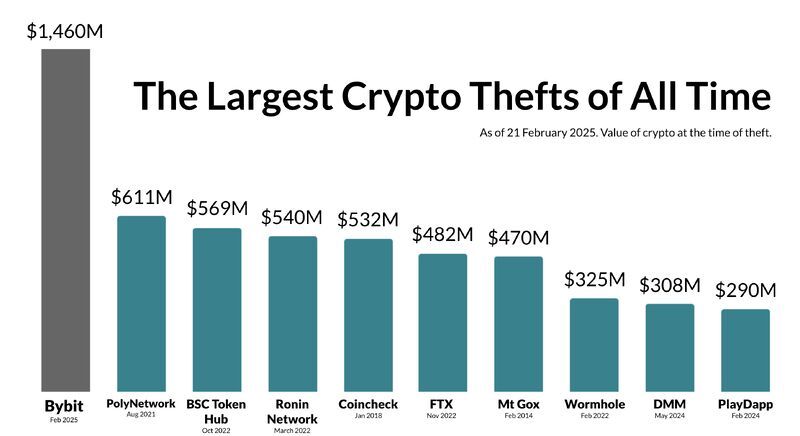
While other crypto exchange breaches, like the 2014 Mt. Gox episode or the 2018 Coincheck hack, involved private keys or direct compromises of exchange wallets, Bybit’s situation was different.
Rather than stealing private keys, the hackers manipulated the transaction signing process, indicating that it was an infrastructure-level attack. The transaction signing process was targeted instead of the asset storage itself.
Forensic analysis of the Bybit hack traced the breach to Safe Wallet, a multi-signature wallet infrastructure provided by a third party. Safe Wallet uses smart contracts and cloud-stored JavaScript files on AWS S3 to process and secure transactions.
Hackers could secretly modify transactions by injecting malicious JavaScript into Safe Wallet’s AWS S3 storage. Therefore, although Bybit’s system was not directly hacked, the hackers altered the destination of transfers that Bybit had approved.
This detail exposed a serious security flaw. Third-party integrations become weak points even if an exchange locks down its systems.
Lazarus Group Among Ethereum’s Top Holders
Following the monumental hack, North Korea is among the top 15 largest Ethereum holders.
According to on-chain data, Gemini, which previously held the 15th position, holds 369,498 ETH in its Ethereum wallet. Since Bybit hackers stole over 401,000 ETH, they now overtook Gemini in ownership.

The fact that an infamous group like Lazarus, responsible for several high-profile hacks in the crypto sector, now holds such an important amount of Ether raises several trust issues. While initial speculation pointed toward a weakness in Ethereum’s decentralized nature, Nanak Nihal Khalsa, Co-Founder of Holonym, discards this claim.
Given that Ethereum’s governance and consensus mechanisms rely on validators rather than token holders, the Lazarus Group holding such a substantial amount of ETH does not compromise the network’s overall decentralization.
“Lazarus still owns less than 1% of ETH in circulation, so I don’t see it as highly relevant beyond simple optics. While it’s a lot of ETH, they still own less than 1%. I’m not worried at all,” Khalsa told BeInCrypto.
Kadan Stadelmann, Chief Technology Officer at Komodo Platform, agreed, emphasizing that Ethereum’s infrastructure design is the source of its weakness.
“It proves a vulnerability in Ethereum’s architecture: illicit actors could expand their holdings further by targeting exchanges or DeFi protocols, and thus wield an influence over market dynamics and possibly change governance decisions in Ethereum’s off-chain processes by voting on improvement proposals. While Ethereum’s technical decentralization has not been compromised, Lazarus Group has eroded trust in Ethereum,” Stadelmann told BeInCrypto.
However, while token holders cannot influence Ethereum’s consensus mechanisms, they can manipulate markets.
Potential Impacts and Market Manipulations
Though the Bybit hackers have already finished laundering the stolen ETH, Stadelmann outlined a series of possible scenarios that the Lazarus Group could have carried out with the massive wealth they originally accumulated. One option is staking.
“Ethereum’s Proof-of-Stake security relies on honest validators and resilience of wallets, exchanges, and dApps. While the Lazarus Group’s haul doesn’t threaten the blockchain’s consensus mechanism, since their holdings are not known to be staked, it certainly raises the spectre that this could be achieved. They’re unlikely to do this, as the funds they’ve stolen have been tracked,” he explained.
Along equally unlikely lines, the Bybit hackers could cause a significant market downturn by selling their holdings altogether.
“Their holdings do give them an opportunity to manipulate markets, such as if they dump their holdings. This would be difficult to do since their ETH are flagged. If they try to exchange the ETH via selling, their assets could be frozen,” Stadelmann added.
What Stadelmann is most worried about looking toward the future is the impact hacks can have on Ethereum’s Layer 2 protocols.
“Lazarus and its partners could attempt to attack Layer 2 protocols like Arbitrum and Optimism. A censorship attack on layer 2 could undermine dApps and cause the ecosystem to move towards centralized transaction sequencers. That would underscore Ethereum’s weakness,” he said.
While Ethereum’s network was not compromised, Safe Wallet’s attacks underscored the vulnerabilities in the security of the greater ecosystem.
“The breach has certainly increased tensions in the ecosystem, and created an uneven token distribution. The question remains: will Lazarus or other hacking groups associated with state actors attempt to exploit the Ethereum ecosystem, particularly at layer 2?” Stadelmann concluded.
It also raised questions about the need for better security standards.
Verification Over Trust
Khalsa argued that the Bybit hack, while not a threat to Ethereum’s core security, highlighted the need for improved security standards among users.
“Saying the hack is Ethereum’s problem is like saying death by car accident is the car’s problem when the driver didn’t wear a seatbelt. Could the car have more safety measures? Yes, and it should. But as a seatbelt has little to do with the car, the hack had little to do with Ethereum. It’s a protocol and it worked exactly as intended. The problem is the lack of convenience and know-how for securely custodying digital assets,” he said.
Specifically, the incident exposed vulnerabilities within multi-signature wallets, demonstrating that reliance on third-party integrations can introduce significant risks, even with robust internal security. Ultimately, even the most sophisticated wallet security measures become ineffective if the signing process can be compromised.
Khalsa emphasized that proven self-custody security measures exist, while multi-signature wallets are not among them. He added that government agencies should have long ago advocated for superior security standards and practices.
“The repercussion we can all hope for is getting serious about stopping North Korea from stealing more funds. While it’s not the government’s place to change how self-custody is carried out, it is absolutely the government’s place to encourage better industry ‘best practices.’ This attack was due to the myth that multisigs of hardware wallets are secure. Sadly it took this attack for it to be acknowledged, but better standards set by government agencies could encourage safer practices without the need for $1.5 billion compromises to wake up the industry,” he asserted.
The incident also exposed the need to verify transactions rather than trust third-party applications.
A Solution to Front-End Vulnerabilities
By injecting malicious JavaScript into vulnerable Safe Wallet cloud servers, the Lazarus Group launched a sophisticated attack, enabling them to mimic the interface and trick users.
According to Erick de Moura, co-founder of Cartesi, this exploit highlights a critical vulnerability. The issue lies in the reliance on centralized build and deployment pipelines within a system intended for decentralization.
“The SAFE incident serves as a stark reminder that Web3 is only as secure as its weakest link. If users cannot verify that the interface they interact with is genuine, decentralization becomes meaningless,” he said.
De Moura also added that a common misconception in Web3 security is that smart contract breaches are among the most effective forms of hacking exchanges. However, he deems that the Lazarus Group’s strategy on Bybit proves otherwise. Injecting malicious code into the front-end or other off-chain components is much more seamless.
“The hackers didn’t need to breach smart contracts or manipulate ByBit’s systems directly. Instead, they injected malicious code into the front-end interface, deceiving users into thinking they were engaging with a trusted platform,” he explained.
Despite these vulnerabilities, a transition from trust-based to verifiable security is possible.
The Case for Reproducible Builds
De Moura views the Bybit hack as a wake-up call for the Web3 community. As exchanges and developers reassess their security, he argues that verifiable, reproducible builds are essential to prevent future attacks.
“At its core, a reproducible build ensures that when source code is compiled, it always produces the same binary output. This guarantees that the software users interact with hasn’t been altered by a third party somewhere in the deployment pipeline,” he said.
Blockchain technology is vital to ensure that this process takes place.
“Imagine a system where every software build generates binaries and resources in a verifiable way, with their fingerprints (or checksums) stored on-chain. Instead of running such builds on cloud servers or computers that are prone to security breaches, they can be executed on dedicated blockchain co-processors or decentralized computational oracles,” De Moura told BeInCrypto.
Users can compare the checksum of the front-end resources they are loading against on-chain data through a browser plugin or feature. A successful match indicates an authentic build interface, whereas a discrepancy signals a potential compromise.
“If a verifiable reproducible builds approach had been applied to SAFE, the exploit could have been prevented. The malicious front-end would have failed verification against the on-chain record, immediately exposing the attack,” De Moura concluded.
This approach presents a helpful alternative to relying on users with varying levels of self-custody knowledge.
Addressing Gaps in User Knowledge
As attacks grow more sophisticated, the lack of user knowledge about how to securely custody digital assets presents a significant vulnerability.
The Bybit hack frustrated users who originally thought that reliance on third-party integrations would be enough to safeguard their assets. It also affected the broader perception of cryptocurrency security.
“It shows crypto is still in the Wild West and in its growing phase in terms of security. I think in a couple years we will have superior security but in its current state, the public fear is well-justified,” Khalsa said.
Ultimately, embracing different approaches will be essential for the Web3 community to build a more secure and resilient ecosystem. A good starting point is to demand better industry practices and evaluate the integration of verifiable, reproducible builds.
Disclaimer
Following the Trust Project guidelines, this feature article presents opinions and perspectives from industry experts or individuals. BeInCrypto is dedicated to transparent reporting, but the views expressed in this article do not necessarily reflect those of BeInCrypto or its staff. Readers should verify information independently and consult with a professional before making decisions based on this content. Please note that our Terms and Conditions, Privacy Policy, and Disclaimers have been updated.
-

 Market23 hours ago
SuperRare (RARE) Surges 50% – Is a Correction Coming?
-

 Altcoin23 hours ago
Ripple Whale Moves $367M Amid Market Crash, What Next?
-

 Market24 hours ago
3 Altcoins to Watch in the Second Week of March 2025
-

 Altcoin24 hours ago
MOVE Surges 6% Amid Movement Mainnet and Rex ETF Filing
-

 Market22 hours ago
Market Panic and What’s Next?
-

 Altcoin21 hours ago
Ethereum Price Eye Bullish Breakout as This Pattern Develops
-

 Regulation21 hours ago
Acting SEC Chair Mark Uyeda Seeks to Drop Rule That Targets DeFi Exchanges
-

 Market20 hours ago
SEC Drops Rule Targeting Crypto Exchanges, Shifts Approach


