
Market
What Major Holder Activity Shows

FET price is showing some unusual patterns that could impact its direction in the near future. Recent activity from major holders has caught attention, raising questions about what’s next for the token. While certain indicators point to potential gains, others suggest there might be caution among larger investors.
These conflicting signals are creating uncertainty around the short-term outlook. With the market closely watching, FET’s next move could be pivotal.
FET Whales Are Sending Paradoxical Signs
Big holders of FET have been showing paradoxical signs in recent days. Monitoring the actions of a coin’s whales is crucial because it provides insights into potential market moves, as large-scale holders can influence the price with their buy or sell decisions.
On September 28, there were 69 holders with between 100,000 and 1,000,000 FET tokens, and by September 30, this number had risen to 82, marking an 18% increase in just a few days. However, during the same period, holders with between 1,000,000 and 10,000,000 FET tokens dropped from 13 to 10.
Read more: Top 9 Artificial Intelligence (AI) Cryptocurrencies in 2024
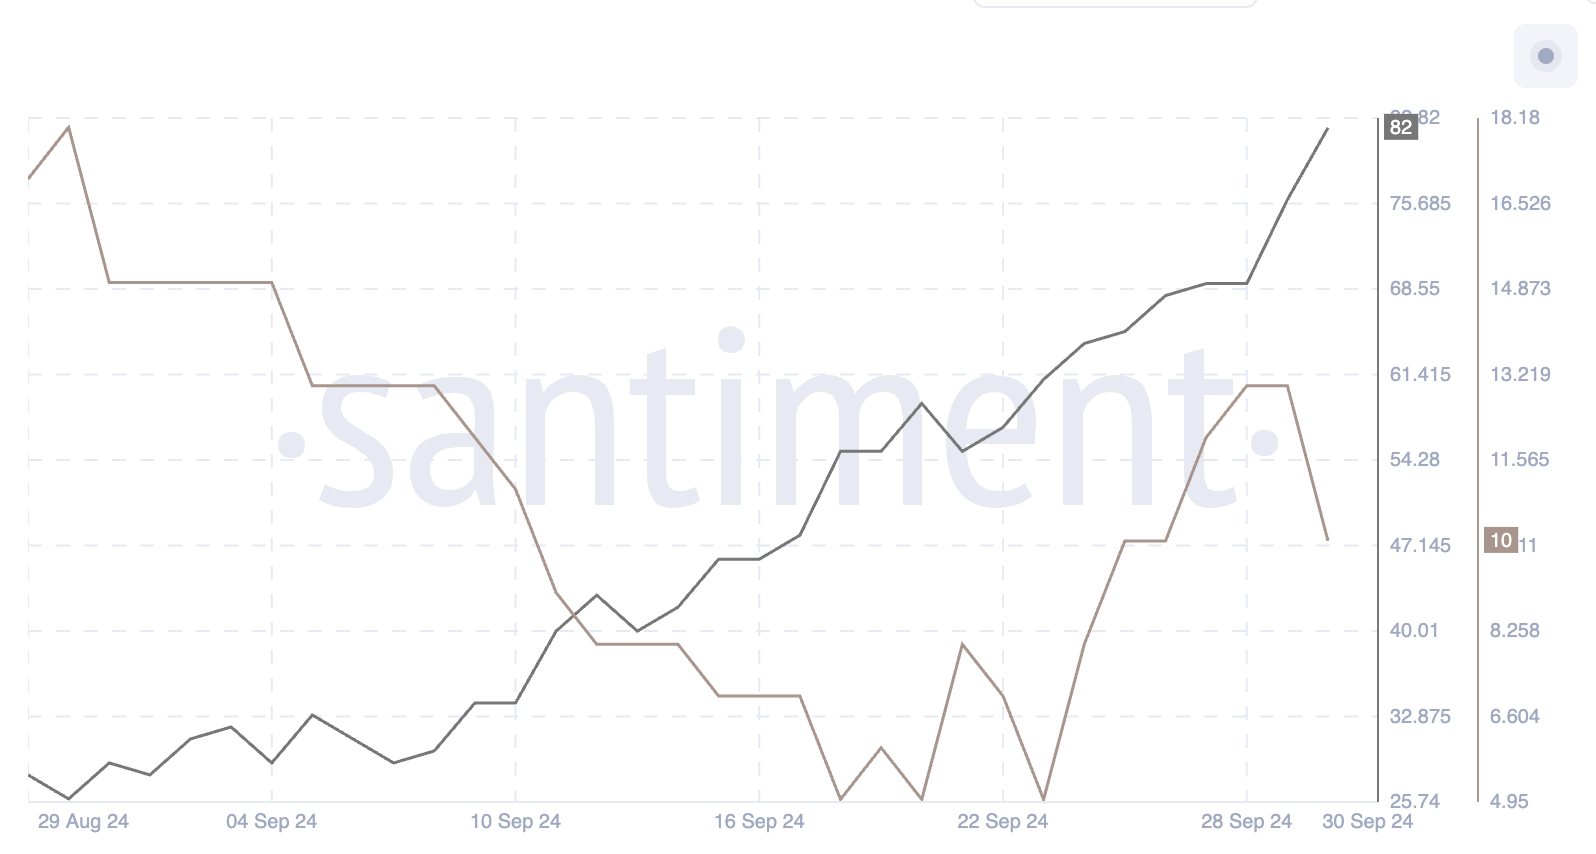
This situation is unusual because while smaller large holders are accumulating, the biggest holders are reducing their positions, which could indicate a mixed sentiment in the market.
For FET’s price, this divergence might suggest some short-term upward momentum from new buyers, but the retreat of the largest holders could signal caution or potential selling pressure ahead.
Social Dominance Is Down
FET’s Social Dominance 7-day Moving Average has seen a sharp decline, falling to 0.123%, down from 0.336% just a day ago and 0.668% on September 24. This decline matters because social dominance measures the level of attention and discussion a coin is receiving relative to the overall market.
A drop in this metric suggests fading interest or hype around the asset. Reduced social buzz often aligns with lower buying activity or enthusiasm from retail investors, indicating that excitement around FET may be waning for the time being.
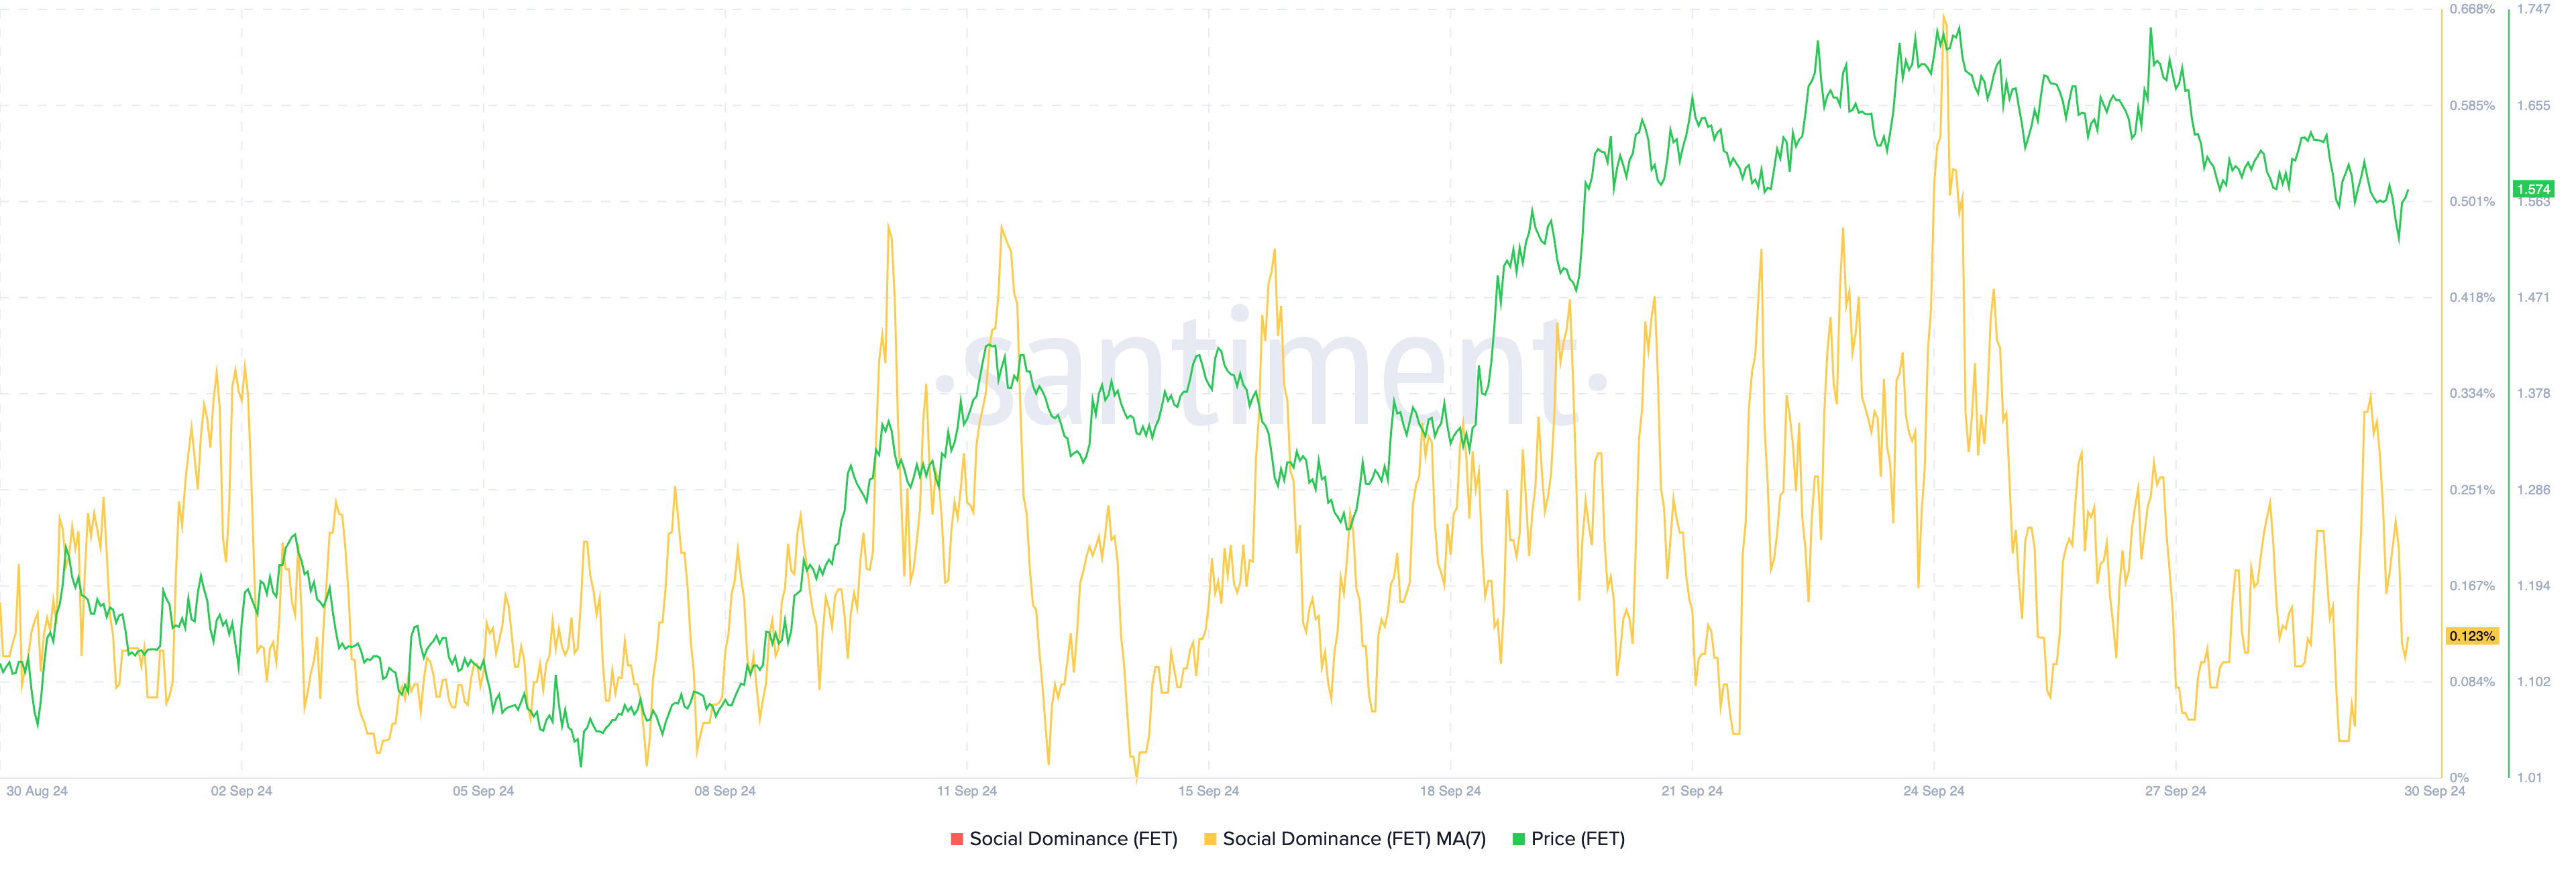
However, it’s important to note that FET’s Social Dominance 7D MA hovered around 0.123% last month as well, yet that didn’t stop its price from climbing in the following days.
For example, between September 7 and September 12, FET rose from $1.07 to $1.42, showing that even with low social dominance, price increases are still possible if other factors drive demand.
FET Price Prediction: Can It Reach $1.87 Soon?
According to the In/Out of the Money Around Price chart, FET faces strong resistance at $1.68 and weaker resistance at $1.73. If these levels are broken, FET could quickly rise to $1.87, offering a potential gain of 14.7%. That could be driven by all the hype around artificial intelligence coins, which appear to be on the rise lately.
The In/Out of the Money Around Price metric tracks the distribution of holders who are in profit (in the money) or at a loss (out of the money) based on their entry price, providing insights into where selling pressure or buying support might come from.
It highlights key resistance levels at which holders might sell to secure profits and support levels at which buyers may step in to prevent further decline.
Read more: How To Invest in Artificial Intelligence (AI) Cryptocurrencies?
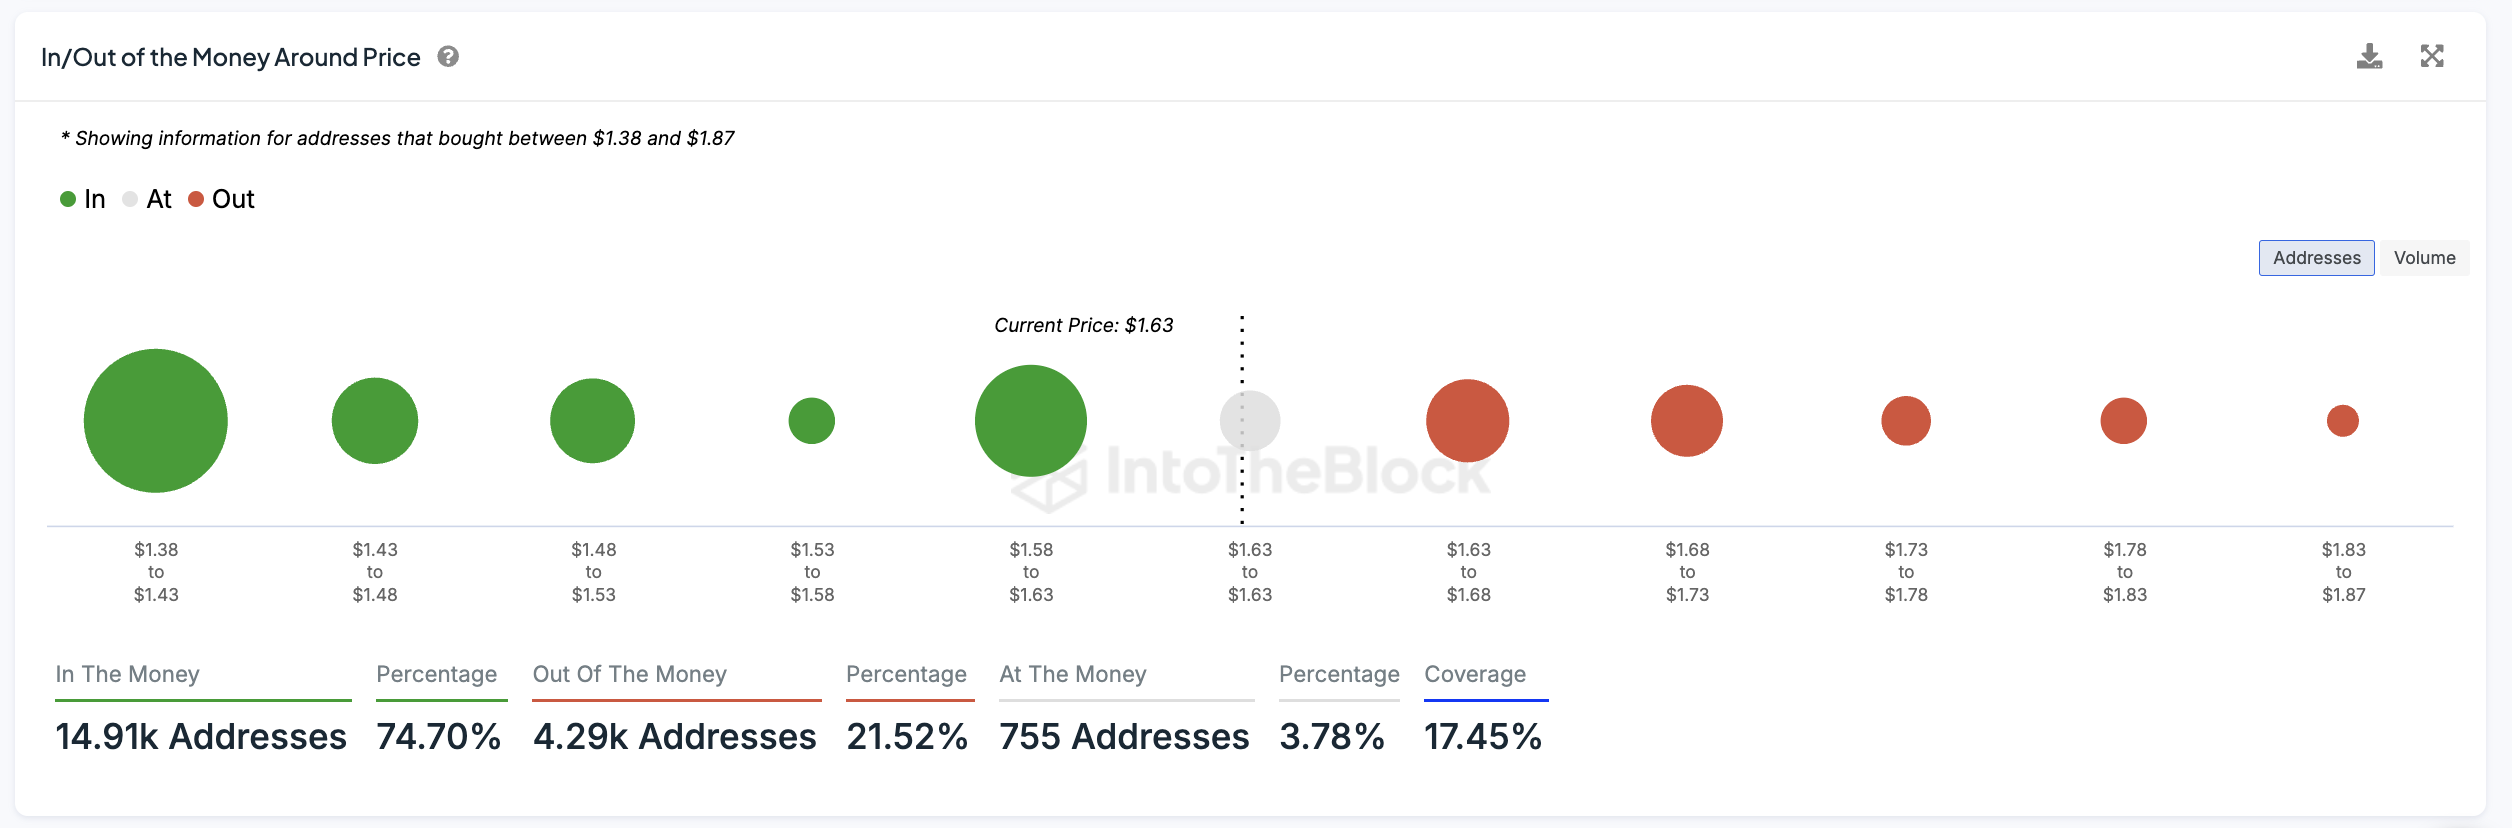
However, if FET’s current trend reverses, there’s strong support at $1.58, but if that fails to hold, the price could drop as low as $1.38, indicating significant downside risk.
Disclaimer
In line with the Trust Project guidelines, this price analysis article is for informational purposes only and should not be considered financial or investment advice. BeInCrypto is committed to accurate, unbiased reporting, but market conditions are subject to change without notice. Always conduct your own research and consult with a professional before making any financial decisions. Please note that our Terms and Conditions, Privacy Policy, and Disclaimers have been updated.


Wormhole (W) surged nearly 12% on Thursday after the project unveiled its official product roadmap. The project’s one-year anniversary has sparked speculative interviews.
However, technical data shows buyers and sellers locked in a fierce battle, as momentum indicators suggest a weakening trend. The DMI, Ichimoku Cloud, and EMA structures all reflect market indecision, with no clear direction confirmed just yet.
Wormhole DMI Chart Shows Market Indecision
Wormhole’s DMI chart shows its ADX (Average Directional Index) has dropped to 21.69 from 27.59 just a day earlier, signaling that the recent trend may be losing strength.
The ADX is a key indicator used to measure the strength—not the direction—of a trend. Generally, values below 20 suggest a weak or non-existent trend, while values above 25 indicate a strong trend.
With ADX now hovering near the threshold, it suggests that the bullish momentum seen in recent days could be fading.
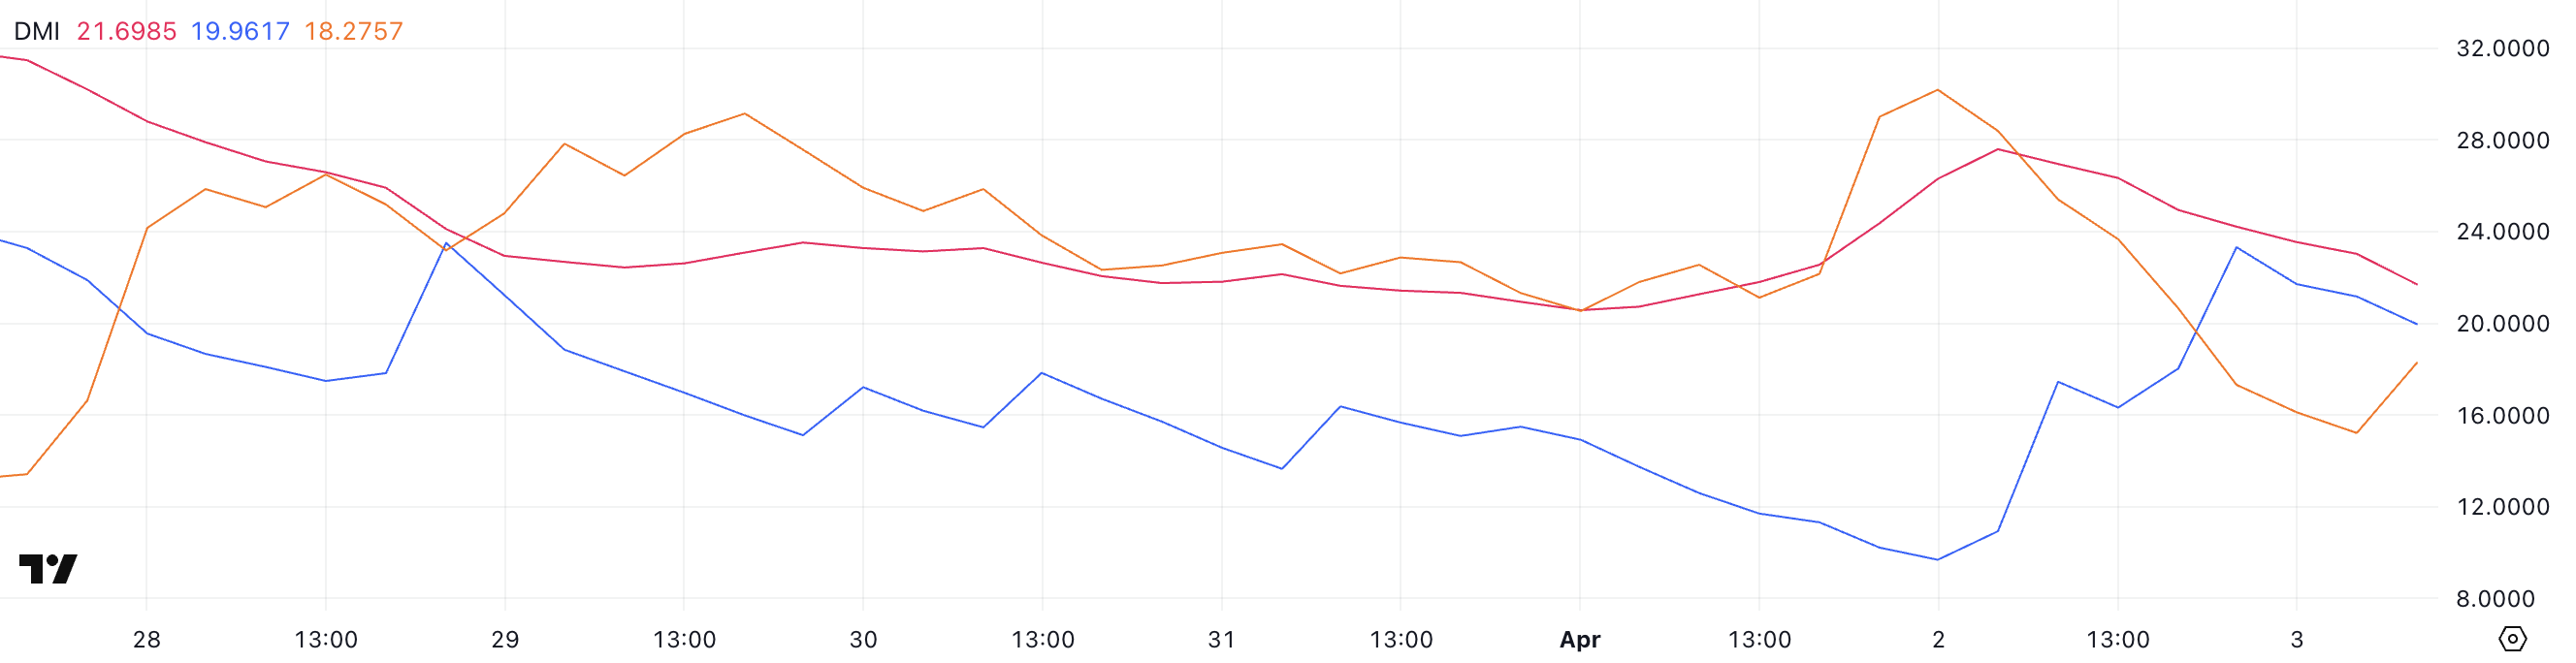
Looking deeper, the +DI (Positive Directional Indicator) has fallen to 19.96 after peaking near 24 earlier, though it had surged from 9.68 the previous day.
Meanwhile, the -DI (Negative Directional Indicator) climbed to 18.27 after dropping to 15.21 earlier, following a sharp decline from 30.18 yesterday. This narrowing gap between +DI and -DI—combined with a weakening ADX—suggests uncertainty and potential indecision in price action.
With a $137.64 million token unlock on the horizon, this shift could hint at a cooling bullish impulse and the risk of renewed selling pressure if supply outweighs demand.
Ichimoku Cloud Shows Mixed Signals
Wormhole’s Ichimoku Cloud chart shows a mixed outlook. Price action is attempting to break through resistance but still faces notable headwinds.
The Tenkan-sen (blue line) has recently flattened and is closely aligned with the Kijun-sen (red line), signaling indecision or a potential pause in momentum.
Typically, when these lines are flat and close together, it indicates consolidation rather than a clear trend continuation or reversal.
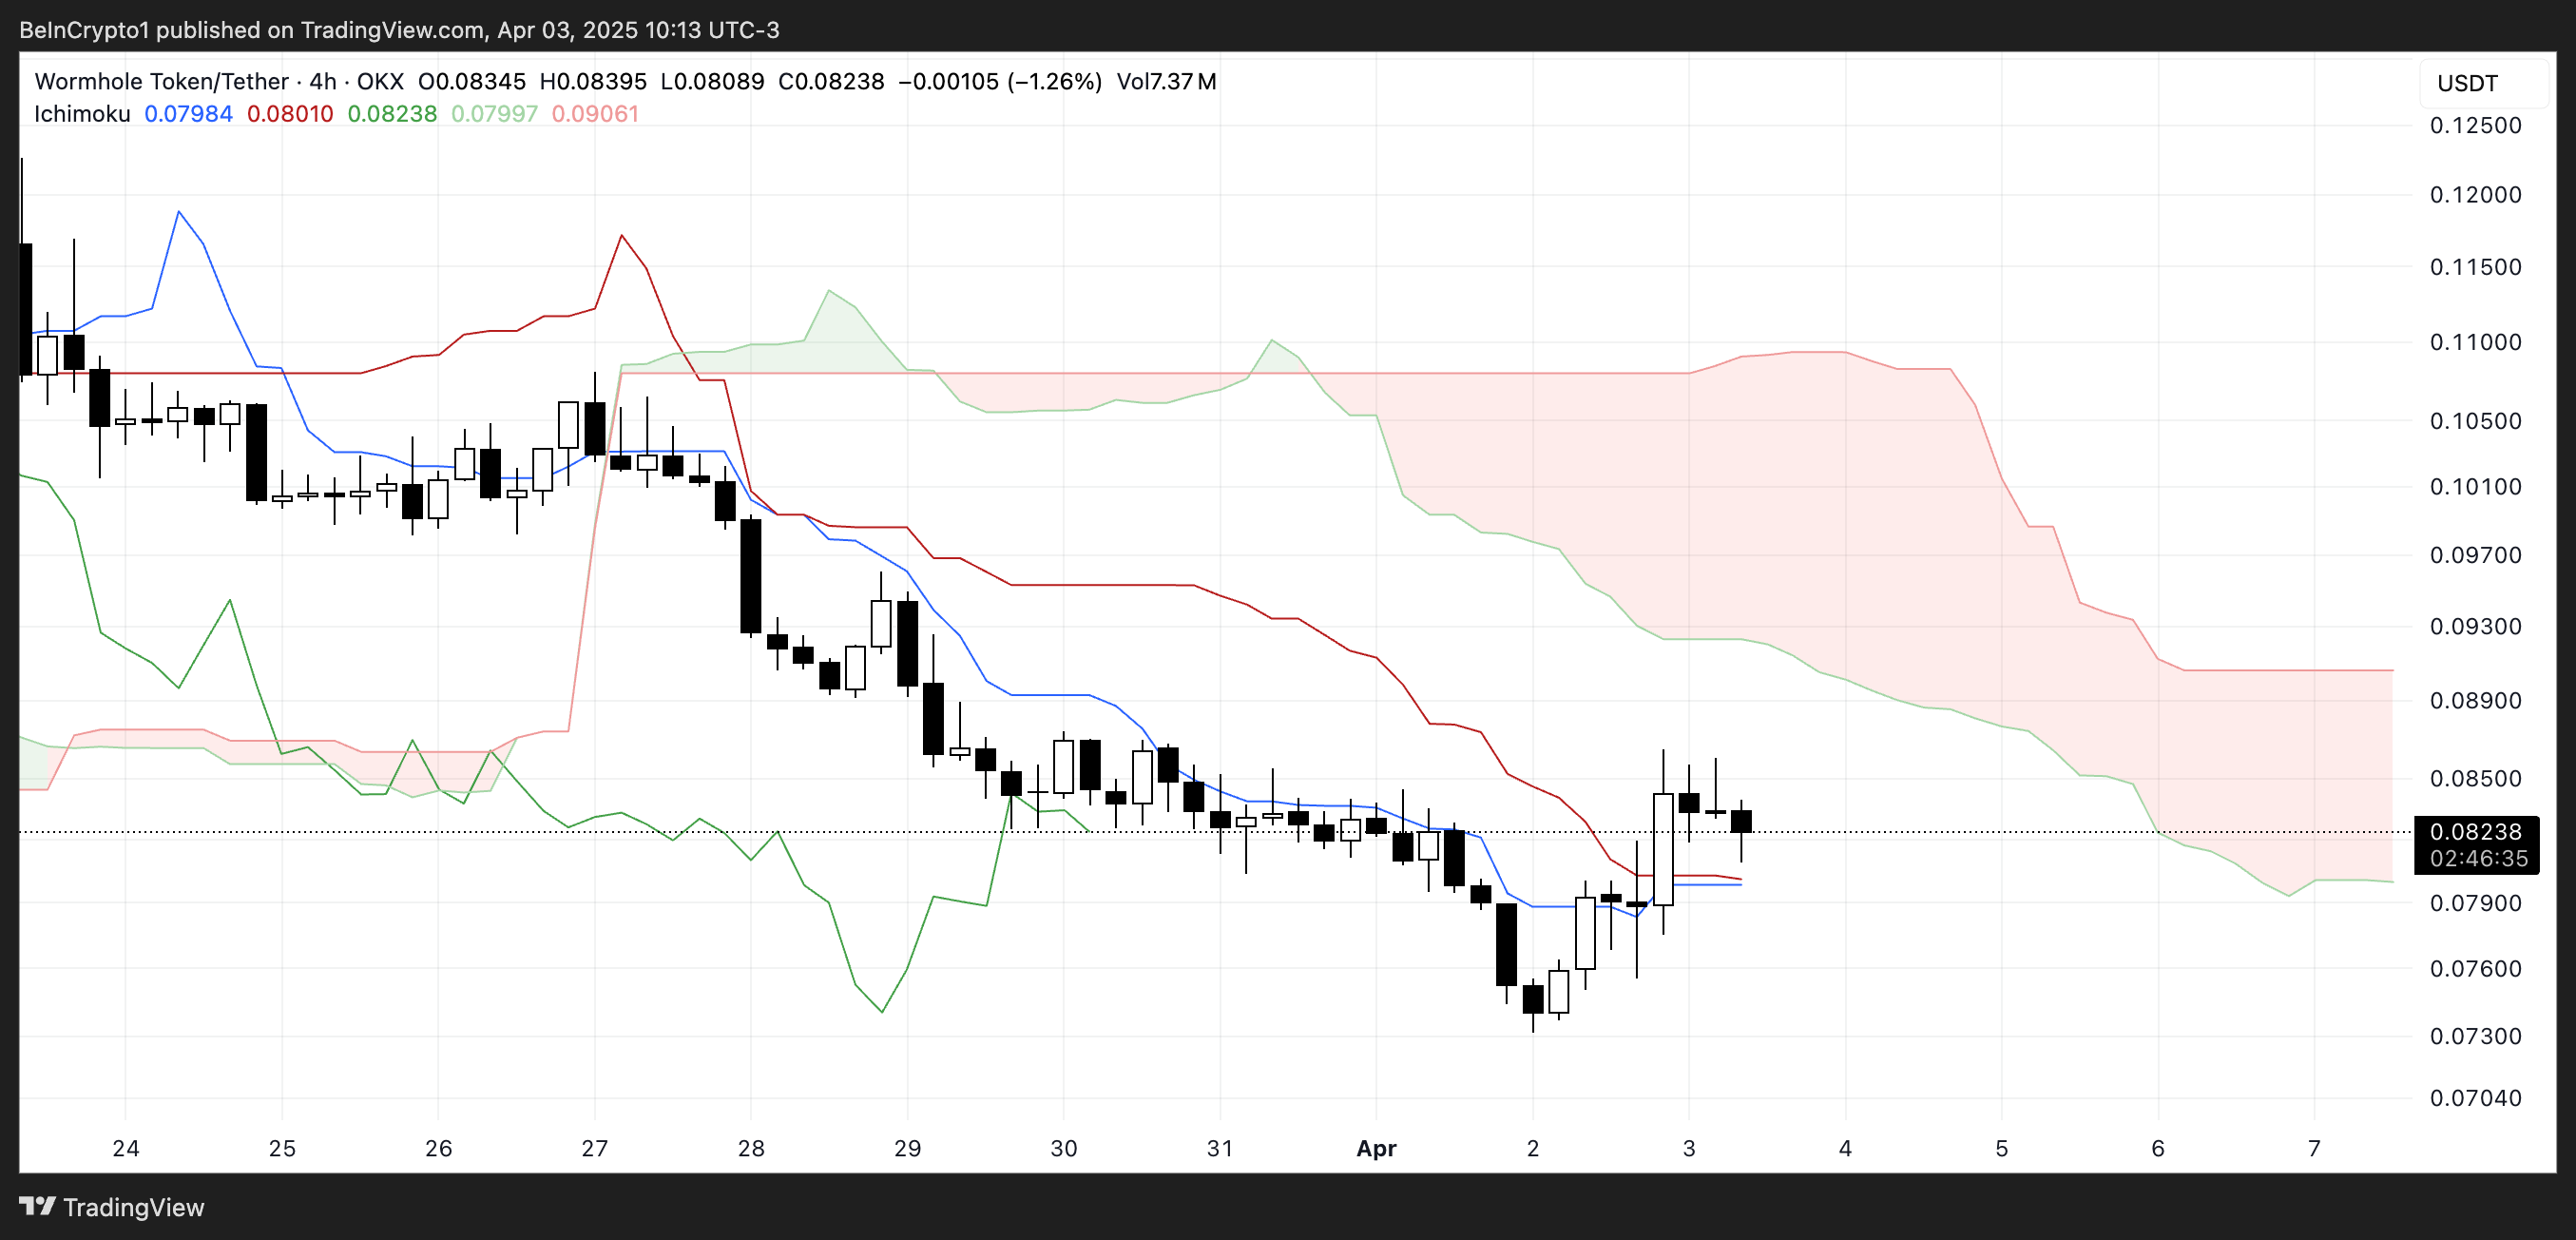
Meanwhile, the Kumo (cloud) remains thick and red ahead, reflecting strong overhead resistance and a bearish long-term bias.
The price is hovering near the lower edge of the cloud but has yet to make a decisive move above it—suggesting that bullish momentum is tentative at best.
For a confirmed trend reversal, a clean break above the cloud with bullish crossovers would be needed. Until then, the chart points to a market still trying to find direction, especially ahead of a major token unlock event that could further impact sentiment and price action.
Will Wormhole Reclaim $0.10 In April?
Wormhole, which builds solutions around interoperable bridges, continues to see its EMA setup reflect a bearish structure. Short-term moving averages are still positioned below the longer-term ones, an indication that downward pressure remains dominant.
However, one of the short-term EMAs has started to curve upward, hinting at a possible shift in momentum as buyers begin to step in. This early uptick could signal the beginning of a trend reversal, though confirmation is still pending.
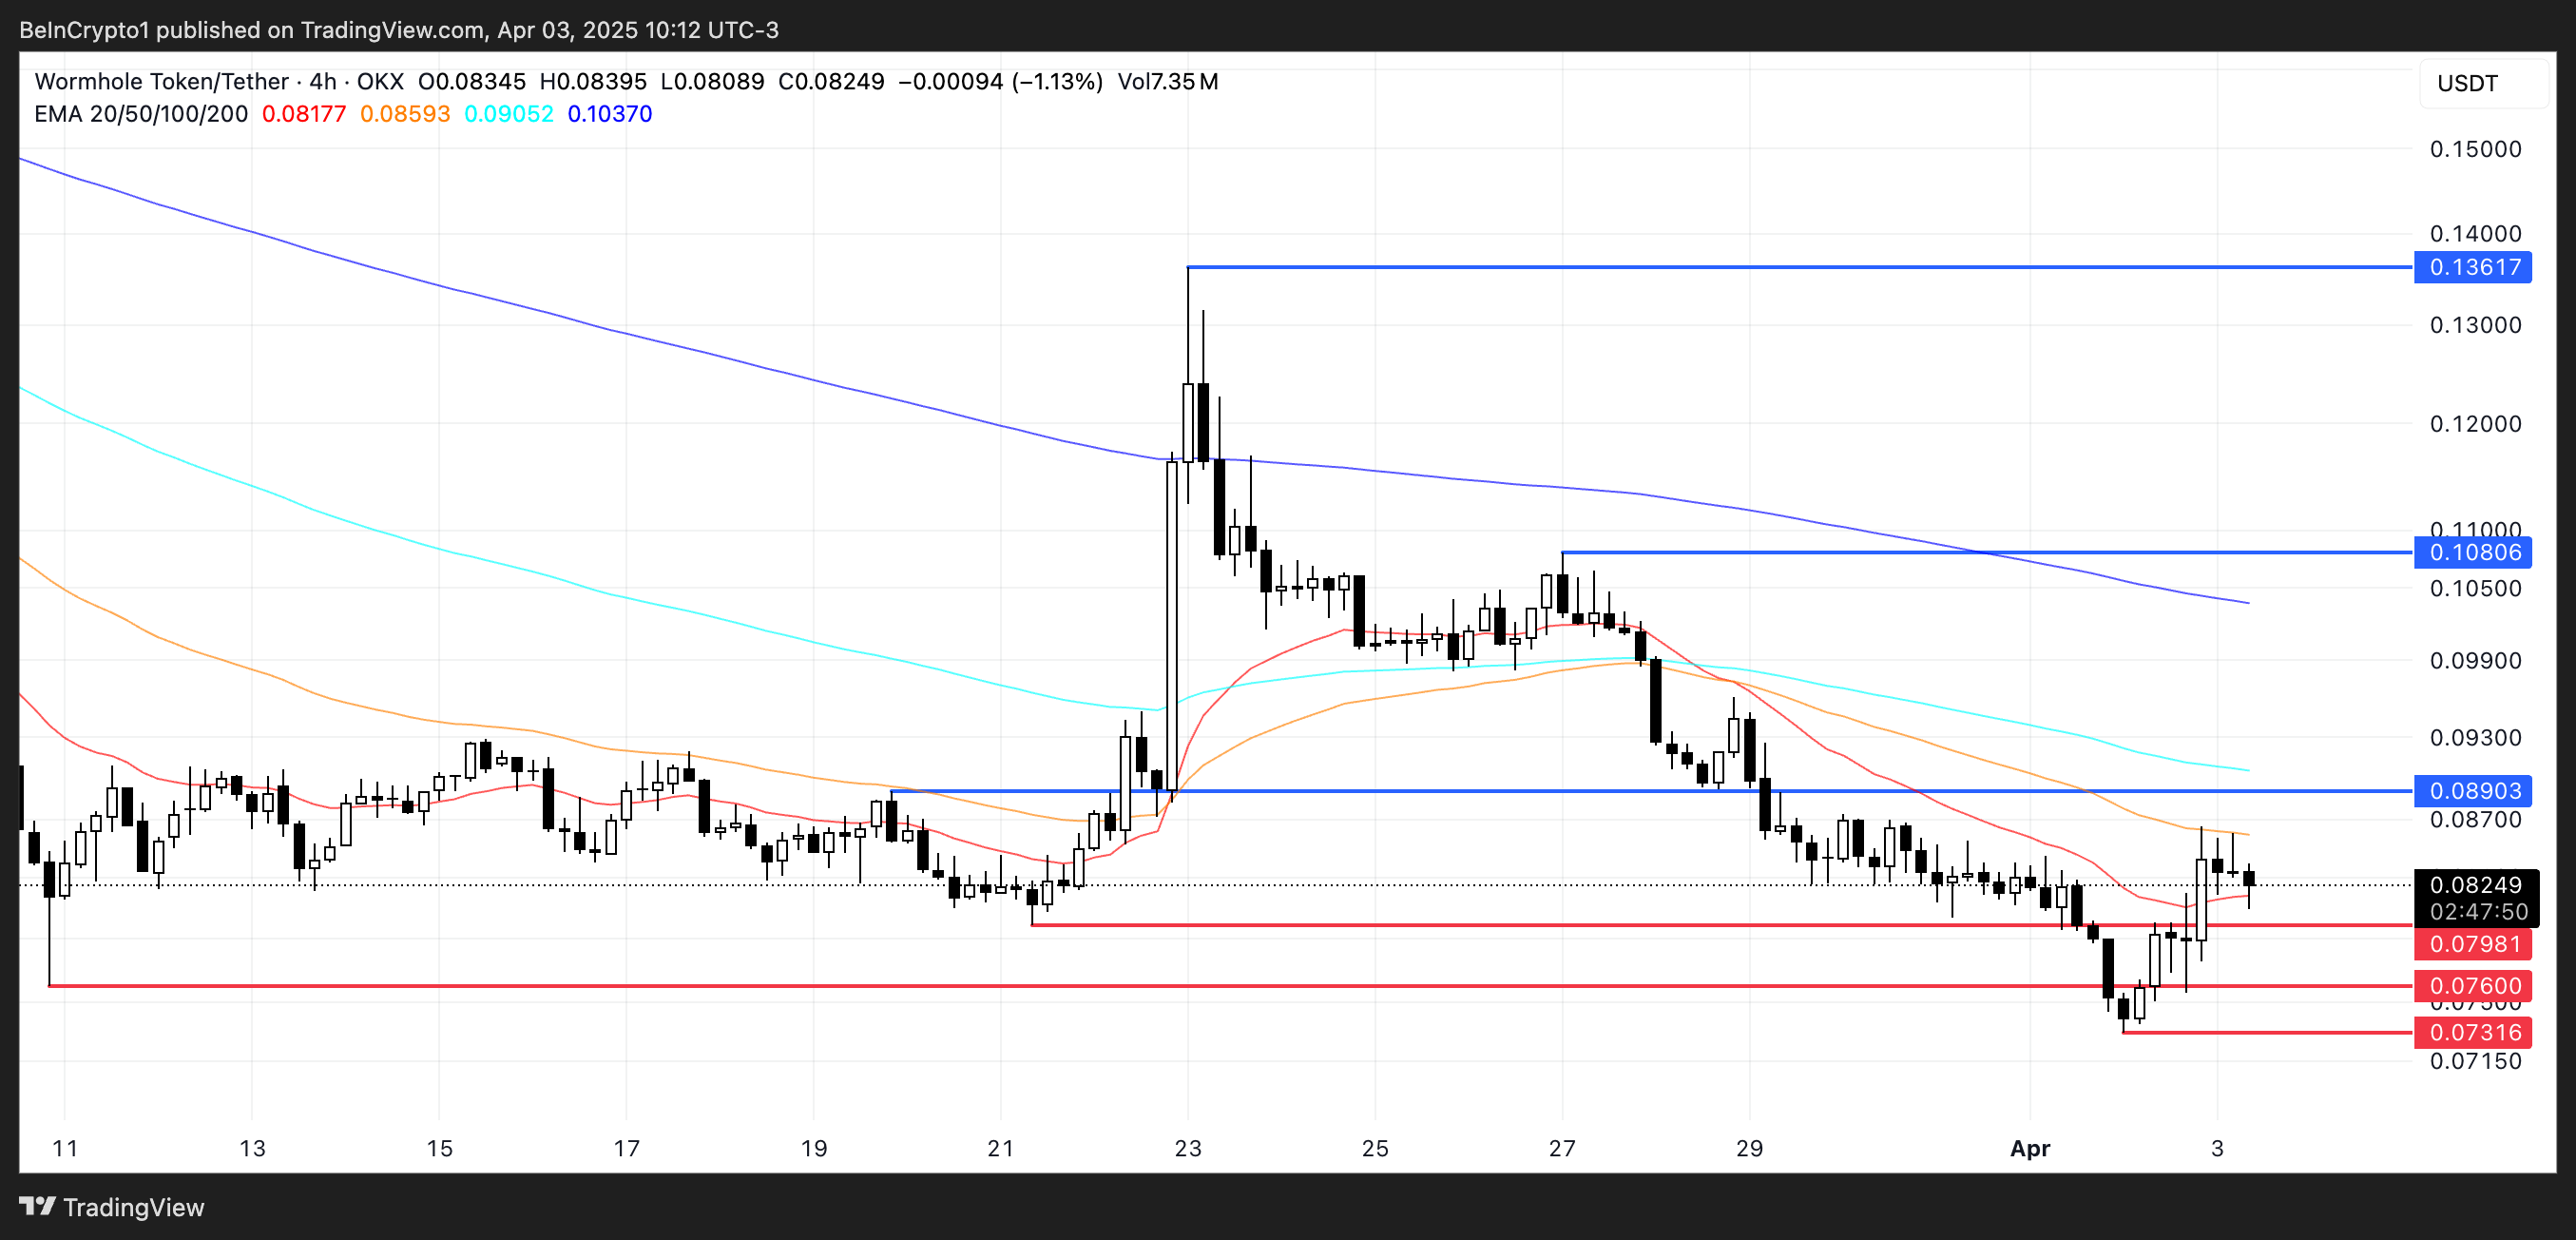
If bullish momentum gains traction, Wormhole may attempt to break the nearby resistance at $0.089. A successful breakout could open the door for a move toward higher resistance levels at $0.108 and even $0.136.
Conversely, failure to clear $0.089 could reinforce bearish control, pushing the price back to test support at $0.079.
A break below that level could expose W to further downside toward $0.076, $0.073, and potentially below $0.07—marking uncharted territory for the token.
Disclaimer
In line with the Trust Project guidelines, this price analysis article is for informational purposes only and should not be considered financial or investment advice. BeInCrypto is committed to accurate, unbiased reporting, but market conditions are subject to change without notice. Always conduct your own research and consult with a professional before making any financial decisions. Please note that our Terms and Conditions, Privacy Policy, and Disclaimers have been updated.

XRP is under pressure, down nearly 6% in the past 24 hours and teetering just above the $2 mark as bearish momentum builds. A $1.02 billion unlock from Ripple’s escrow has sparked fresh concerns about oversupply, with tokens moved to operational wallets possibly poised for distribution.
At the same time, network activity has collapsed 87% since mid-March and technical indicators like DMI and EMA lines suggest growing downside risk. With weakening trend strength and fading demand, XRP may struggle to hold key support levels unless a catalyst revives bullish sentiment.
Ripple Wallet Activity Sparks Fears
Onchain data shows that Ripple has unlocked 500 million XRP—worth around $1.02 billion—from its escrow account.
The tokens were moved from the “Ripple (27)” escrow address to two operational wallets, “Ripple (12)” and “Ripple (13),” potentially positioning them for distribution or sale.
While the escrow account still holds another 500 million XRP, the movement of such a large amount into accessible wallets often raises concerns about increased market supply. If Ripple sells a portion of these tokens, it could create short-term selling pressure on XRP’s price.

From a technical standpoint, XRP’s DMI chart is flashing bearish signals. The ADX, which measures trend strength, has sharply declined to 26.68 from 42.45 just two days ago, suggesting the recent trend is weakening.
Meanwhile, the +DI has dropped to 12.91, down from 22 yesterday—indicating a decline in bullish momentum. At the same time, the -DI has surged to 27.43 from 15.64, pointing to rising bearish pressure.
This shift in directional strength, combined with the large token unlock, suggests XRP may face further downside unless demand quickly absorbs the incoming supply.
XRP Network Activity Collapses 87%
XRP’s network activity surged to record highs in March, with 7-day active addresses reaching an all-time peak of 1.22 million on March 18.
However, that momentum quickly faded, with the number now plummeting to just 158,000—an 87% drop in less than three weeks.
This dramatic reversal suggests that the recent spike in engagement may have been short-lived or event-driven rather than indicative of sustained adoption or growing user demand.
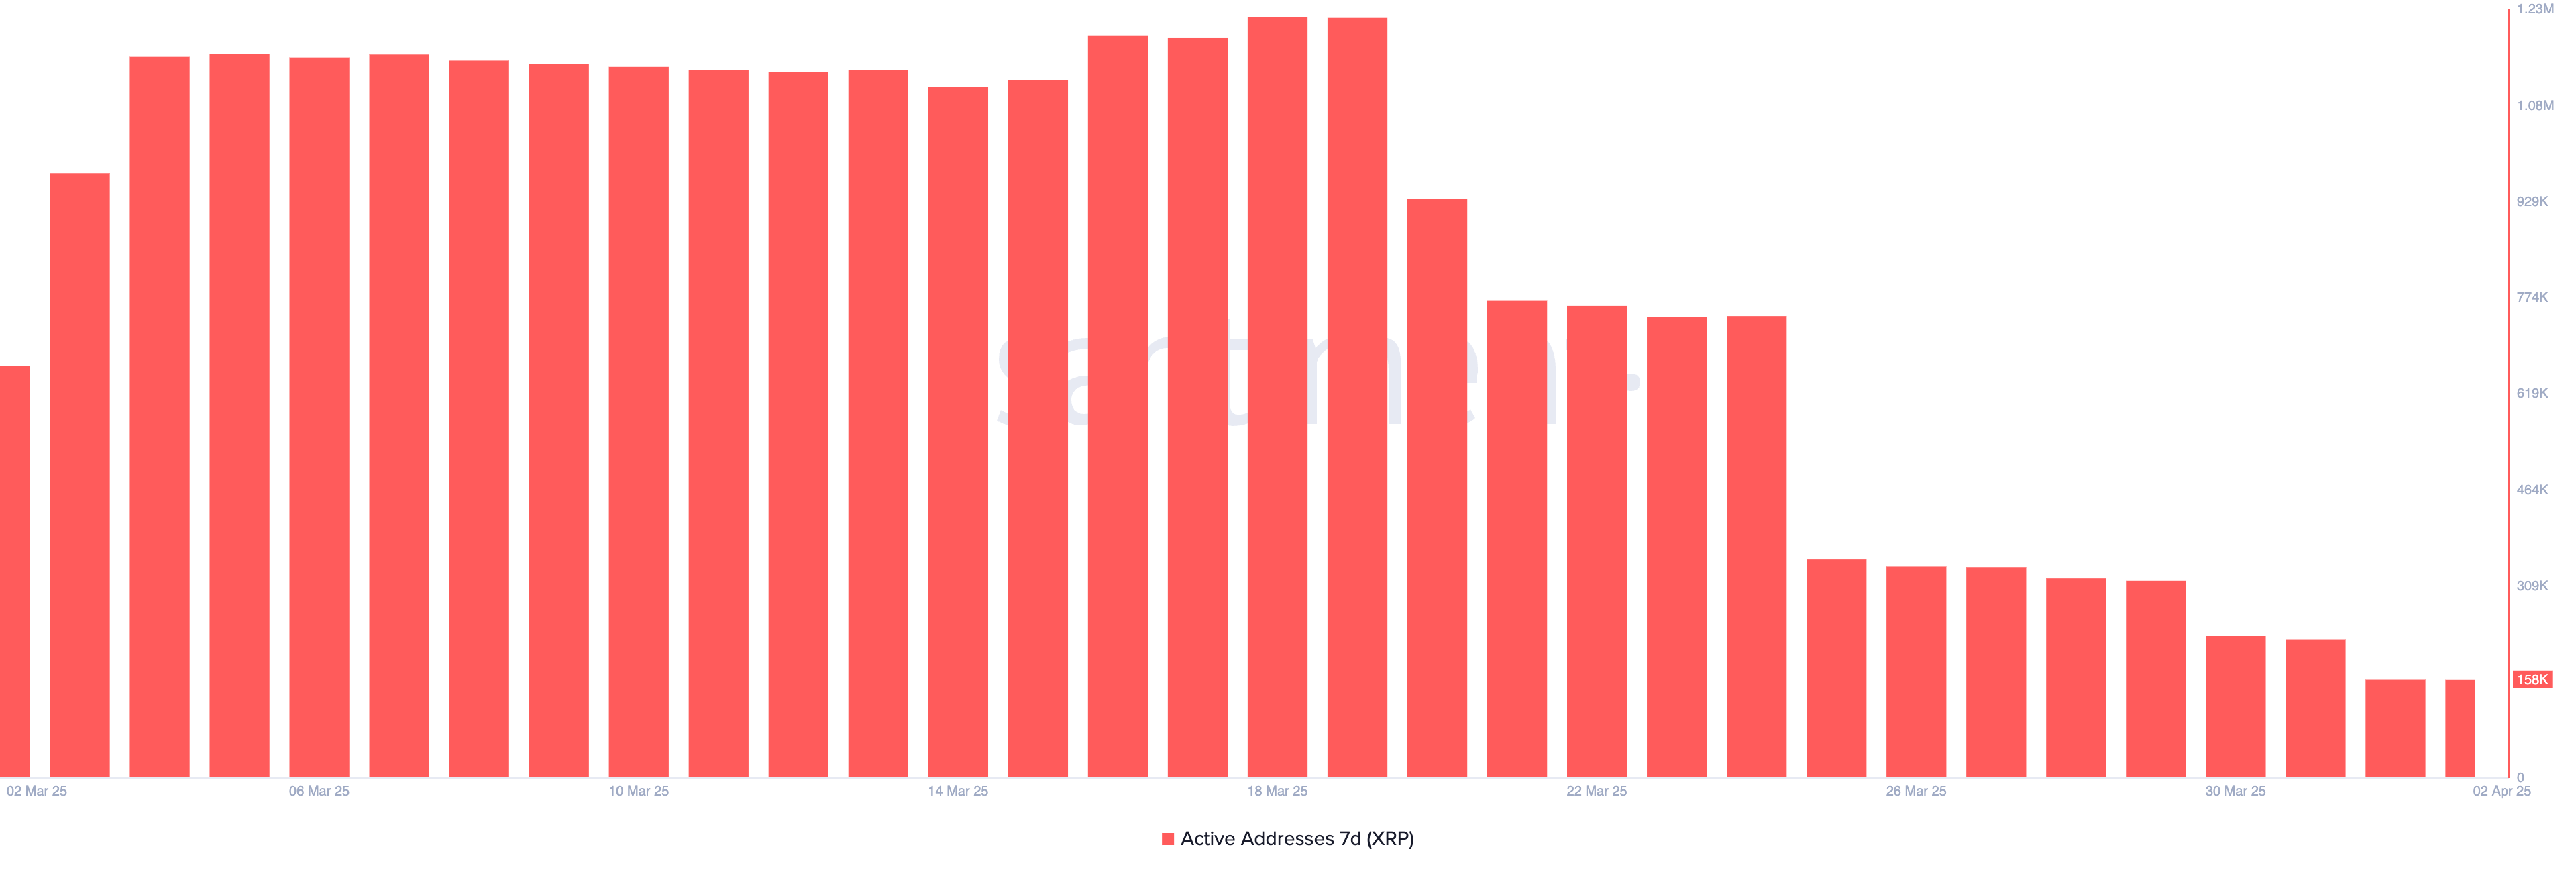
Tracking 7-day active addresses is a key on-chain metric, offering insight into how frequently a token’s network is being used. High activity can signal strong user interest and utility, often aligning with price support or rallies.
On the other hand, sharp declines in active addresses—like what XRP is now experiencing—can signal waning demand, decreasing network usage, and potential selling pressure.
With such a steep drop in activity, XRP’s price may struggle to find an upside unless new catalysts reignite user engagement.
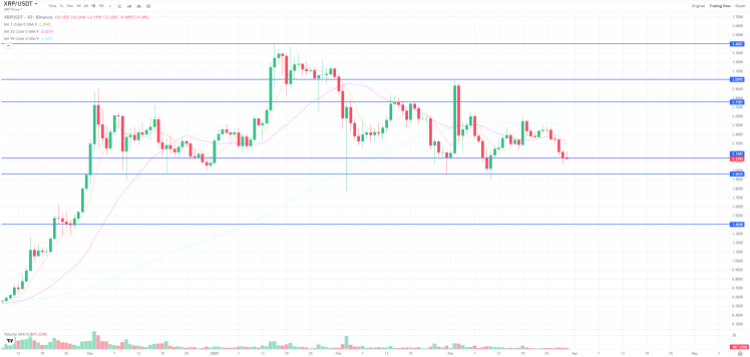
XRP Faces Strong Downtrend, But Eyes Rebound If Key Levels Break
XRP’s EMA structure clearly reflects a strong ongoing downtrend, with short-term moving averages positioned well below the long-term ones and a wide gap between them—signaling persistent bearish momentum.
Unless bulls step in soon, XRP price may be on track to test support around $1.90, a key level that has held in the past.
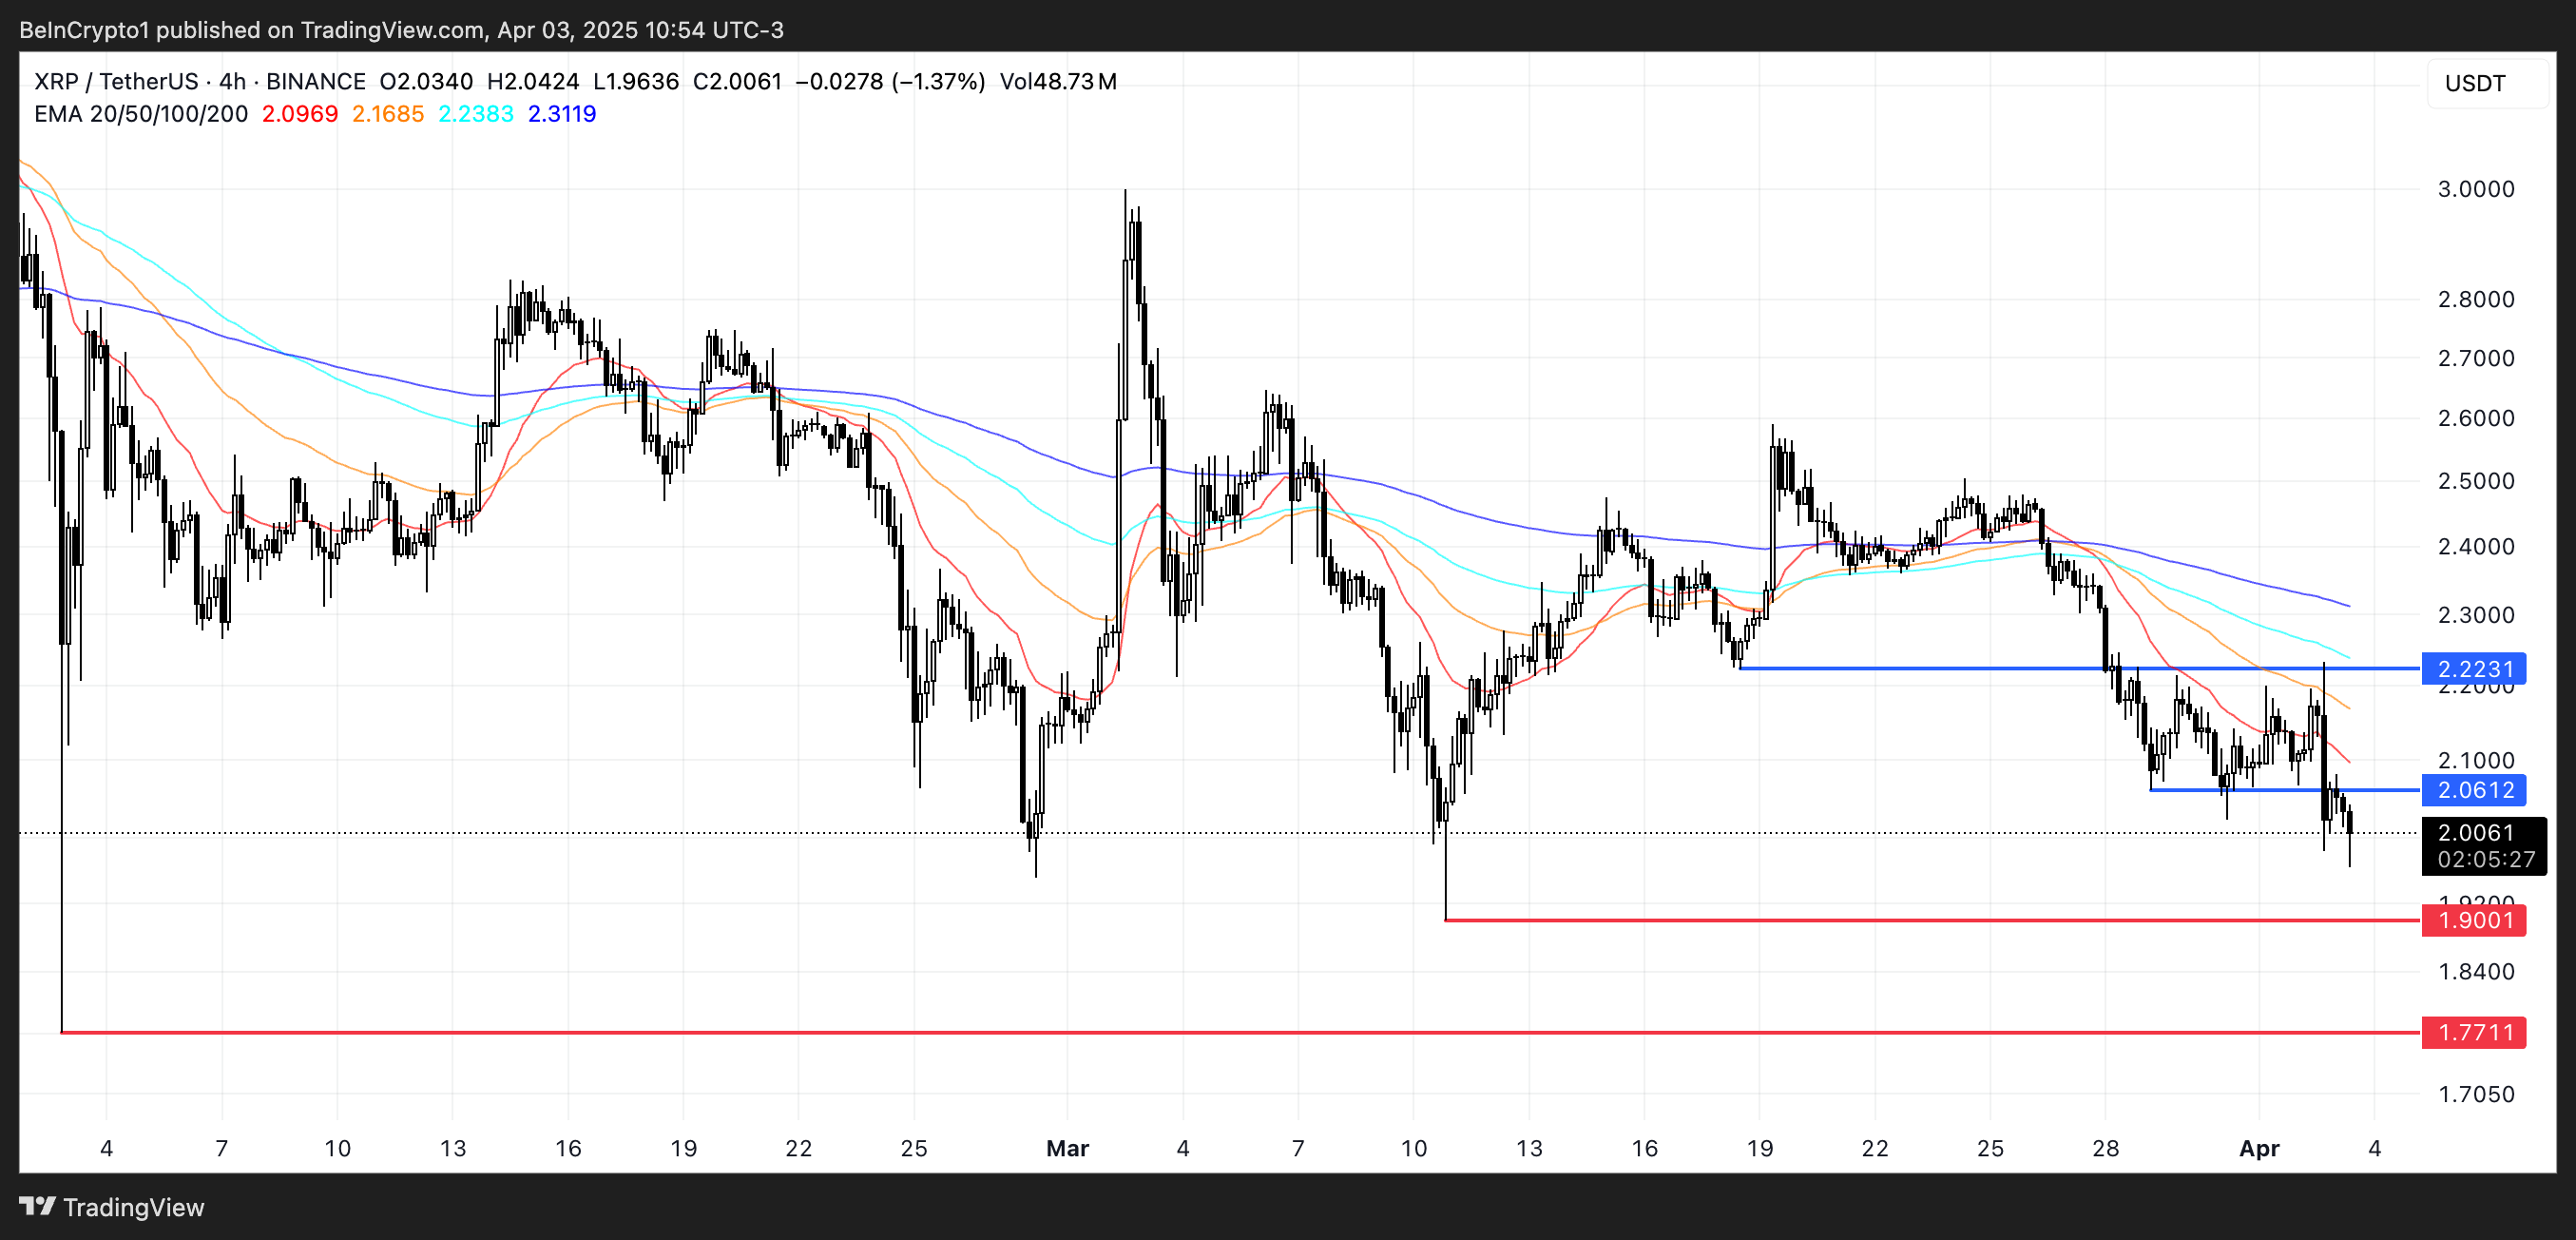
A break below it could expose the asset to further downside toward $1.77.
However, if XRP manages to reverse the current trend and regain upward momentum, it could climb to challenge resistance at $2.06.
A successful breakout above that level might pave the way for a continued rally toward $2.22.
Disclaimer
In line with the Trust Project guidelines, this price analysis article is for informational purposes only and should not be considered financial or investment advice. BeInCrypto is committed to accurate, unbiased reporting, but market conditions are subject to change without notice. Always conduct your own research and consult with a professional before making any financial decisions. Please note that our Terms and Conditions, Privacy Policy, and Disclaimers have been updated.

The crypto market watches with bated breath as XRP teeters at $1.97, a battleground where bullish conviction clashes with bearish determination. After a retreat from recent highs, the digital asset now faces a critical test.
The current standoff mirrors the broader tug-of-war in crypto markets, where sentiment shifts rapidly and key price levels dictate the next major move. For XRP, $1.97 isn’t just another number; it’s a line in the sand. A decisive hold here could reignite upward momentum, while a breakdown may embolden the bears.
Market Sentiment: Fear, Greed, Or Indecision?
According to Grumlin Mystery, a well-known crypto analyst, XRP is likely to experience a further downside in the near future, potentially dropping to $1.96. In his March 30th post on X, he highlighted that a decrease in liquidity within the crypto market is playing a crucial role in weakening XRP’s price stability, driven by the impact of US tariffs and the implementation of Trump’s policy changes.
Grumlin pointed out that restrictive trade policies and economic uncertainty have led to a slowdown in capital flow into riskier assets like cryptocurrencies. With reduced liquidity, market participants have less buying power, making it easier for bears to push prices lower. He warned that if these economic conditions persist, XRP could struggle to find strong support, and a drop below $1.96 could trigger further declines.
This drying up of liquidity has allowed sellers to gain the upper hand, exerting downward pressure on prices. As a result, XRP’s ability to hold support at $1.96 remains uncertain, and unless market conditions improve, a deeper correction could be on the horizon.
Grumlin Mystery further elaborated that a sharp change in Trump’s rhetoric regarding tariffs remains highly unpredictable, making it difficult to gauge its full impact on the financial markets, including cryptocurrencies. While many initially believed that Trump’s stance would be a major positive catalyst for the crypto market, the reality appears to be more complex.
The analyst emphasized that market uncertainty is increasing as traders struggle to anticipate the next move in U.S. economic policy. If Trump maintains or intensifies his tariff approach, it could further tighten liquidity conditions, making it even harder for XRP to sustain bullish momentum.
Possible Scenarios For XRP
If buyers successfully defend the $1.96 level, XRP could see renewed upside momentum. A bounce from this support zone might trigger a rally toward $2.64, where the next resistance lies. A breakout above this level raises the potential to $2.92 or even $3.4, confirming a bullish recovery. Increased trading volume and improving market sentiment would be key indicators of this scenario playing out.
Sellers’ failure to maintain control and XRP’s failure to hold above $1.96 may cause a sharper decline. In this case, the next critical support levels to watch would be $1.70 and $1.34. Breaking below these levels could expose the asset to more losses to $0.93 or lower.

Altcoin Season Still In Sight Even As Ethereum Struggles To Gain Upward Momentum

Wormhole (W) Jumps 10%—But Is a Pullback Coming?

Ripple Shifts $1B in XRP Amid Growing Bearish Pressure

US SEC Acknowledges Fidelity’s Filing for Solana ETF

XRP Battle Between Bulls And Bears Hinges On $1.97 – What To Expect

Binance Managed 94% of All Crypto Airdrops and Staking Rewards

2.52 Million Altcoins Are Ruining Crypto’s Future

Animoca Brands Valuation Tanks 75% In Two Years, Here’s Why

Crypto exchange BingX hacked for $43 million

Are The Big Players Losing Interest?

Hong Kong’s Securities Association Tips Authorities On Crypto Self-Regulation

Coinbase cbBTC Set to go Live on Solana
2.52 Million Altcoins Are Ruining Crypto’s Future
Animoca Brands Valuation Tanks 75% In Two Years, Here’s Why
Crypto exchange BingX hacked for $43 million
Are The Big Players Losing Interest?
Hong Kong’s Securities Association Tips Authorities On Crypto Self-Regulation
Coinbase cbBTC Set to go Live on Solana
-
 Altcoin23 hours ago
First Digital Trust Denies Justin Sun’s Allegations, Claims Full Solvency
-

 Market16 hours ago
XRP Price Under Pressure—New Lows Signal More Trouble Ahead
-
 Altcoin16 hours ago
Analyst Forecasts 250% Dogecoin Price Rally If This Level Holds
-

 Market15 hours ago
Cardano (ADA) Downtrend Deepens—Is a Rebound Possible?
-
 Altcoin19 hours ago
Binance Sidelines Pi Network Again In Vote To List Initiative, Here’s All
-

 Ethereum10 hours ago
Ethereum Trading In ‘No Man’s Land’, Breakout A ‘Matter Of Time’?
-

 Market14 hours ago
Ethereum Price Recovery Stalls—Bears Keep Price Below $2K
-

 Altcoin13 hours ago
VanEck Seeks BNB ETF Approval—Big Win For Binance?